


On August 6, 2019, the Bitcoin price reached a high of $12,325. A sharp decrease followed. BTC reached a low of $11,249 the next day. It has been increasing since. The highest price that has been reached was $12,153.
How long will Bitcoin continue to increase? Keep reading below if you want to find out.
For our previous analysis, click here.

Bitcoin Price: Trends and Highlights for August 8
- BTC/USD is following an ascending support line.
- It is trading above the 100-hour moving average.
- The price is trading inside a long-term descending channel.
- There is bearish divergence developing in the RSI.
- BTC is trading inside a short-term symmetrical triangle.
- There is support at $10,900.
Ascending Support
A look at the hourly time-frame shows that BTC has been following an ascending support line since July 29.
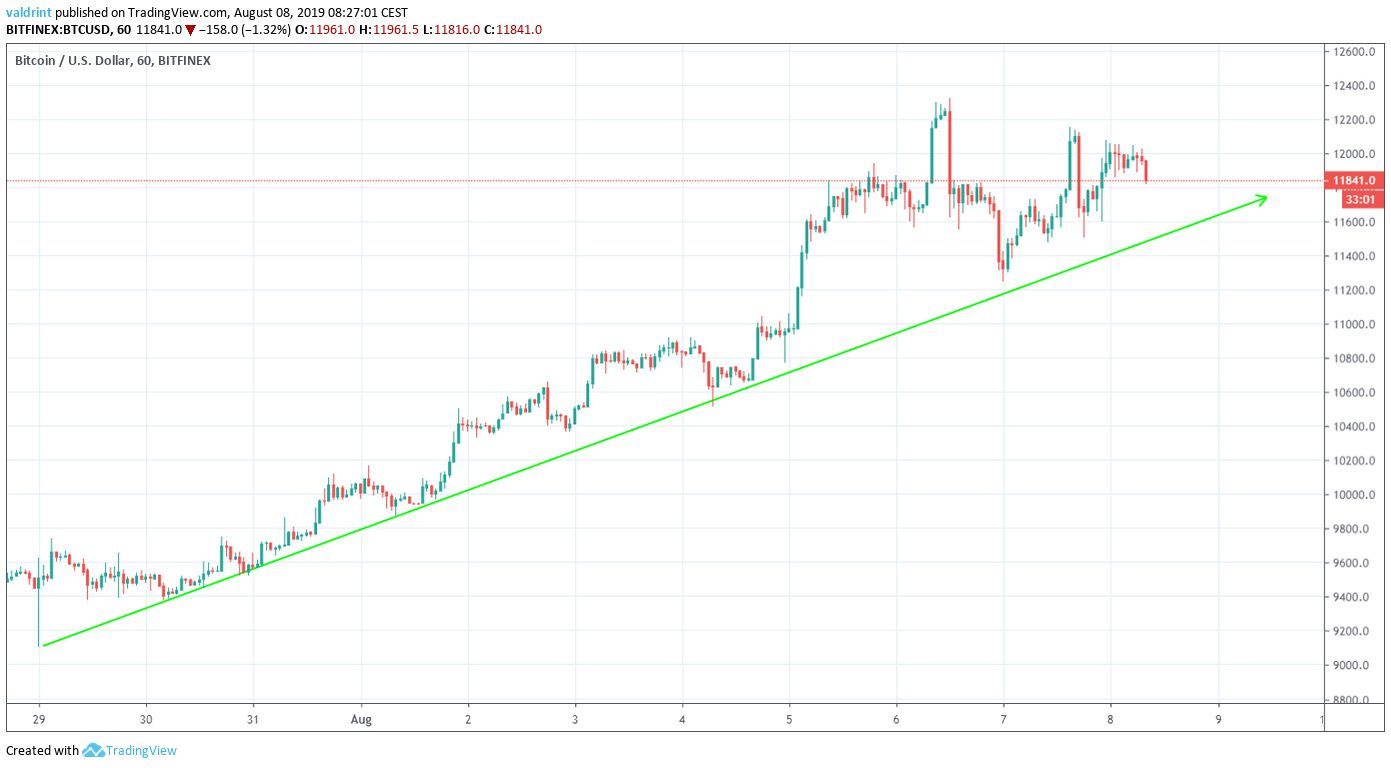
The support line has been touched numerous times, increasing its significance.
Additionally, we can see that the price has been trading above the 100-hour moving average since the ascending support line was created.
At the time of writing, the Bitcoin price was trading slightly above both.
A breakdown below them could trigger a rapid price decrease.
How likely is that to happen?
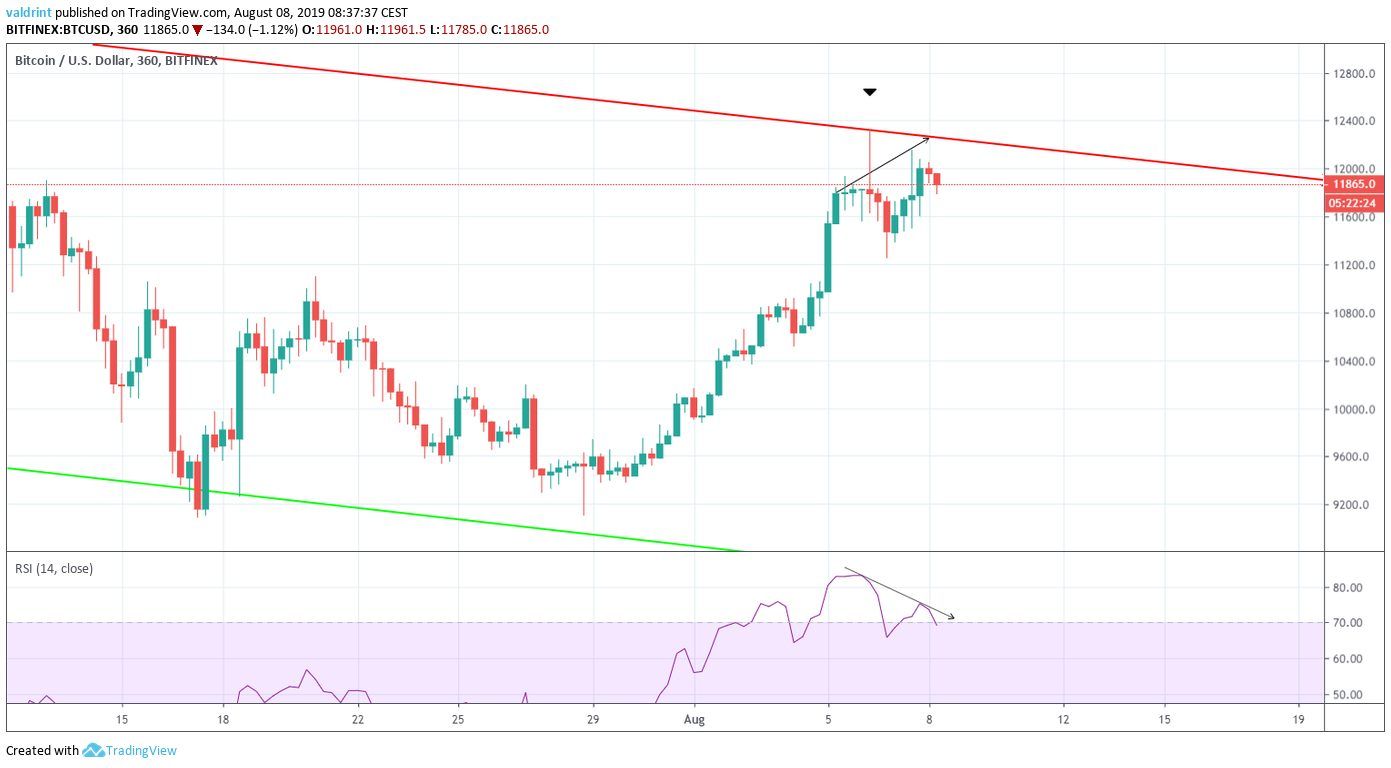
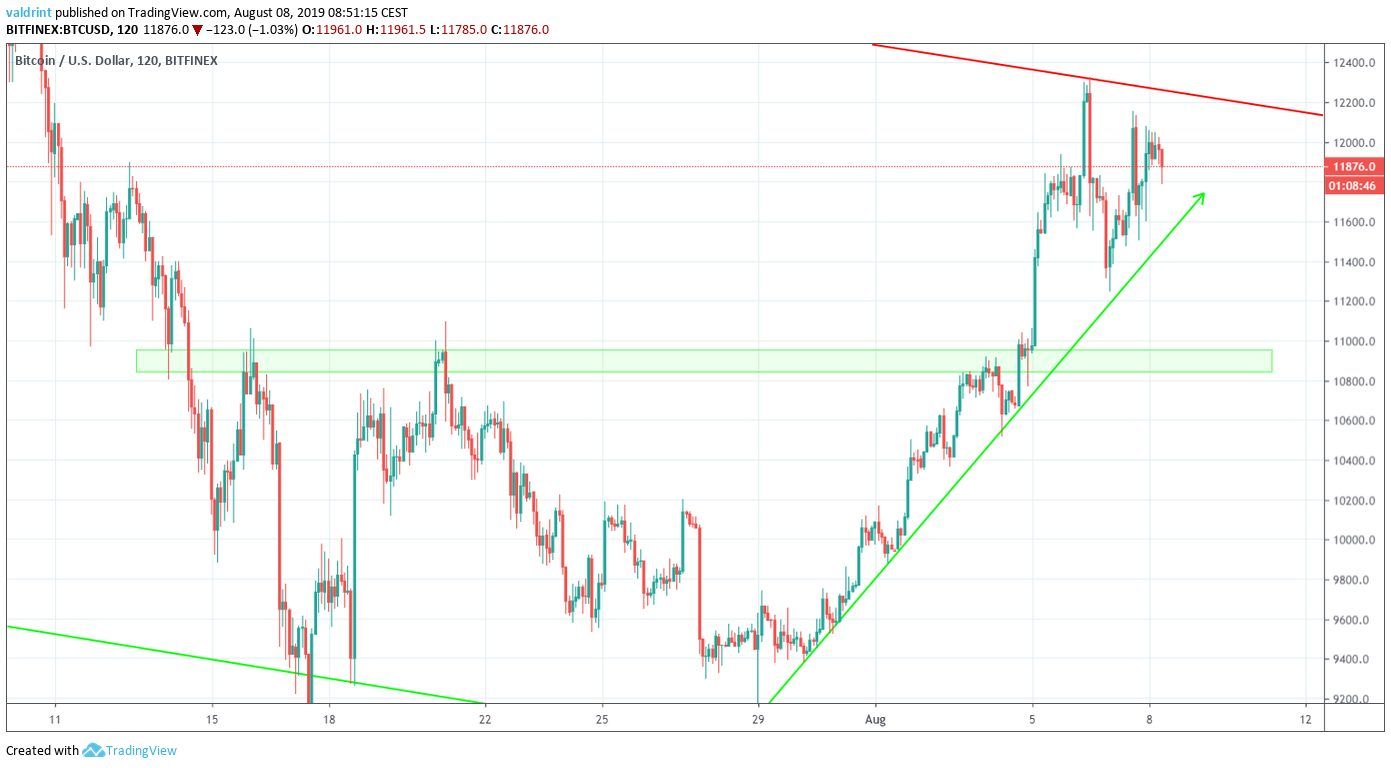
Long-Term
A look at the six-hour time-frame shows that BTC has been trading inside a descending channel since June 26.
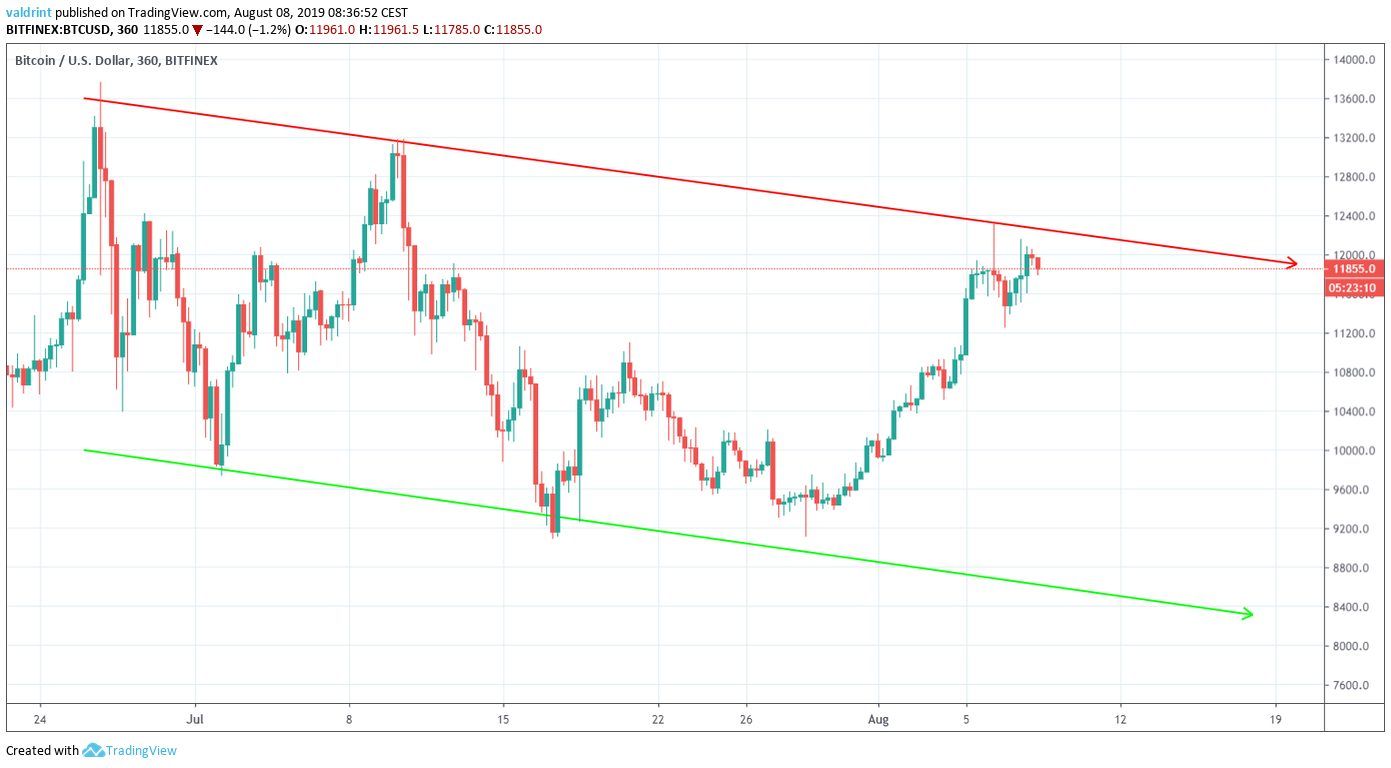
At the time of writing, it was trading very close to the resistance line, having previously touched it three times.
A look at the RSI suggests that this one will not be successful either.
It has been generating bearish divergence since August 5.
The fact that the divergence is transpiring right on the resistance line increases its validity.
Additionally, when the Bitcoin price made a high of $12,300 on August 5, it immediately decreased, creating a long upper wick.
This is a sign of selling pressure.
According to this indicator, the BTC price is likely to decrease in the future.
Let’s take a short-term look to better identify when that will happen.
Trade cryptocurrencies on the world’s top cryptocurrency exchange, Binance!
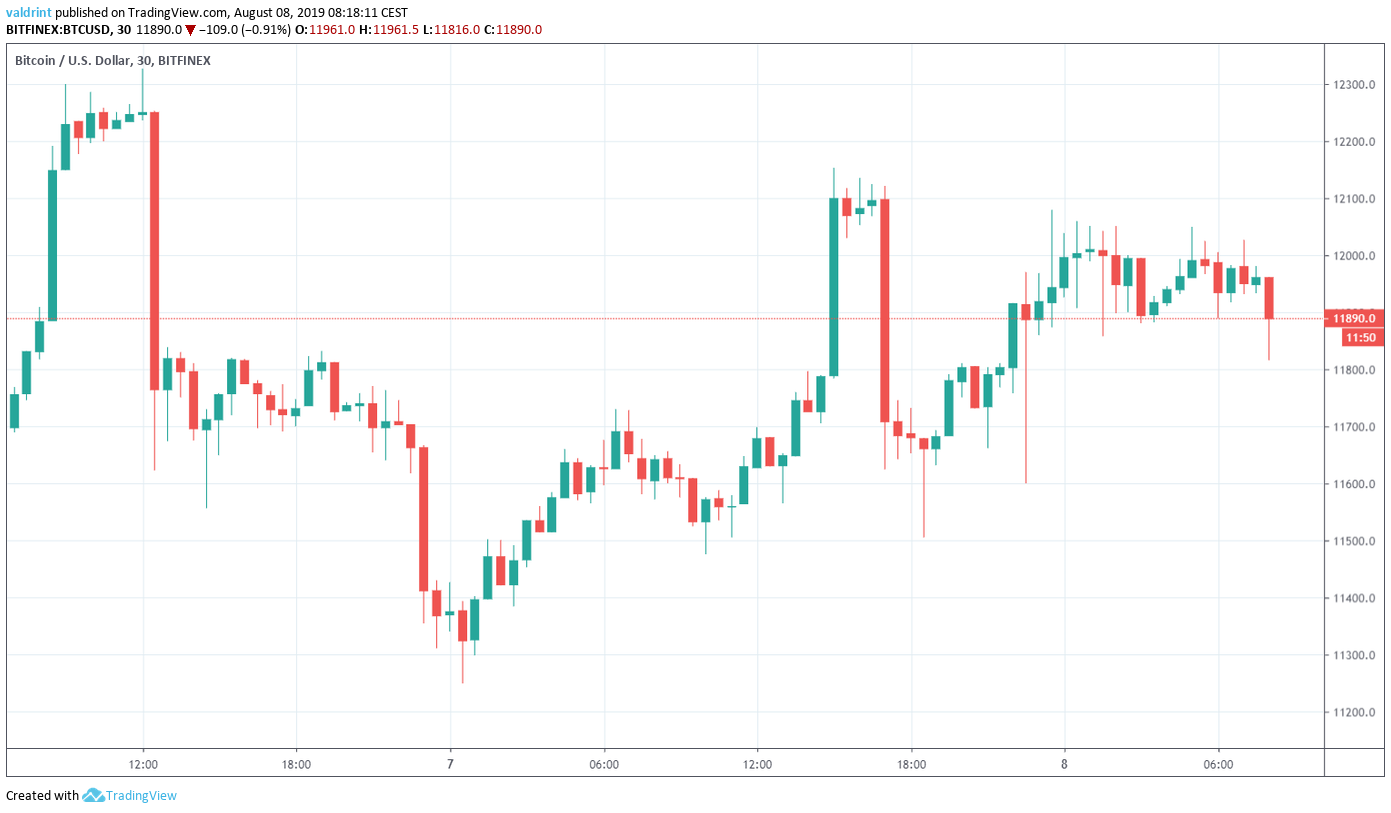
Short-Term
A look at the 30-minute time-frame shows the relatively short-term symmetrical triangle that the price has been trading in since reaching a $12,325 high on August 6.
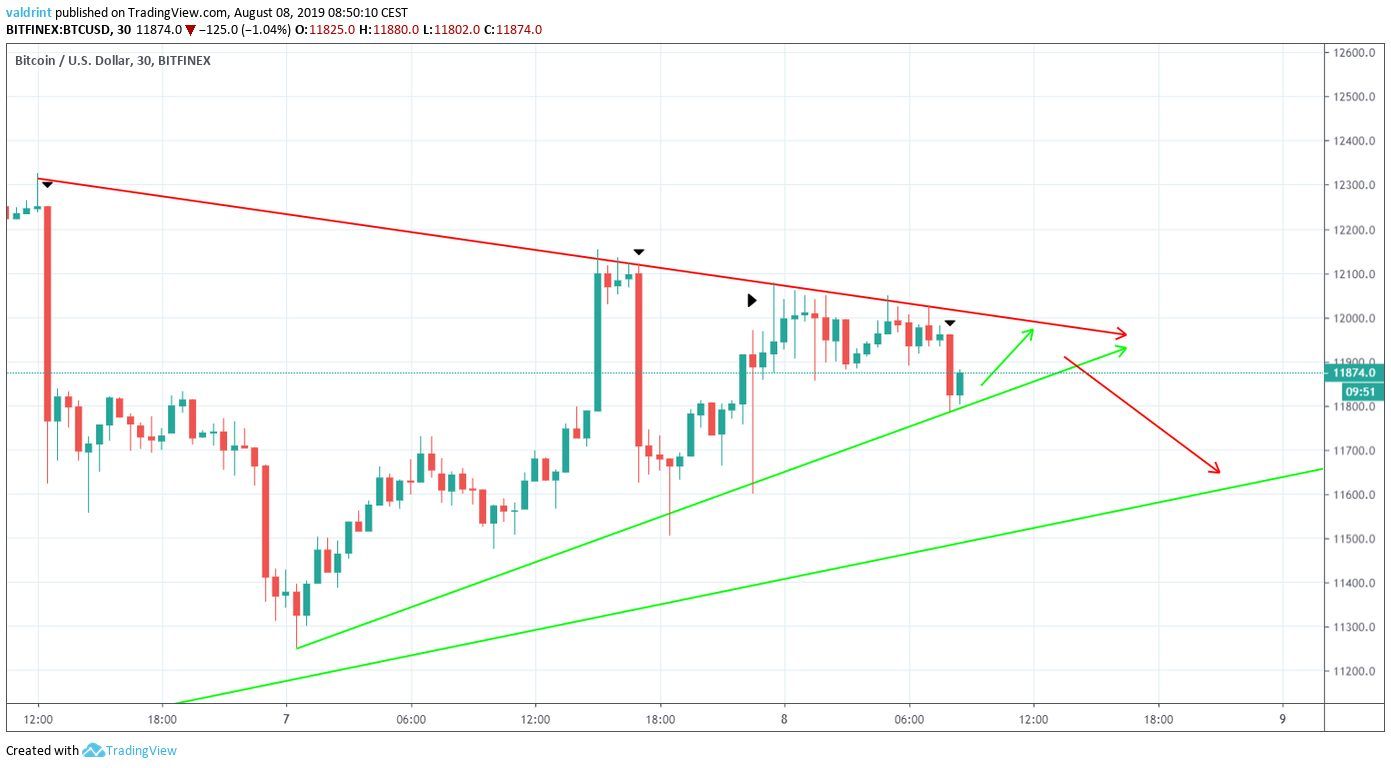
There are a few interesting developments inside this triangle.
Firstly, bearish candles have been bigger than bullish ones.
A gradual increase taking almost a day has been wiped off in less than an hour on multiple occasions.
There have been consistent long upper wicks on a candlestick that have reached values above $12,000.
This makes us believe that BTC will break down from the triangle and reach the support line.
If it continues to decrease afterward, one support area is outlined below.
It is found at $10,900.
Bitcoin Price Summary
The BTC price is following an ascending support line and is trading inside a short-term symmetrical triangle.
According to our analysis, it is likely to break down from the triangle and reach the ascending support line.
A further breakdown below the line is not ruled out.
Do you think BTC will continue decreasing? Let us know in the comments below.
Disclaimer: This article is not trading advice and should not be construed as such. Always consult a trained financial professional before investing in cryptocurrencies, as the market is particularly volatile.
Images are courtesy of TradingView and Shutterstock.
Sign up at our partner exchange, StormGain, to trade cryptocurrencies with up to a 100x multiplier.


