
On June 2, the Bitcoin price was subject to a rapid decrease that caused it to drop by roughly $600 inside of an hour.
At the time of press, BTC was trading at $9,500, slightly above a minor support area.
Bitcoin Bearish Engulfing Candlestick
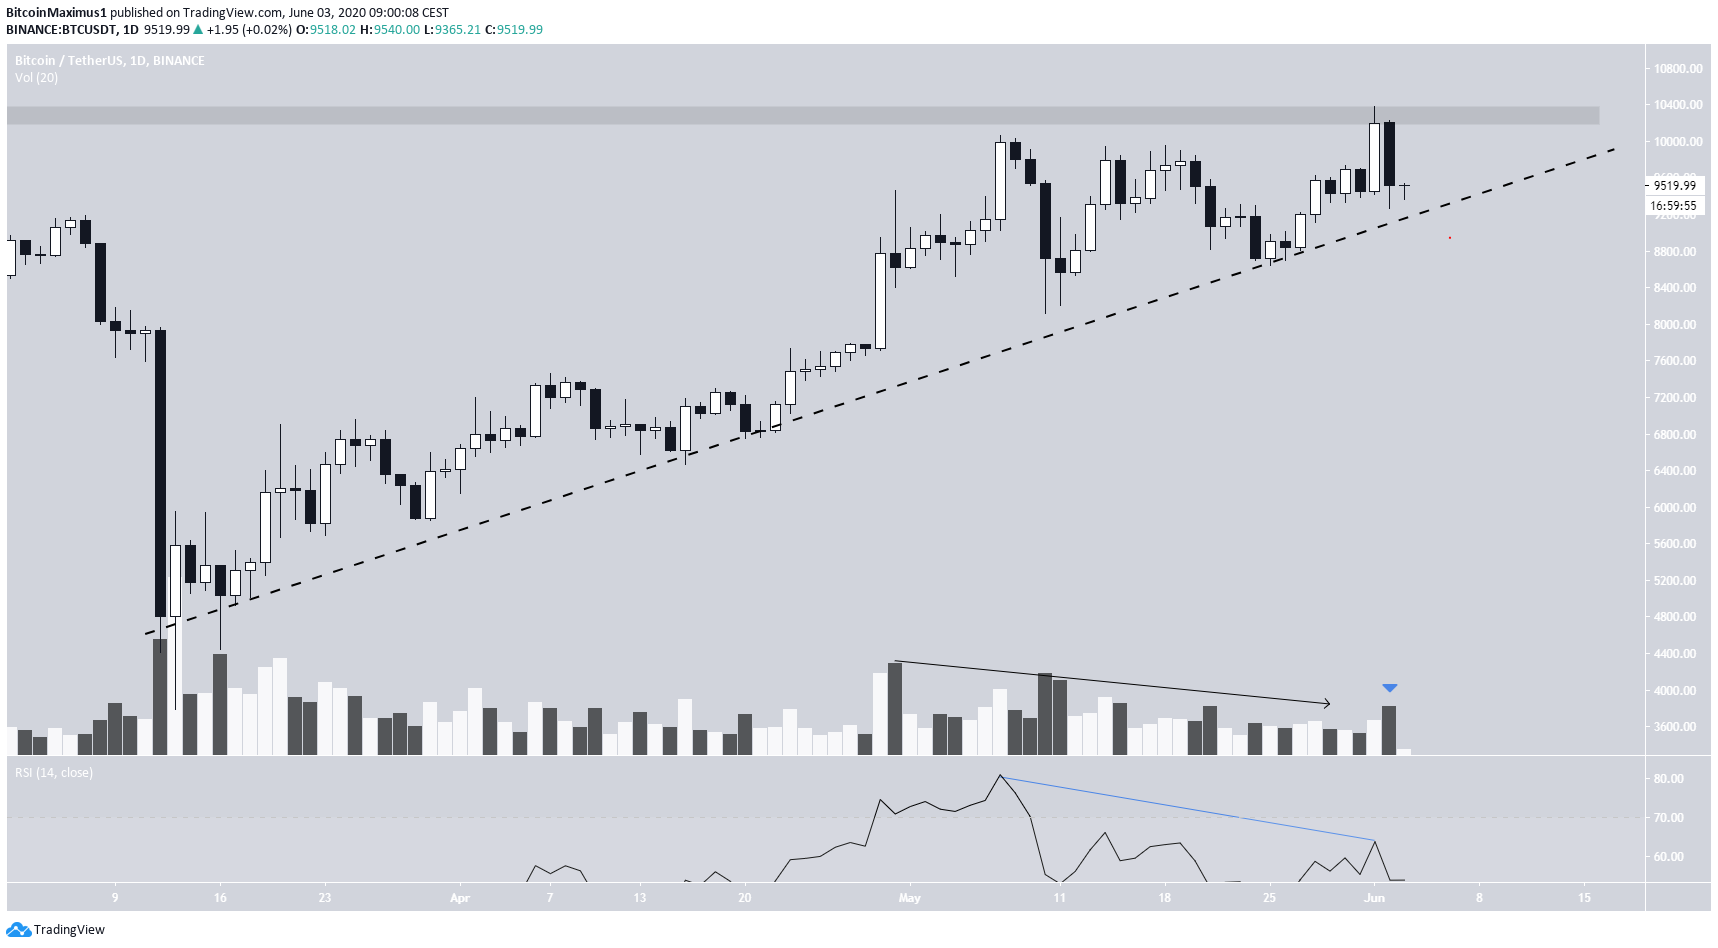
Yesterday, the Bitcoin price was strongly rejected by the $10,500 resistance area and created a bearish engulfing candlestick. This caused it to drop near the ascending support line that has been in place since the March 13 bottom. However, the price closed above the opening of the previous day’s bullish candlestick and created a lower-wick, a sign of buying pressure.
Nevertheless, technical indicators provide a bearish picture. First, the decrease was preceded by very significant bearish divergence in the daily RSI — normally a sign of reversal. In addition, volume was higher in yesterday’s bearish engulfing candlestick than it has been in previous bullish candles, a pattern that has held true since the bearish Doji on April 30.
In addition, volume has been consistently decreasing throughout this entire ascending support line. This is another bearish sign during an uptrend which indicates that the trend is reaching its exhaustion point and might soon reverse direction.
Possible Retracement
In the hourly time-frame, the BTC price has found support above the $9,400 area. While it briefly dropped below this level, it created a long lower-wick and immediately bounced back. In addition, it has just created a bullish hammer with a very long lower-wick and above-average volume. This is a sign that the price is likely to move upwards, as a retracement in response to yesterday’s decrease.
If it begins retracing, the likeliest resistance area would be found around $9,600-$9,700, between the 0.5-0.618 Fibonacci levels of the entire downward move.
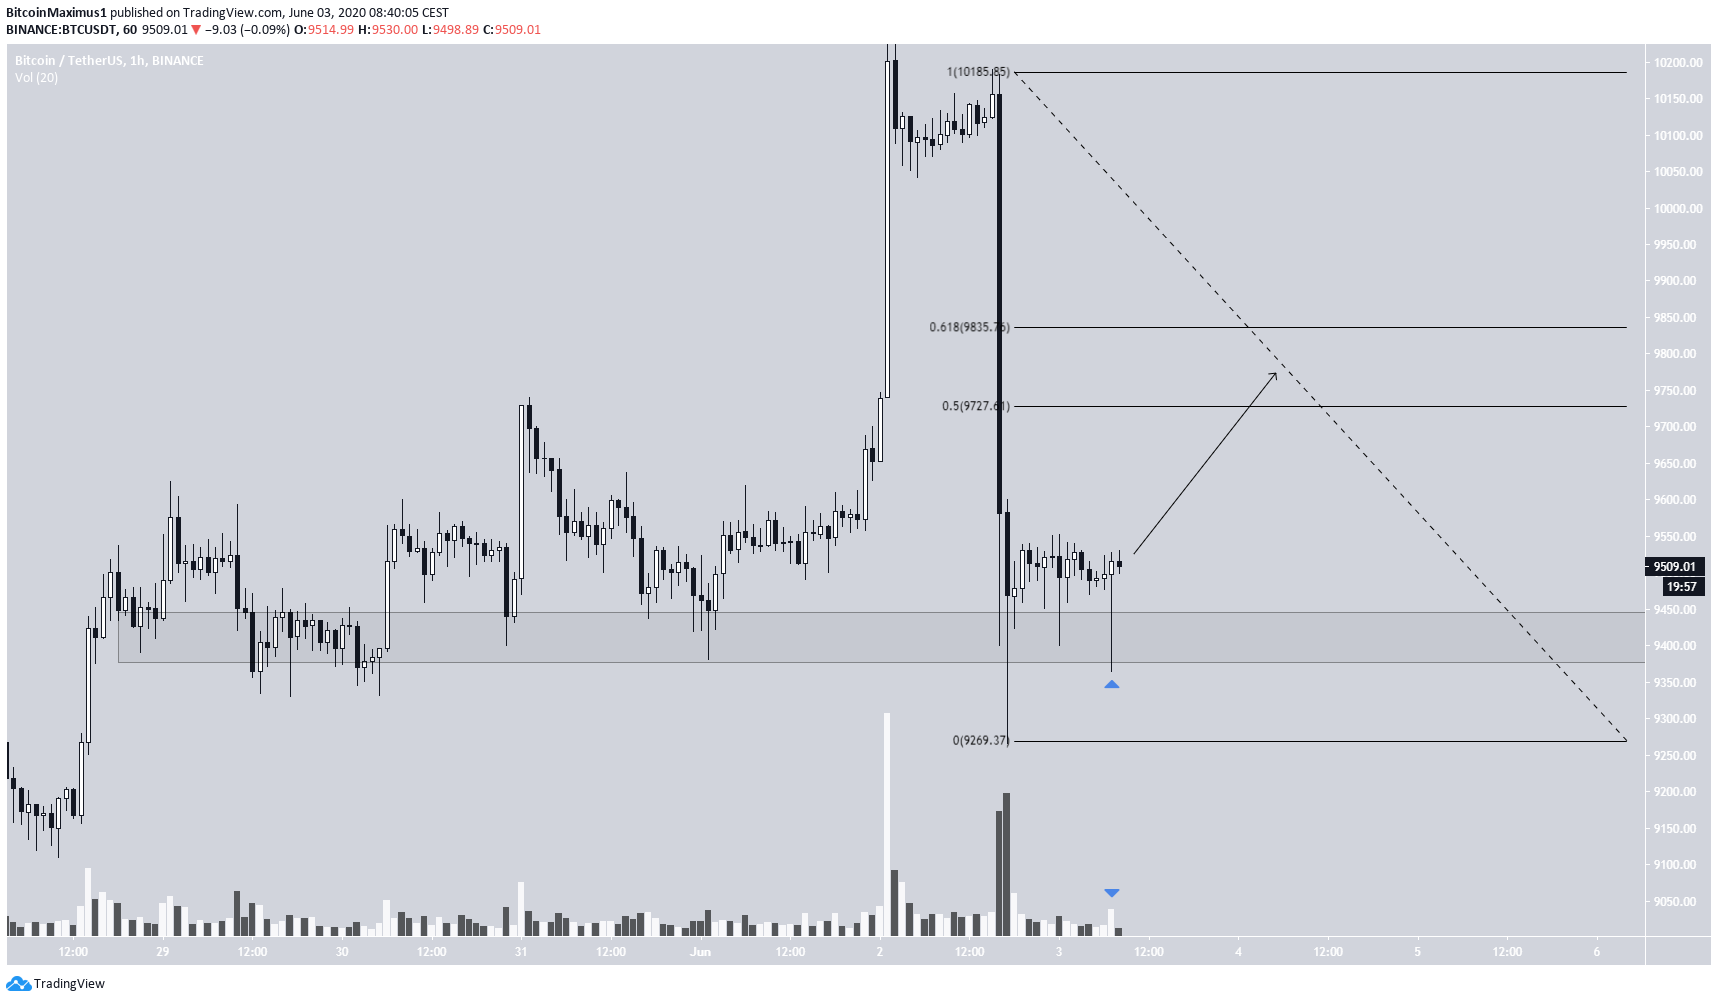
To conclude, the Bitcoin price has temporarily halted after yesterday’s downward move, and seems to be gearing up for a retracement towards $9,700-$9,800.
For our previous analysis, click here.
