


What’s going on with the price of Bitcoin, Litecoin and Bitcoin Cash lately? Are prices going up or down?
To answer these questions, we examine the current long-term and short-term trading patterns of Bitcoin (BTC), Bitcoin Cash (BCH) and Litecoin (LTC). Then, we will compare their technical indicators to generate possible trade setups.
Lastly, the major findings of our analysis are summarized in the conclusion where the winner of this analysis is selected based on future price potential.
Ascending Support
On Feb 24, the price of BTC/USD reached a high of $4284.4. A resistance line is traced from this point while a support line is traced from the low of $3939.0 experienced on Mar 25.
The price has been increasing within the confines of an ascending wedge since the support line emerged:
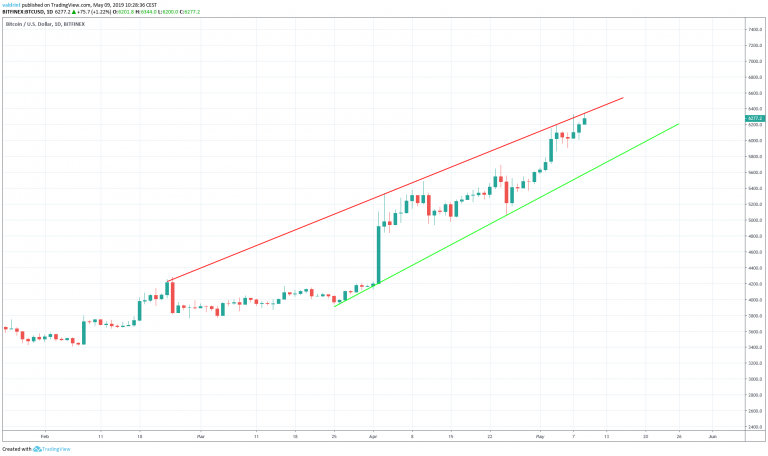
At the time of writing, the price is trading very close to the resistance line of the wedge, which has been touched five times. It reached highs of $6344 on May 9.
Similarly, the price of LTC/USD has been following an ascending support line since making lows of $43.3 on Feb 24. However, there is no clear resisstance lines or apparent trading pattern:
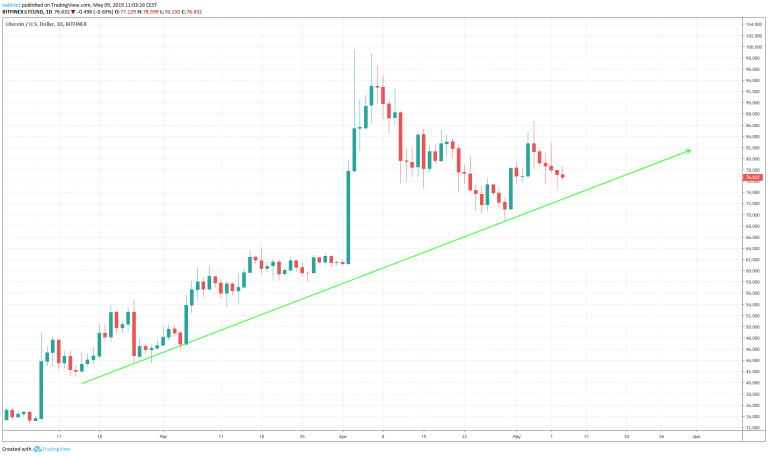
Pirce spiked in early April and fell throughout the rest the month. At the end of April, Litecoin touched the resistance line before rising. Over the last few days, the price has been dropping back towards the support line. It appears as if the line may be touched and validated in the near future.
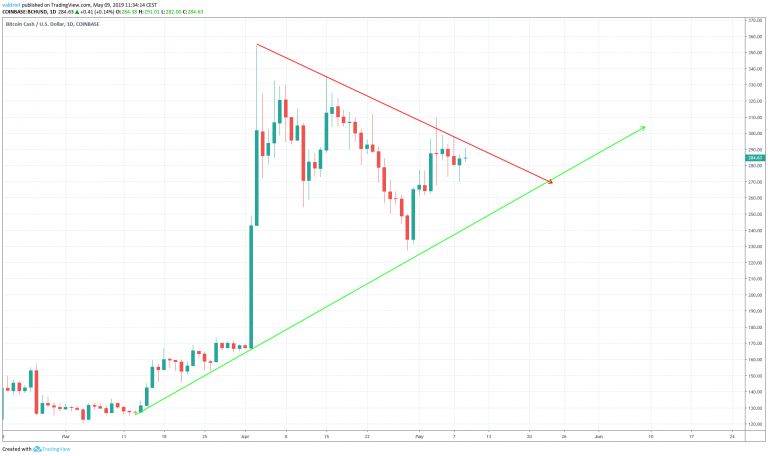
Similar to BTC and LTC, the price of BCH/USD has been following an ascending support line since Mar when a low of $125.6 was reached. Price spiked in early April and reached $354.17 on Apr 3.
Since that time, Bitcoin Cash has been trading along a descending resistance line. Together, the support and resistance lines generate a symmetrical triangle:
While all three coins appear poised to drop toward their respective support lines, these patterns alone are not sufficient to confirm this possibility.
Thus, we need to take a look at each of these within a shorter time-frame alongside relevant technical indicators.
BTC in an Ascending Wedge
On Apr 24, the price reached a high of $5690 and generated a resistance line. It dropped to a low of $5055.0 on Apr 26. A support line emerged. Since that time, has been trading inside an ascending wedge:
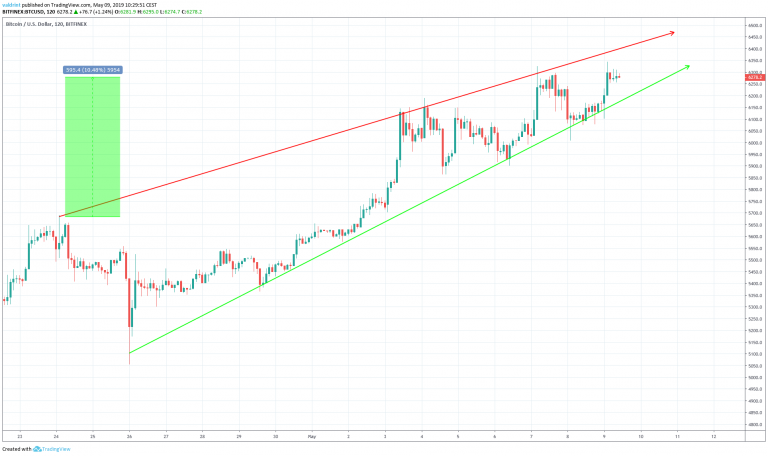
Currently, the price is trading in the middle of the wedge. We are quickly approaching the projected end of the pattern.
Since the wedge formed on Apr 24, the price of Bitcoin has increased by 10.45%. However, the descending wedge is a bearish pattern which suggests forthcoming losses and a possible breakdown.
In order to confirm whether a breakdown is likely, the price of BTC/USD is analyzed at 2-hour intervals alongside the RSI and the MACD below:
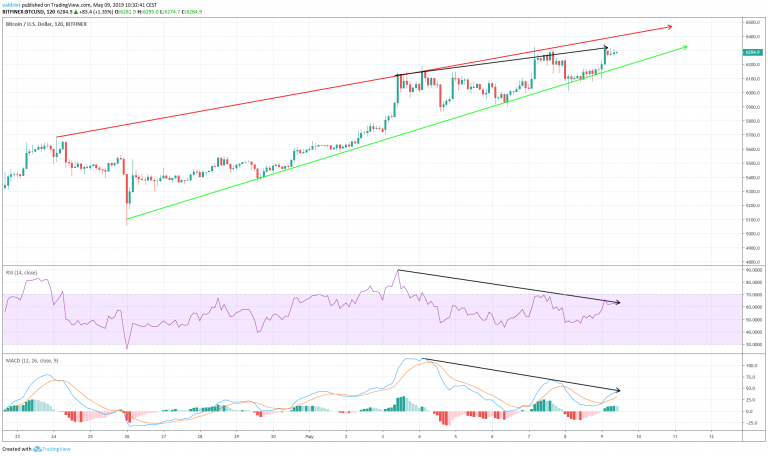
On May 3, the price reached a high of $6145 and rose to reach a higher high of $6344 on May 9.
Similarly, the RSI and the MACD made a high on May 3. However, they have continued to generate lower values since.
This is known as bearish divergence and often precedes price decreases. The use of these indicators confirms the possibility of price losses leading to a breakdown.
Short Trade Setup for Bitcoin
Since the price has developed bearish divergence inside a bearish pattern we will examine a possible short trade setup with an average entry of $6300.
The stop-loss order is placed at $6451, above the resistance line and the highs reached on May 7 and 9. This is a stop loss of roughly 2.4%.
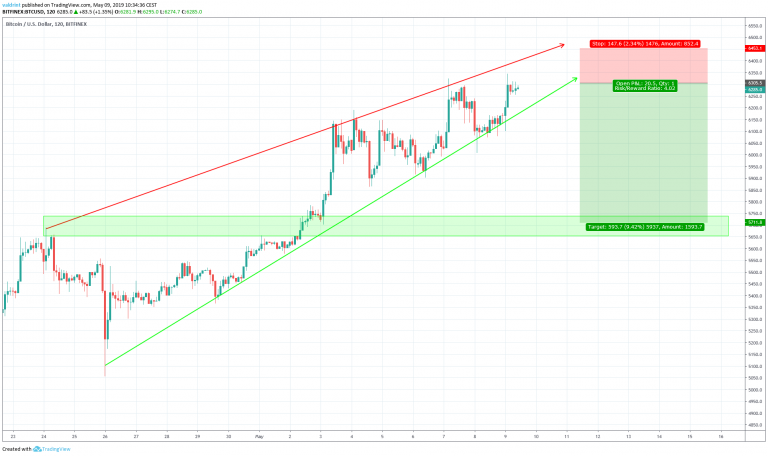
Our target would be $5700. This is found by the support area outlined above, created by the highs of Apr 24, when the resistance line of the wedge began.
Combined with the stop loss mentioned above, this is a risk to reward ratio of 4:1.
A breakdown is needed to reach the target Based on our analysis of technical indicators, this is likely.
Now, let’s take a look at LTC/USD:
Litecoin in a Horizontal Channel
The price of Litecoin reached lows of around $75.6 on Apr 30. A gradual increase ensued and the price reached highs of $86.6 on May 4. It has been decreasing since, touching the support line on May 6 and 9.
Since the resistance line emerged, Litecoin has been trading inside the horizontal channel outlined below.
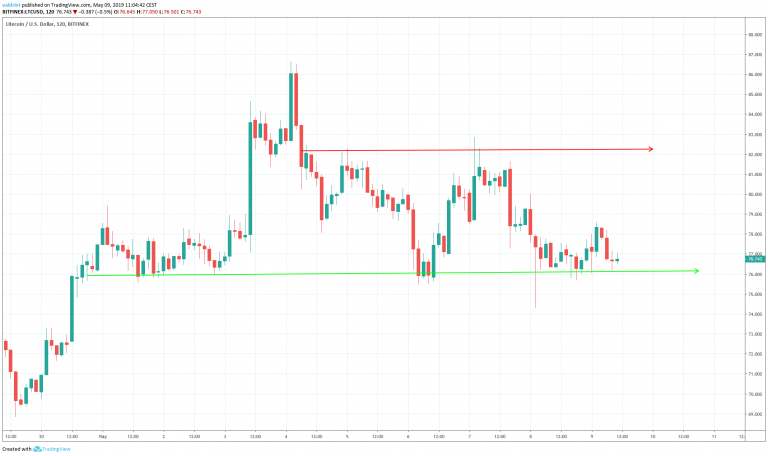
The resistance and support lines of the channel are traced at $82.2 and $76.1 respectively. The price is currently trading very close to the support line of the channel.
While it appears that price may bounce back to the resistance line, a breakdown is also possible. To assess which is more likely, the price of Litecoin is analyzed at two-hour intervals alongside the RSI and the MACD in the graph below:
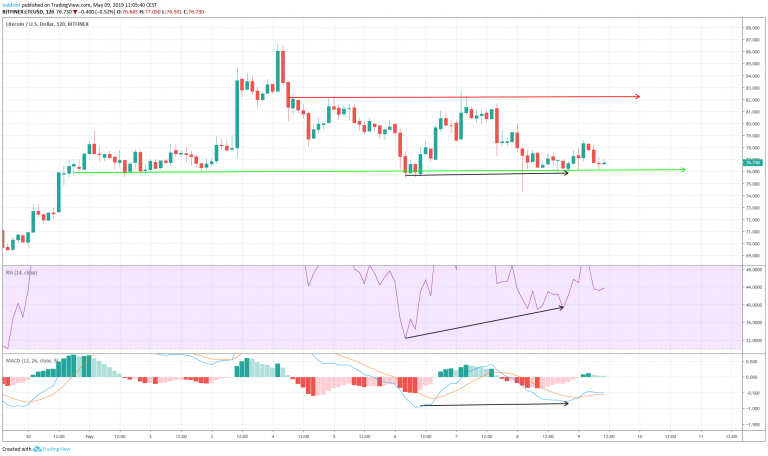
On May 6, the price reached a low of $75.4. It reached a similar low on May 9.
Similarly, the RSI and the MACD reached lows on May 6. However, they have proceeded to generate higher values since.
This is known as bullish divergence and often precedes price increases.
The use of these indicators makes it likely that the price will increase towards the resistance line of the channel.
Long Trade Setup for Litecoin
Since the price has developed bullish divergence and is trading very close to the support line of the channel, we will examine a possible long trade setup with an average entry of $76.4.
The stop-loss order will be placed at $73.9, below the wick low of May 8. This is a stop loss of roughly 3%.
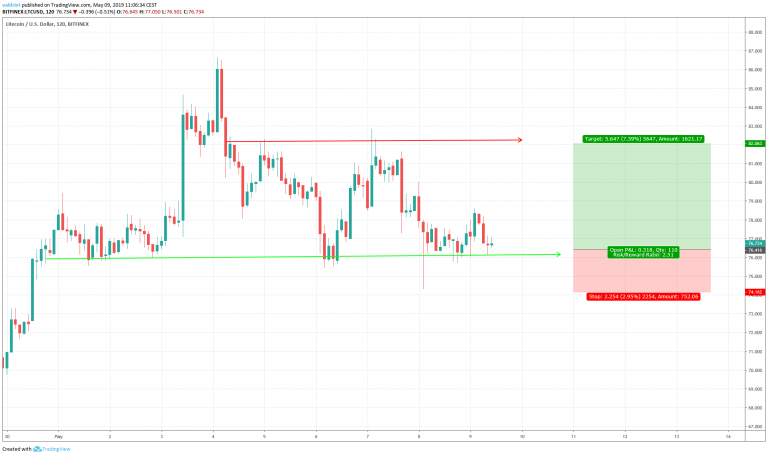
Our target will be set at $82, close to the resistance line of the channel. Combined with the stop loss outlined above, this is a risk to reward ratio of 2.5:1.
According to the indicators, a movement towards the resistance line of the channel is likely.
Finally, let’s take a look at BCH/USD:
A Descending Channel For Bitcoin Cash
On Apr 3, the price reached a high of $354.17. The ensuing decrease took it to a low of $272 the next day. The price has been decreasing since, trading inside the descending channel outlined below:
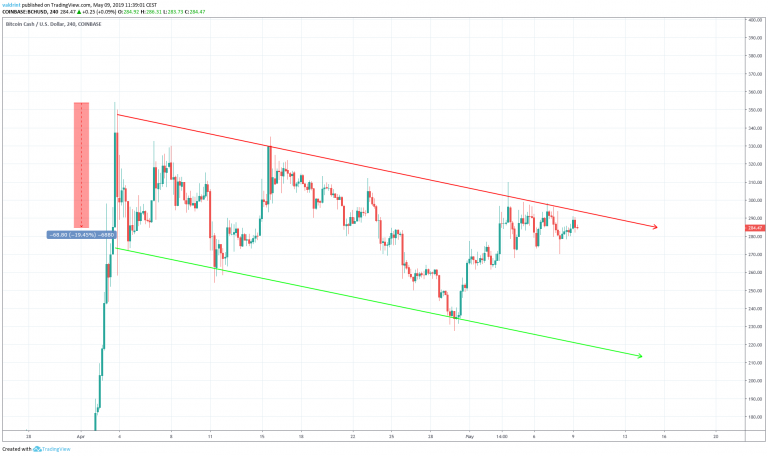
Currently, the price is trading very close to the resistance line of the channel.
Since the channel formed on Apr 3, the price of Bitcoin Cash has decreased by roughly 20%.
The price is trading very close to the resistance line. Therefore, we need to confirm whether a breakout or a decrease towards the support line is more likely.
In order to do that, we have outlined the price of BCH/USD at 2-hour intervals alongside the RSI and the MACD below:
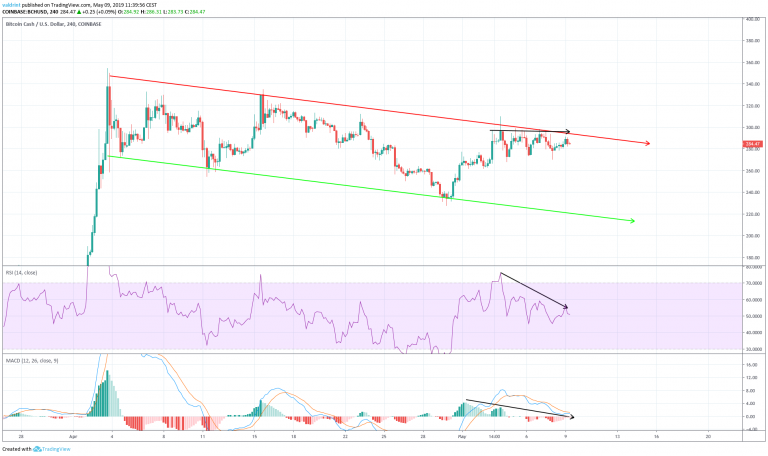
On May 3, the price reached a high of $296.92. It reached similar or higher highs until May 7.
Similarly, the RSI and the MACD made a high on May 3. However, they have continued to generate lower values since.
This is known as bearish divergence and often precedes price decreases.
The use of these indicators makes it likely that the price will decrease towards the support line of the wedge.
Short Trade Setup
Since the price has developed bearish divergence very close to the resistance line of a pattern, we will examine a possible short trade setup with an average entry of $287.
The stop-loss order is placed at $310.1, slightly above the wick high of May 3 and well above the resistance line of the channel. This is a stop loss of roughly 8%.
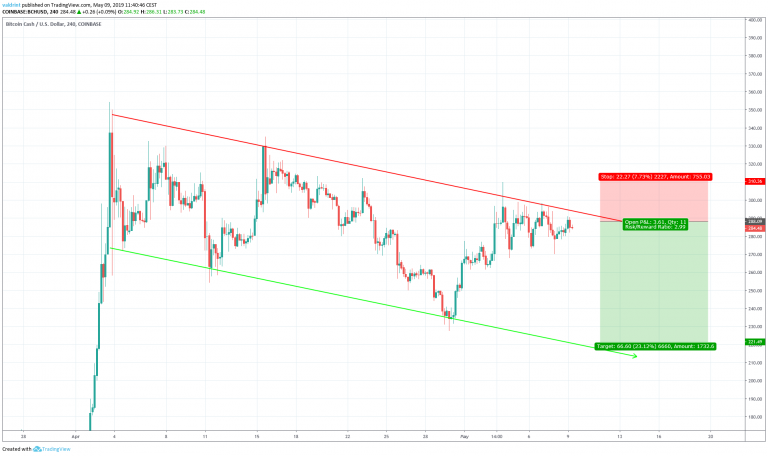
Our target would be at $220, close to the support line of the channel.
Combined with the stop loss mentioned above, this is a risk to reward ratio of 3:1.
A breakdown is not needed to reach the target. Rather, only a decrease within the channel is required. Based on our analysis of technical indicators, this is likely.
Conclusion
To conclude, all three of Bitcoin, Litecoin, and Bitcoin Cash are following ascending support lines. However, Bitcoin is trading inside a bearish pattern, while the other two are following neutral patterns.
Furthermore, both Bitcoin and Bitcoin Cash have developed bearish divergence in bearish and neutral patterns respectively while Litecoin has developed bullish divergence.
Additionally, all three of the coins have visible trade setups. Shorts are in place for BTC/USD and BCH/USD and a long trade is in place for LTC/USD. The risk-reward ratio is the highest for BTC.
To conclude, we believe that Litecoin faces the best prospects for the near future, followed by Bitcoin Cash and Bitcoin. However, Bitcoin has the most profitable trade setup in place, with a risk to reward ratio of 4:1.
A summary is presented in the table below:
BTC
LTC
BCH
WINNER
Long-term Pattern
Ascending Wedge
Ascending support line, no visible resistance
LTC/BCH
Short-Term Patterns & Indicators
Bearish divergence developing in an ascending wedge.
Bullish divergence developing inside a horizontal channel
LTC
Do you think the price of Litecoin will be able to reach the resistance line? Will BTC break down from the wedge? Where will the price of BCH go? Let us know in the comments below.
Disclaimer: This article is not trading advice and should not be construed as such. Always consult a trained financial professional before investing in cryptocurrencies, as the market is particularly volatile.


