The Bitcoin (BTC) price and the S&P500 (SPX) are highly correlated with each other, particularly during decisive trends.
Long-Term Movement
The S&P 500 price is currently trading at $3,058, rangebound between the closest support and resistance levels at $2,950 and $3,230, respectively. The price is also trading above the 200-day moving average (MA), seemingly using it as support. It definitively broke out above this MA on May 20, and consequently returned to validate it as support on June 15. In the process, it created a hammer candlestick, which is a fairly bullish sign. However, the price has yet to threaten the February highs, so the entire move since the March 23 bottom may just be a retracement in response to that downward move.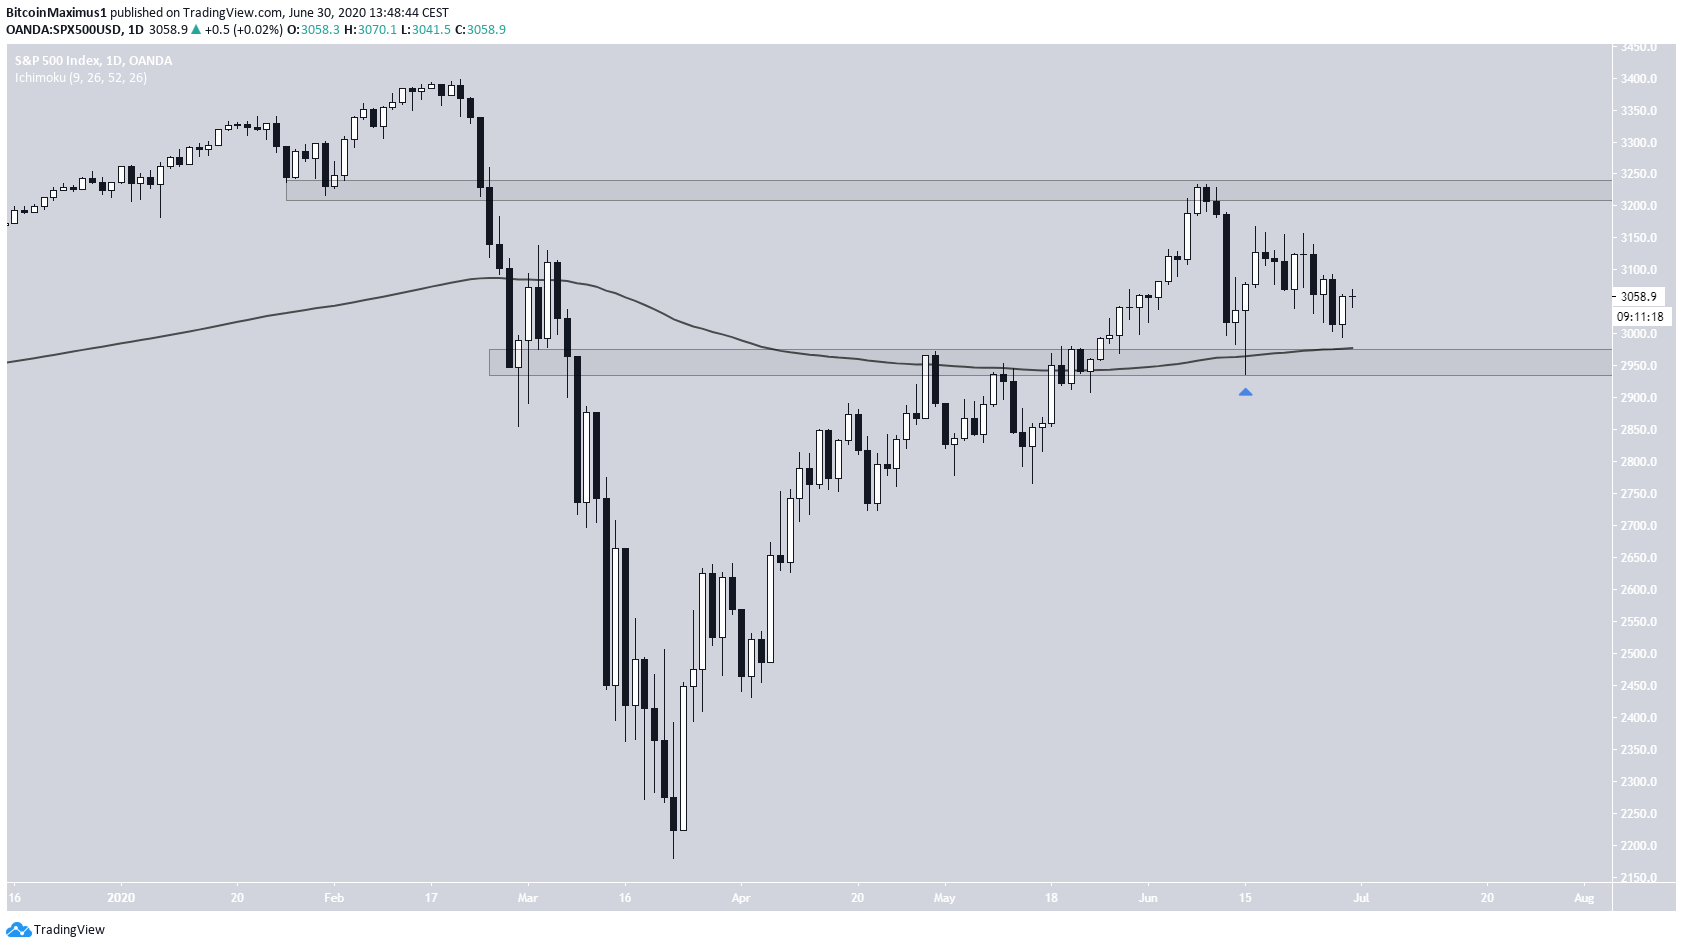
Current Breakout
The short-term chart reveals a possible descending wedge from which the price has just broken out. Before the breakout, the price reclaimed the $3,040 minor support area, which had previously been broken. Whenever the price declines below a support area only temporarily, it often has bullish implications and forewarns of a trend reversal. However, SPX is still facing resistance from its 400-hour MA, which has intermittently acted as both support and resistance throughout this pattern. Once the price flips it as support, it will likely begin to move up towards the resistance areas outlined.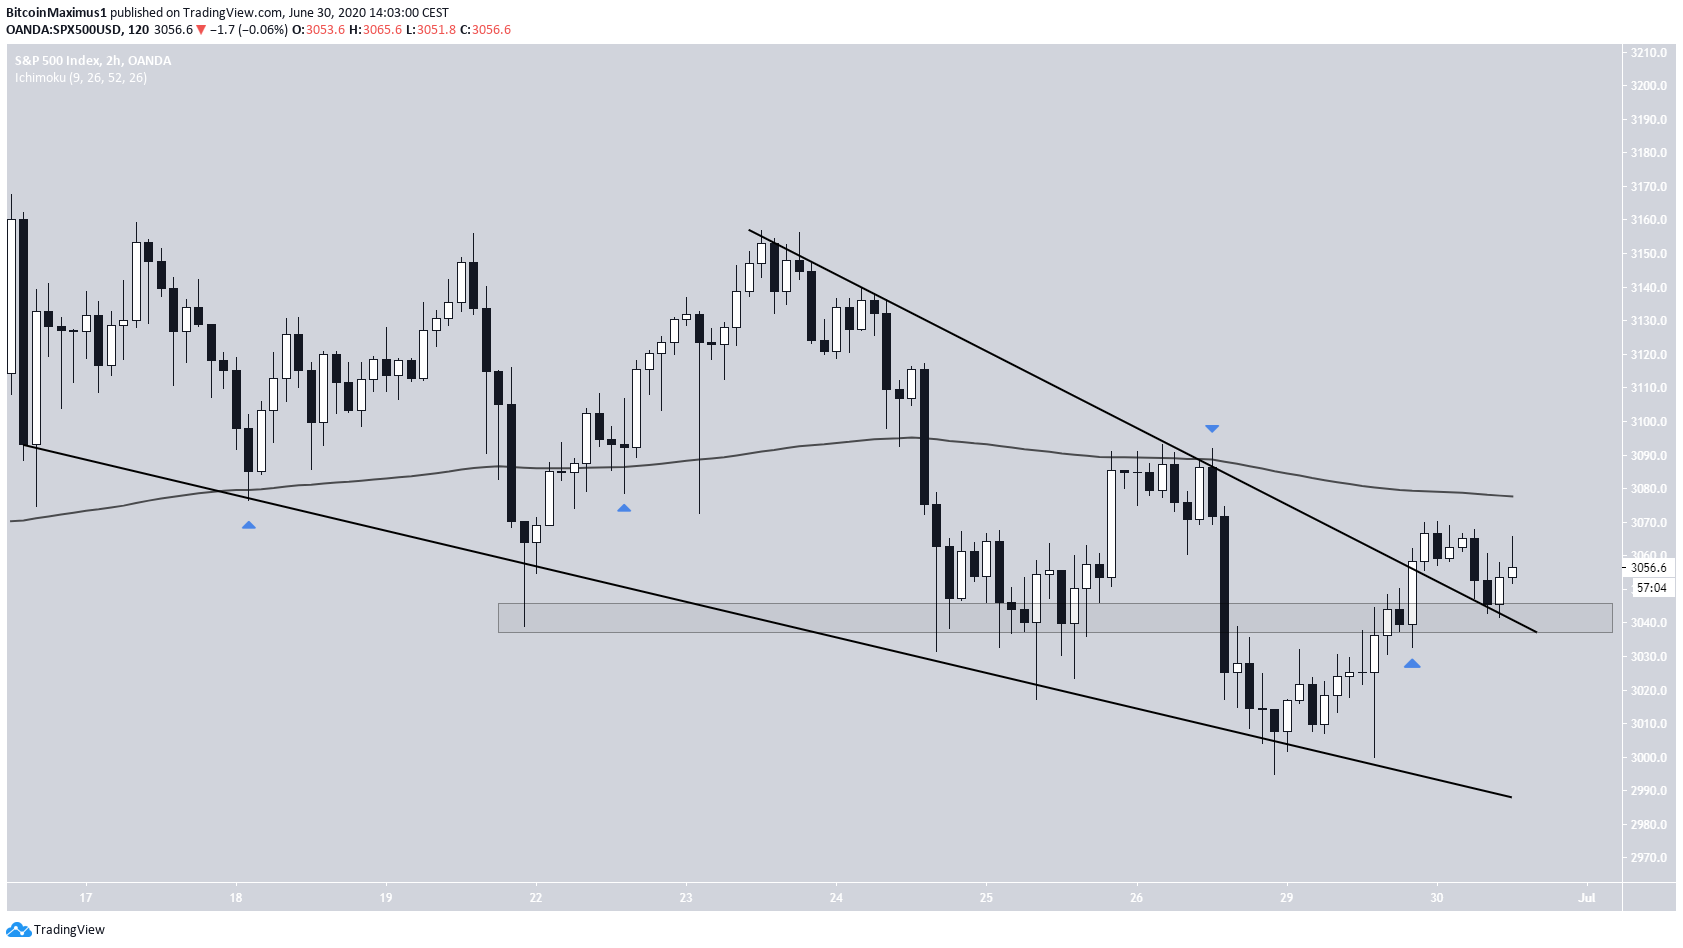
Correlation to Bitcoin
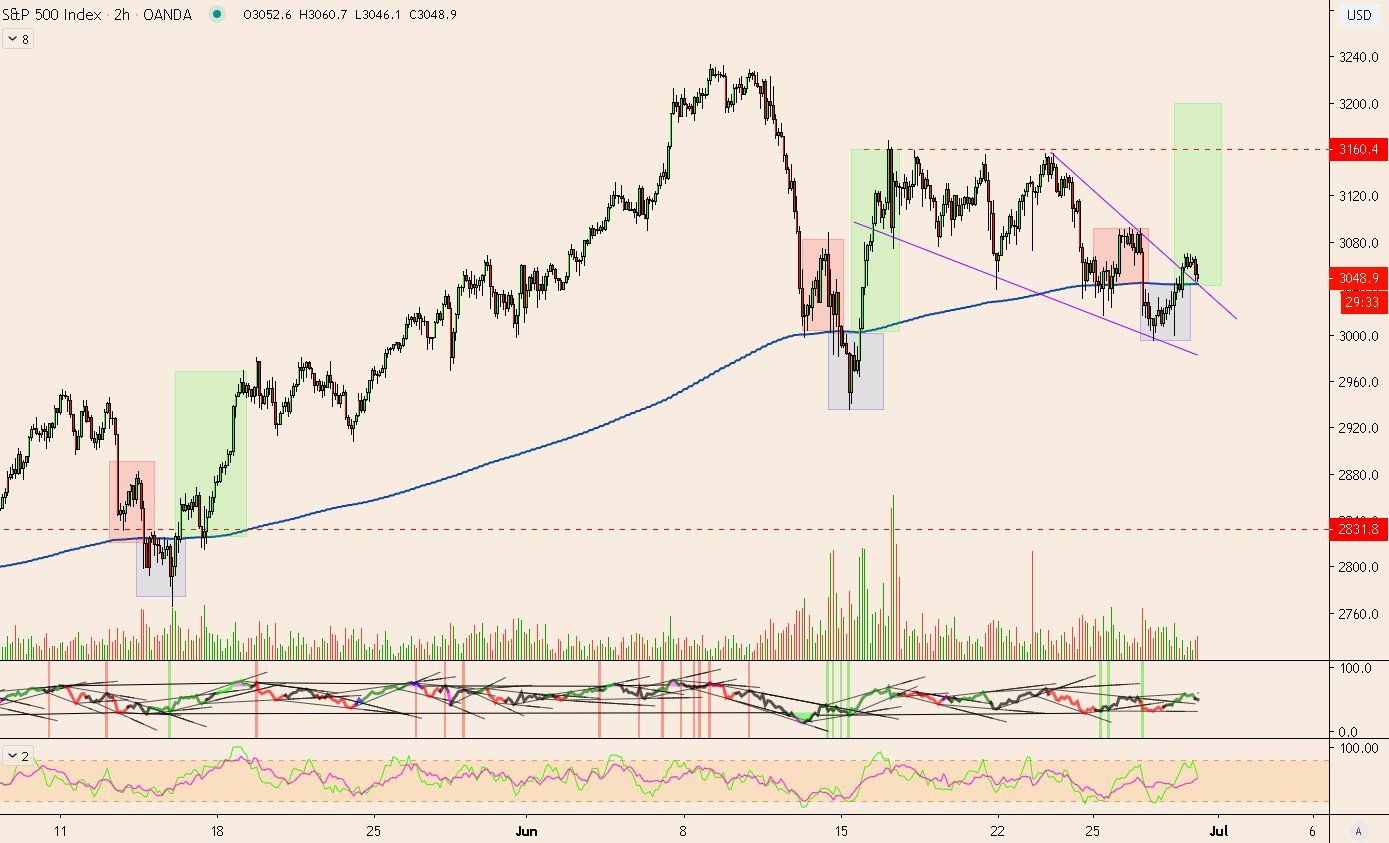
When looking at the SPX price side-by-side with BTC, we can see that there is a very high degree of correlation. Check out the histogram at the bottom of the image below. Values of ”1” indicate a perfect correlation. Since the decline on June 23, the correlation has been hovering between 0.6 and 1. It’s interesting to note that the correlation coefficient seems to be much higher during rapid movements in either direction than during periods in which the price is relatively stable. This is particularly evident during two 5-day periods beginning on June 6 and June 15, respectively, in which the correlation coefficient dropped below 0.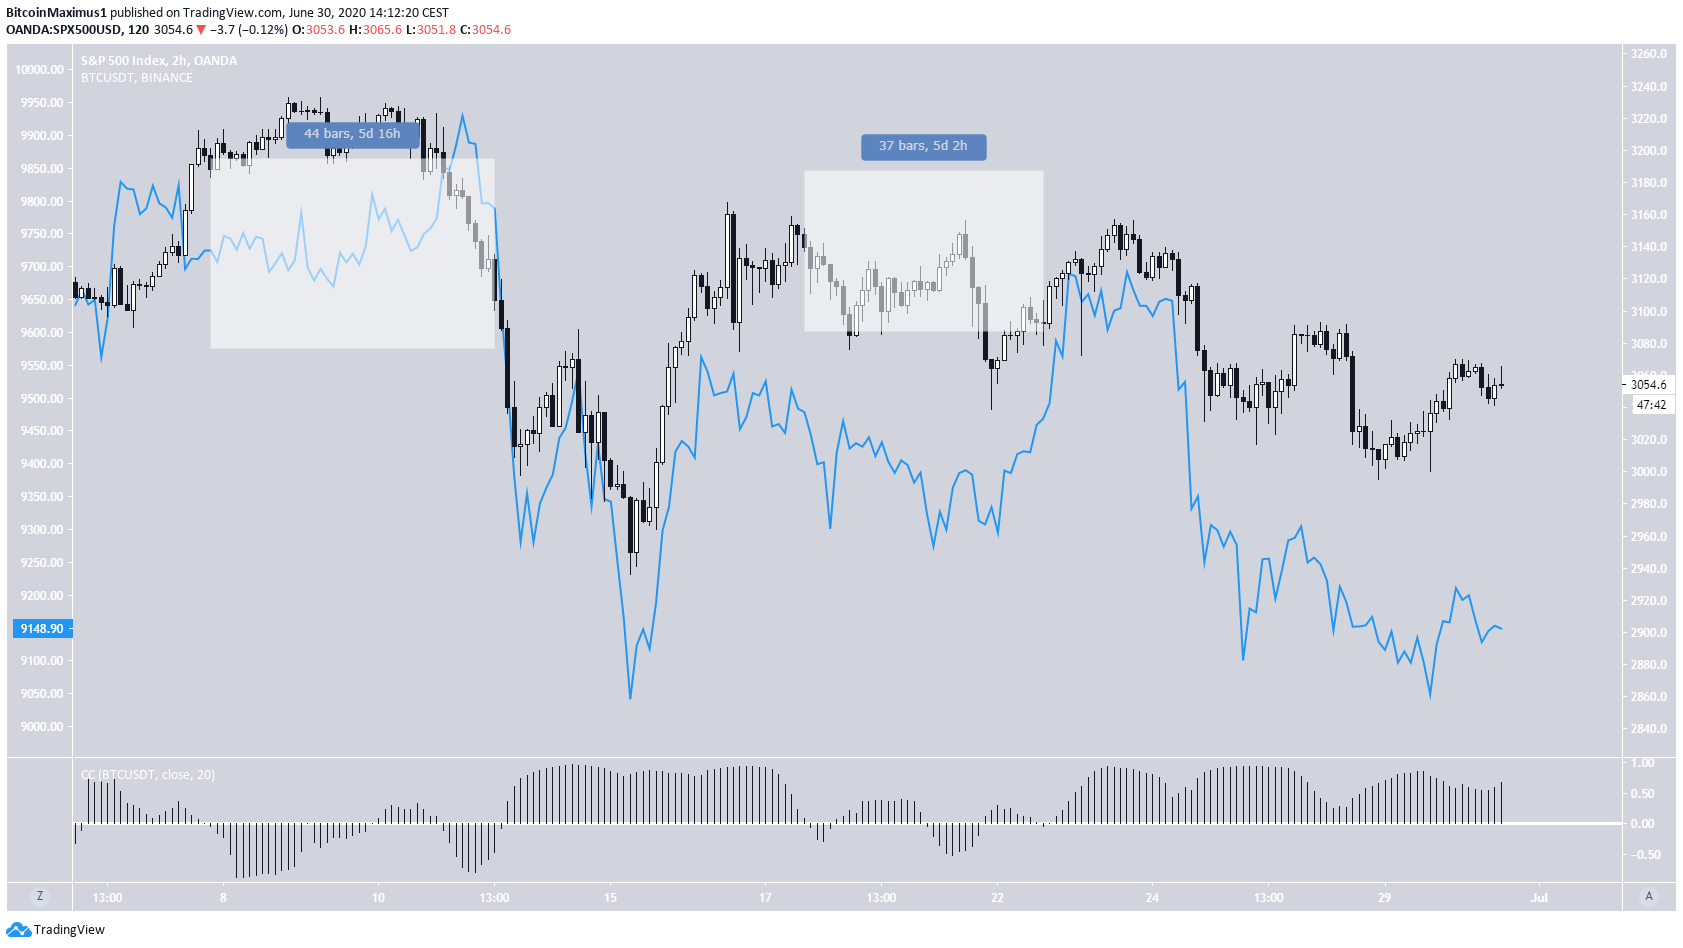
Disclaimer
In line with the Trust Project guidelines, this price analysis article is for informational purposes only and should not be considered financial or investment advice. BeInCrypto is committed to accurate, unbiased reporting, but market conditions are subject to change without notice. Always conduct your own research and consult with a professional before making any financial decisions. Please note that our Terms and Conditions, Privacy Policy, and Disclaimers have been updated.

Valdrin Tahiri
Valdrin discovered cryptocurrencies while he was getting his MSc in Financial Markets from the Barcelona School of Economics. Shortly after graduating, he began writing for several different cryptocurrency related websites as a freelancer before eventually taking on the role of BeInCrypto's Senior Analyst.
(I do not have a discord and will not contact you first there. Beware of scammers)
READ FULL BIO
Sponsored
Sponsored
