


Bitcoin (BTC) has held on above the $32,100 support area for the third straight day.
Bitcoin is expected to increase in the short-term at least until it reaches the breakdown level at $37,550.
Bitcoin Holds Support
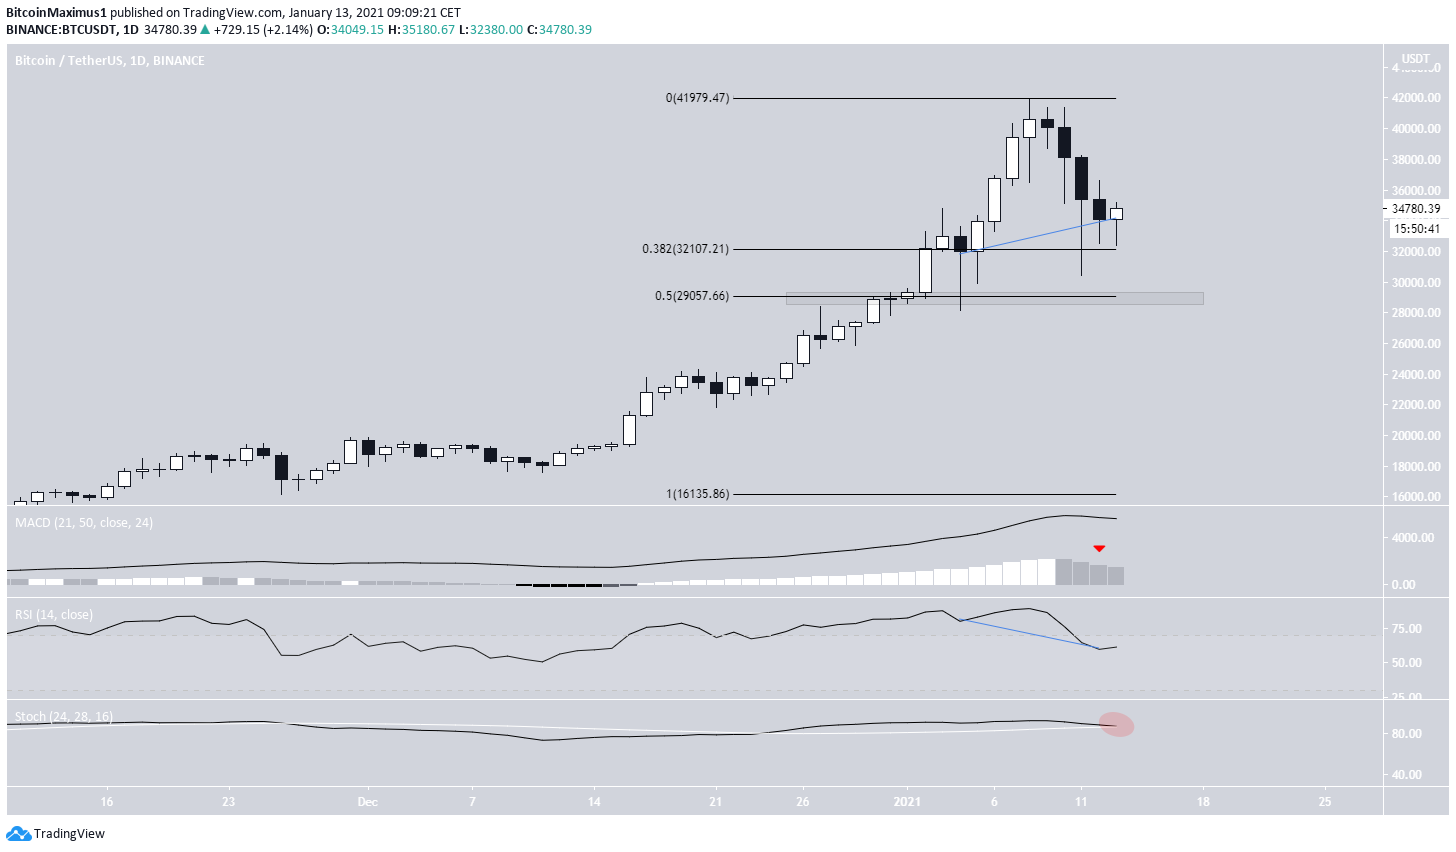
For the third straight day, BTC held above the $32,100 support area, which is the 0.382 Fib retracement of the entire upward movement. BTC created another lower wick, a sign of buying pressure. The next support area is found at $29,050, the 0.5 Fib retracement level of the same scale.
Technical indicators have clearly turned bearish. This can be seen in the form of a falling MACD and a bearish cross in the Stochastic oscillator. However, the daily RSI has generated a very significant hidden bullish divergence, a strong sign of continuation which could be the catalyst for a bounce.
Future Movement
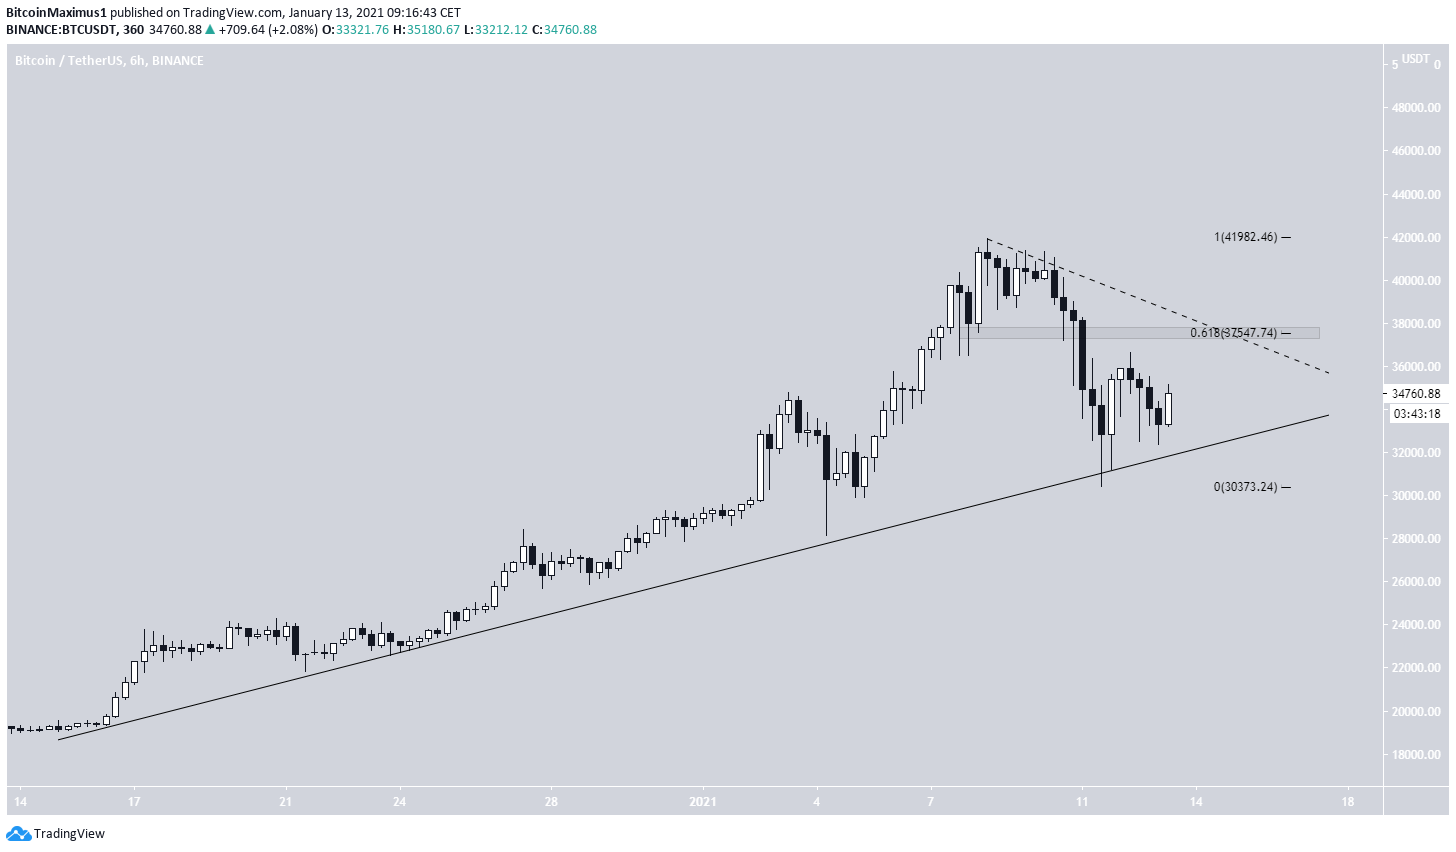
The six-hour chart shows that BTC has been following an ascending support line since Dec. 17. It has bounced four times above it up to this point — most recently during the aforementioned Jan. 11 low.
If BTC continues increasing, it’s likely to find resistance at $37,550. This target is a combination of the 0.618 Fib retracement level, a previous support level, and a potential descending resistance line (dashed).
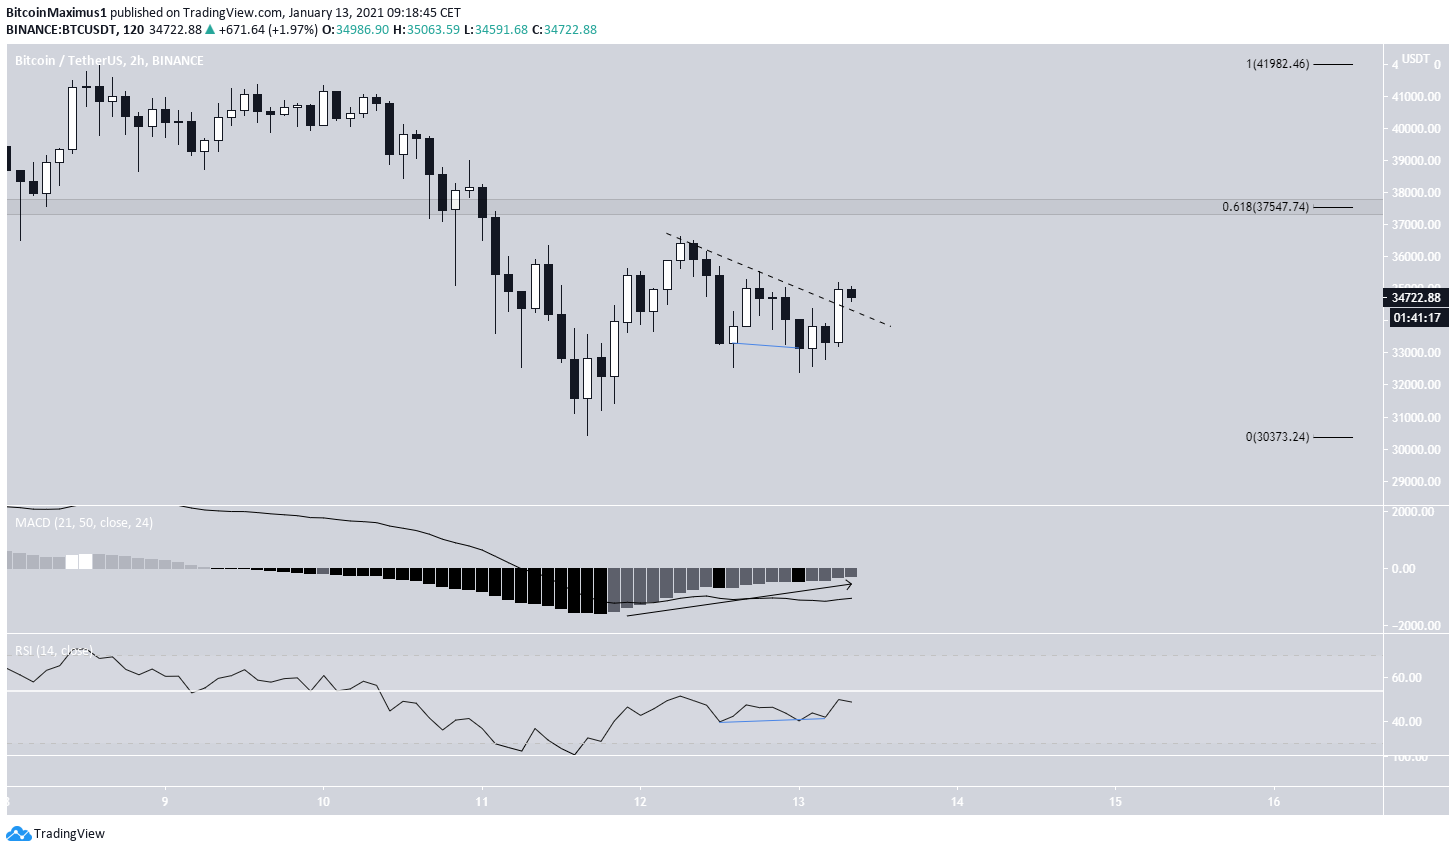
Lower time-frames support the beginning of the upward movement towards $37,550. The charts show a breakout from a short-term descending resistance line and a bullish divergence in the RSI, along with an increasing MACD.
Currently, BTC is re-testing the resistance line it broke out from and is expected to increase after.
BTC Wave Count
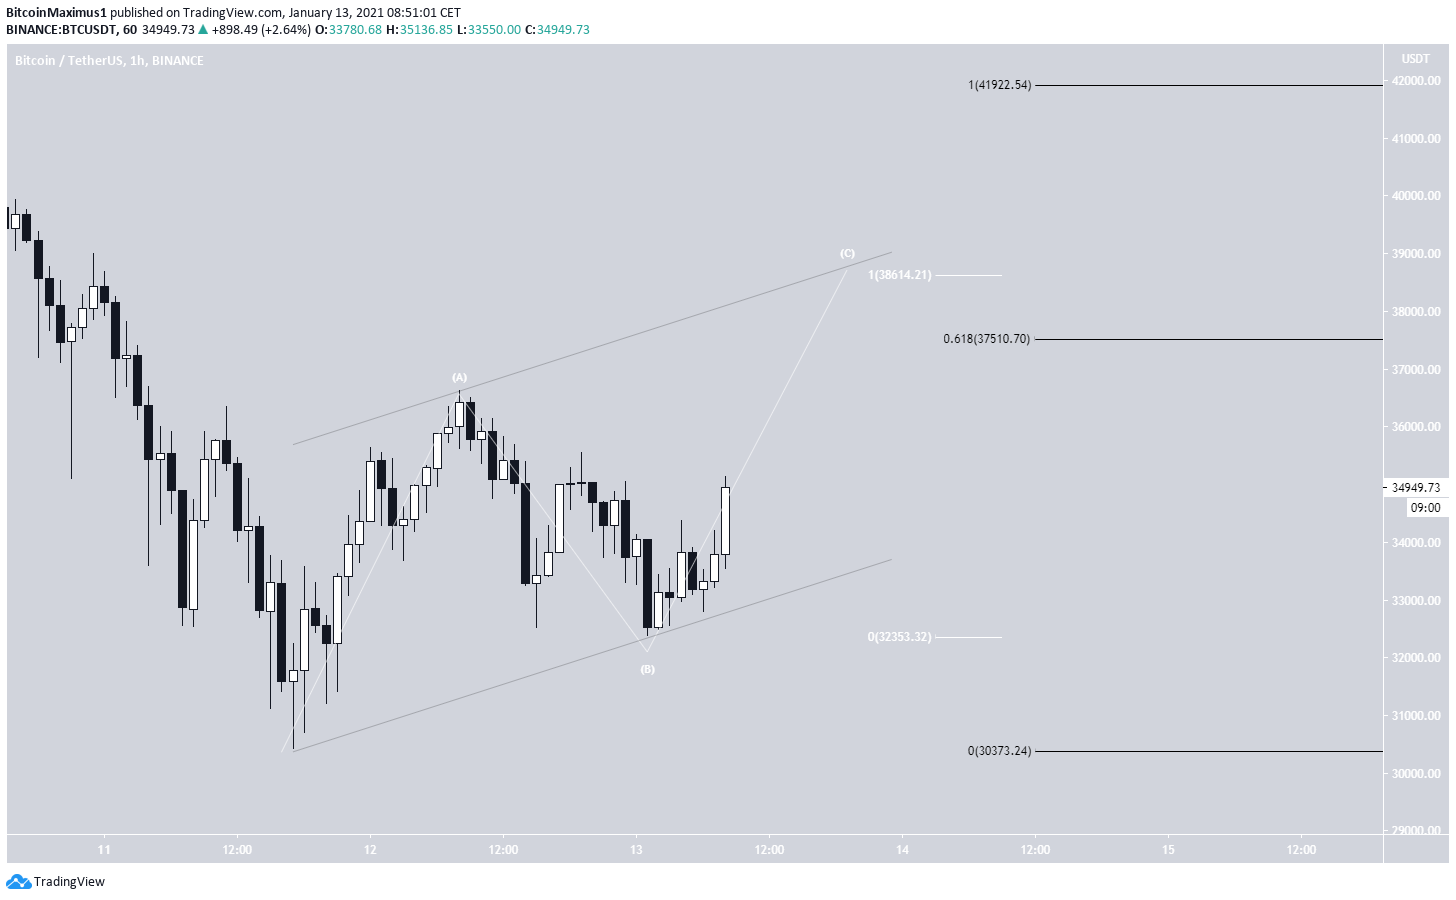
Beginning with the $30,420 low on Jan. 11, BTC seems to have completed the A and B waves of a zigzag A-B-C correction.
A likely target for the top of the C wave is found at $38,614, which would give the A:C waves a 1:1 ratio. The target is also close to the 0.618 Fib retracement level at $37,510.
It also coincides with the resistance line of a parallel channel connecting the bottom of the A and B waves.
Conclusion
Bitcoin is expected to increase toward the range of $37,500-$38,614 to reach the previous breakdown level and complete the A-B-C structure.
For BeInCrypto’s previous Bitcoin (BTC) analysis, click here!
Disclaimer: Cryptocurrency trading carries a high level of risk and may not be suitable for all investors. The views expressed in this article do not reflect those of BeInCrypto.


