


Since reaching a low of $3,850 on March 13, the Bitcoin price has increased considerably. At the time of writing, it was trading at $6,660, an increase of 80% since the low.
The increase has transpired in two upward waves, and the price is possibly creating the third such wave. Below, we will take a look at two possible patterns and make a prediction on the future short-term movement.
Three Drive Pattern
The first pattern we will take a look at is the three drive pattern. This was outlined by cryptocurrency trader @ACXtrades, who tweeted a Bitcoin chart stating that there is a ”three drive pattern playing out,” which according to him will take the price to $7,648.
Bullish perspective.
There's a 3 drive pattern playing out.
3 drive target would be 7648 which aligns to the void fill. pic.twitter.com/UufTOTsaaE
— ◇.A.C.X.◇ (@ACXtrades) March 23, 2020
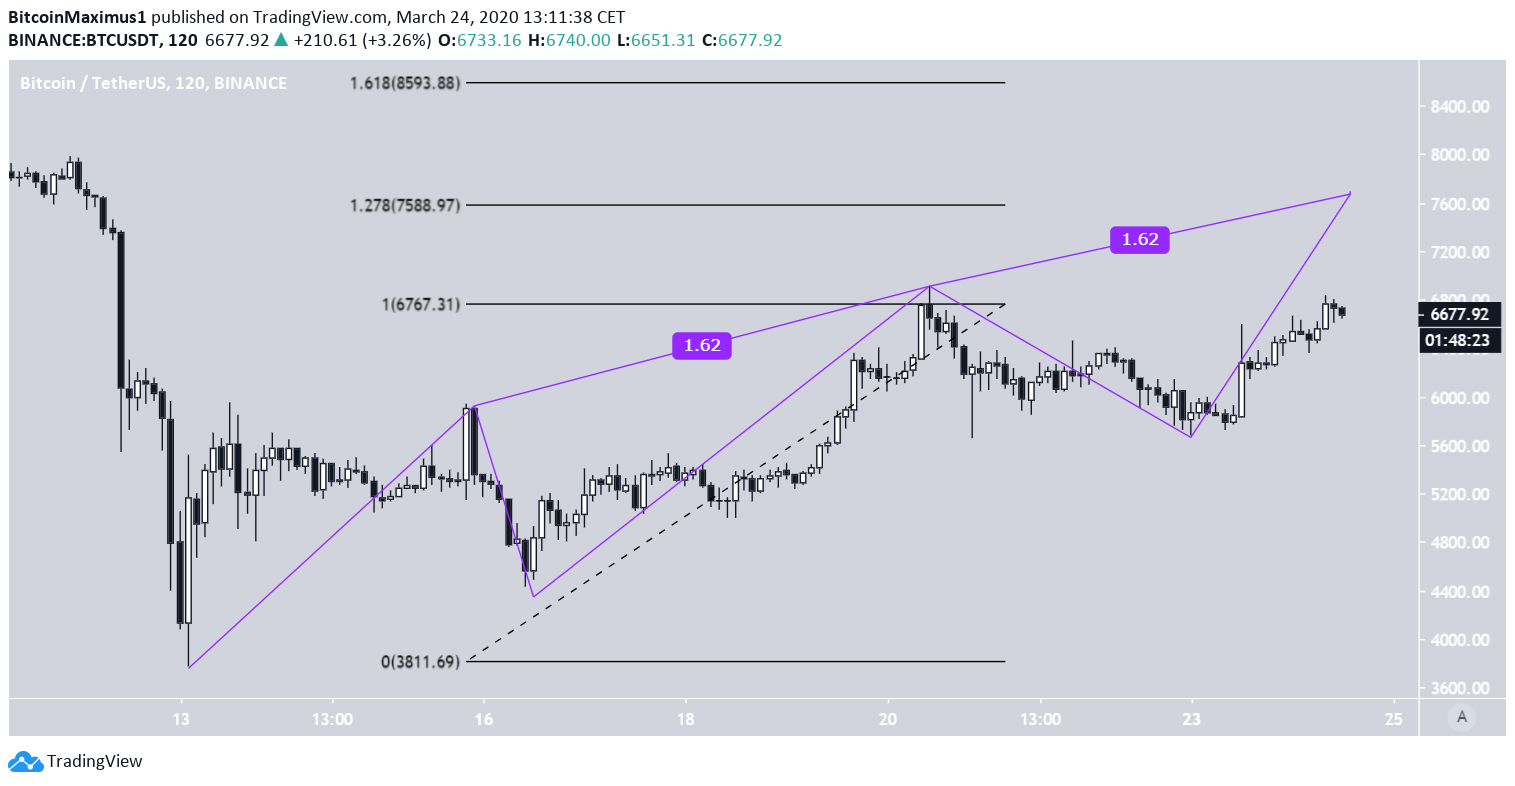
The three drive pattern began with the low of $3,850 reached on March 13. If valid, the price has completed the second correction and is in the process of beginning the third drive.
The $7,600 target is found by the 1.278 fib level of the entire pattern. In addition, if the third drive has an identical length relative to its correction to the second drive, it will reach the same exact high near $7,600. After this, a decrease would be expected.
Ascending Wedge
The second pattern we will take a look at is the ascending wedge. This was pointed out by @CryptoMichNL, who outlined a bearish pattern, the ascending wedge, in which the price is currently trading. He pointed out the importance of the $6,800-$6,950 resistance area, which could trigger a rapid increase if the price breaks out.
Bouncing alongside the equity markets here and tapping the highs.
Crucial area to break is still $6,800-6,950 zone. Breaking that & I'll be targeting $7,800 next.
Fully discussed;https://t.co/FiBzxF2gu7 pic.twitter.com/1PZkf4T4Xl
— Michaël van de Poppe (@CryptoMichNL) March 24, 2020
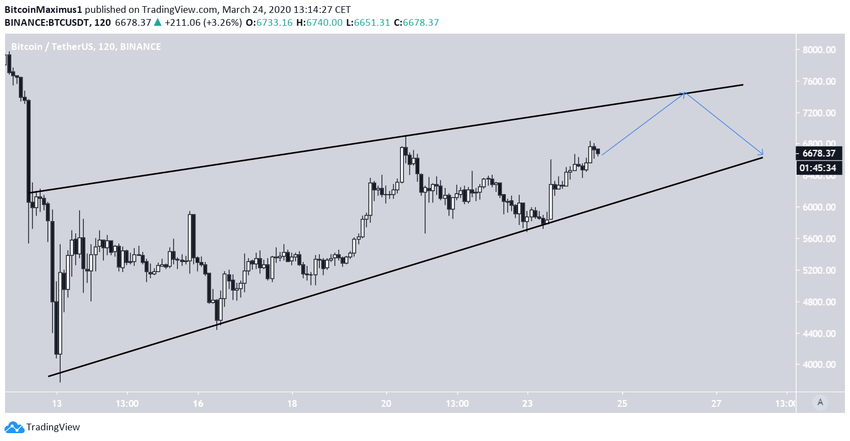
If the price is indeed trading inside an ascending wedge, the support line has been validated four times, while the resistance line could still take a different slope since it has only been touched twice. But, the current resistance line is near $7,400 and could rise to $7,600, depending on when the price touches it.
Therefore, it is possible that the price is doing both, completing a three drive pattern and trading inside an ascending wedge. Since the ascending wedge is a bearish pattern and a correction follows a three drive pattern, a price decrease would be expected afterward.
To conclude, the Bitcoin price has been rapidly increasing since reaching a low on March 13. The price is expected to continue doing so until it reaches a high near $7,600 before decreasing and possibly breaking down from its current trading pattern.


