


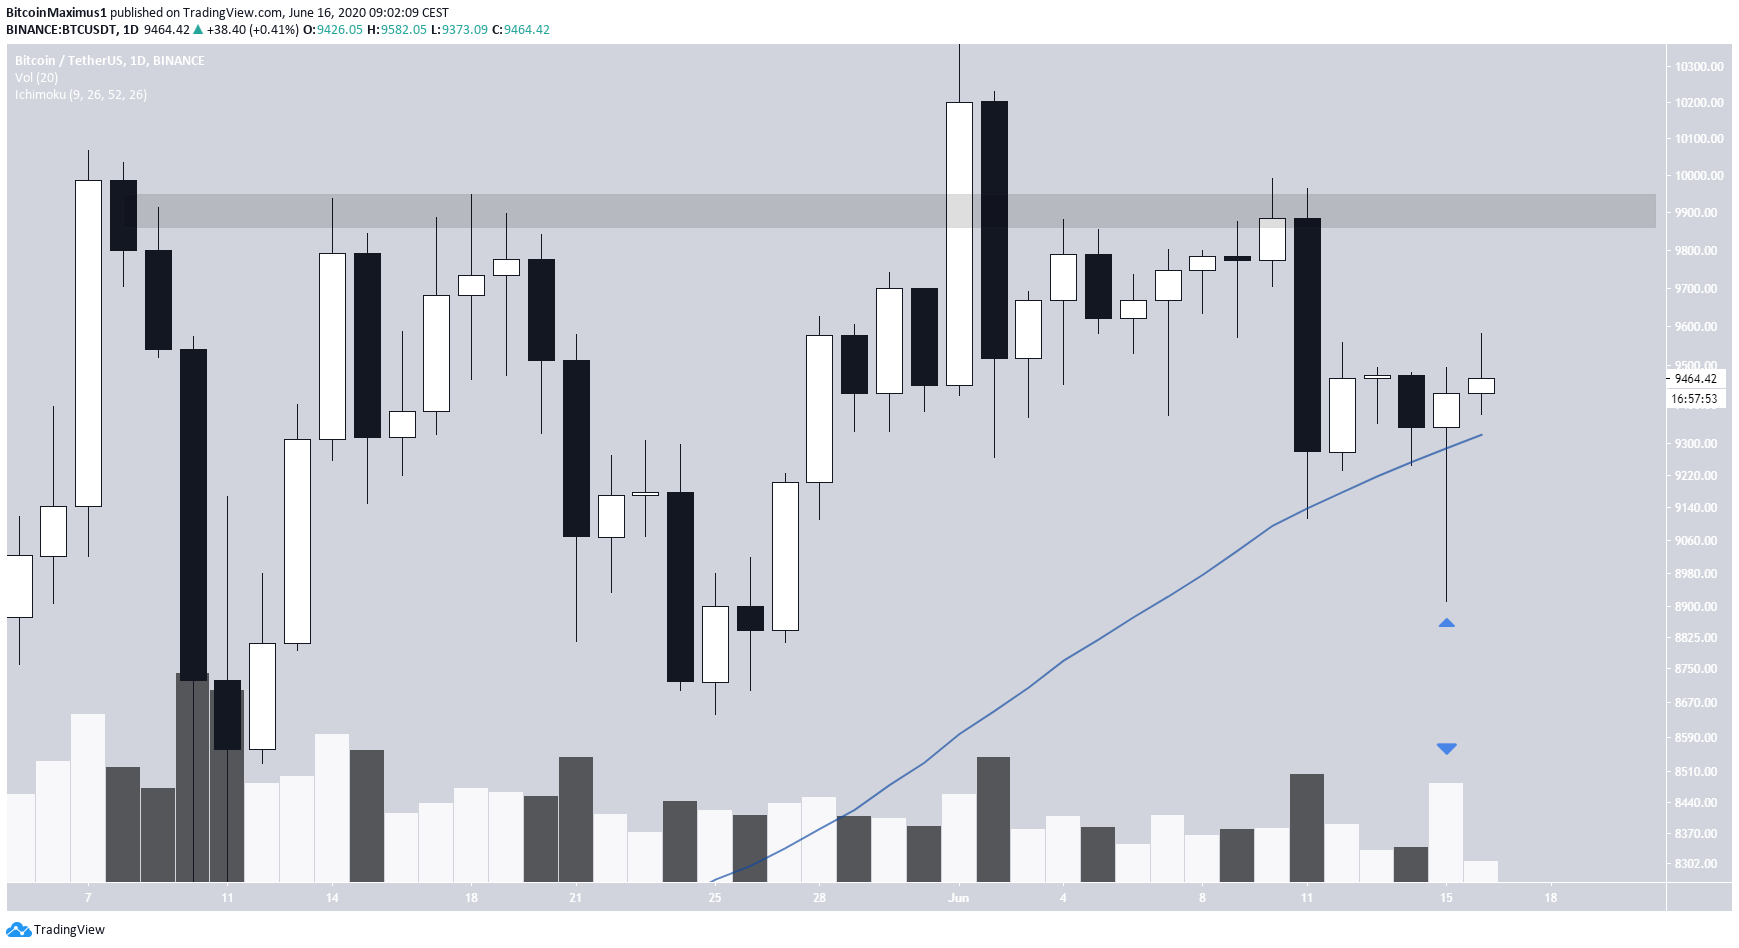
The Bitcoin price began the day of June 15 by decreasing considerably, reaching a low of $8,910. However, the lower prices could not be sustained and BTC increased to reach a close of $9,247, creating a bullish hammer in the process.
On June 15, the Bitcoin price initially decreased considerably, creating a long lower-wick and decreasing below the 50-day moving average (MA) with a low of $8,910. However, the price increased shortly after, creating a bullish hammer candlestick and reclaiming the aforementioned MA.
Daily Bitcoin Outlook
This is a bullish sign that suggests the price is likely to continue moving upwards. If it does, the closest long-term resistance area is found at $9,900. However, it is worth mentioning that yesterday’s close was not higher than the previous bearish candlestick, so the movement is not entirely bullish yet.
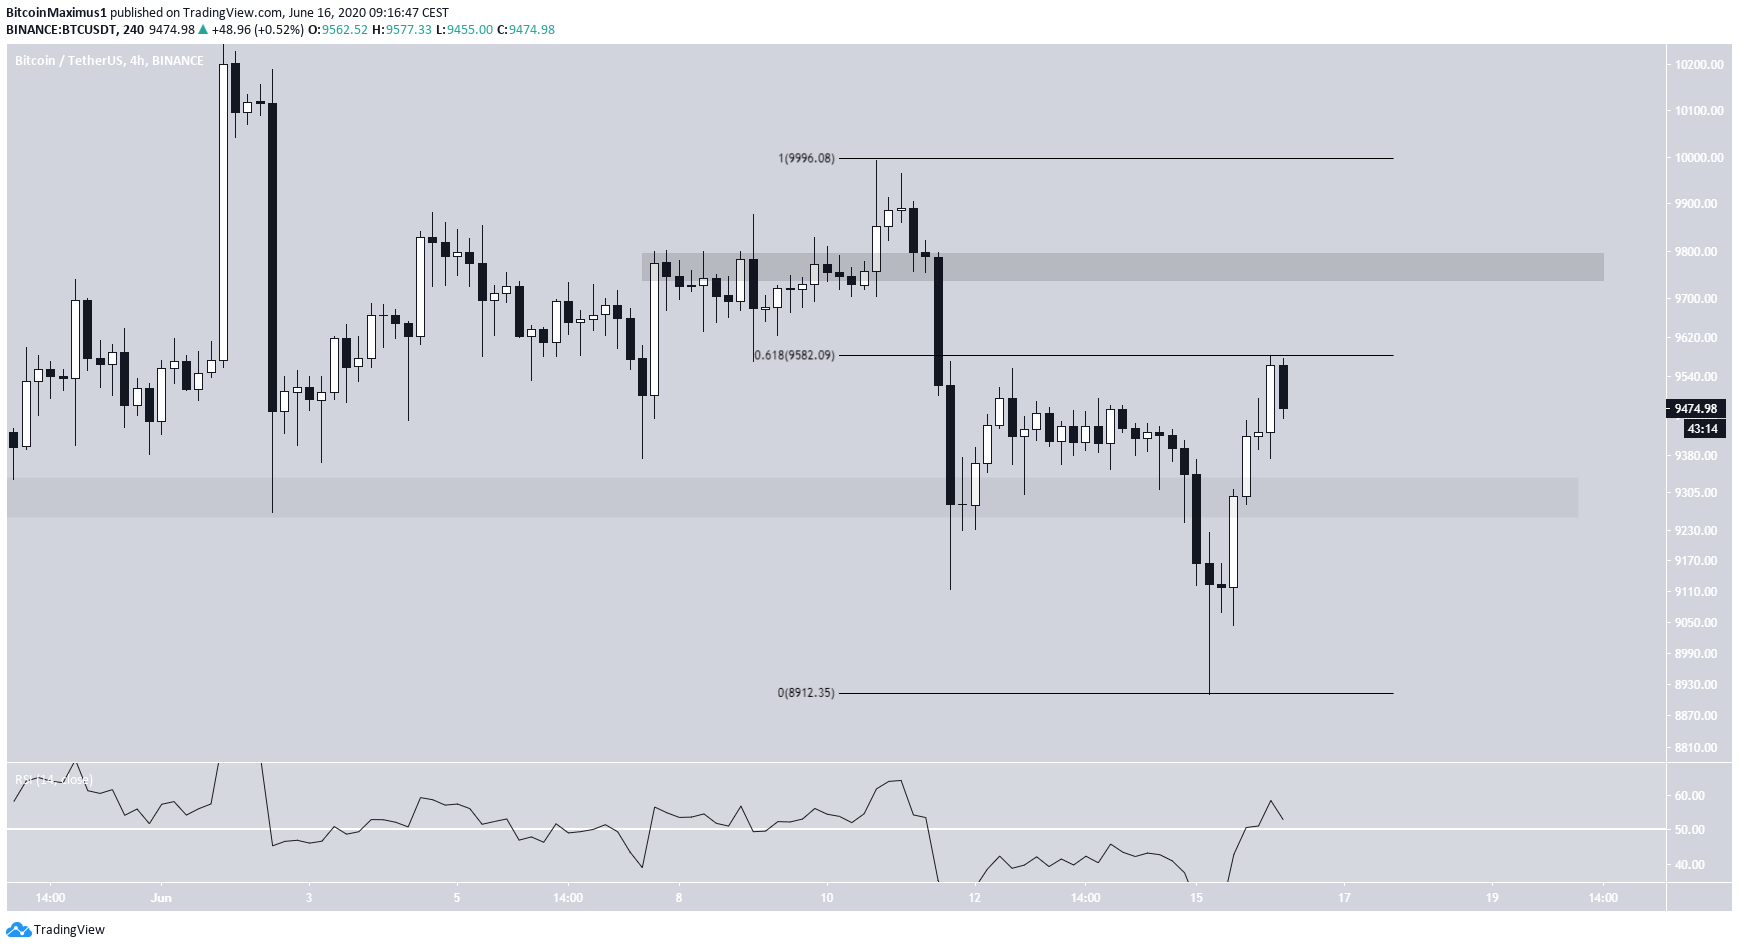
Short-Term Movement
In the shorter-term chart, we can see that BTC is currently trading at the 0.618 Fibonacci level of the entire decrease beginning on June 10. In addition, we can outline a more accurate resistance area at $9,780.
Furthermore, the main support area seems to be at $9,300, the level which was broken down and reclaimed yesterday.
The RSI has just moved above 50, a sign that the price is likely to continue moving upwards.
In the very short-term, BTC is following an ascending support line, which has a very steep slope. If the price continues following this support line, it is likely to reach the aforementioned $9,780 resistance area later today.
There are two signs which suggest this increase will occur. Volume was highest during the hourly candlestick that broke through $9,500. Since the volume was the highest in the candlestick which reached a higher price, there is no volume divergence. In addition, there is no bearish divergence in the RSI.
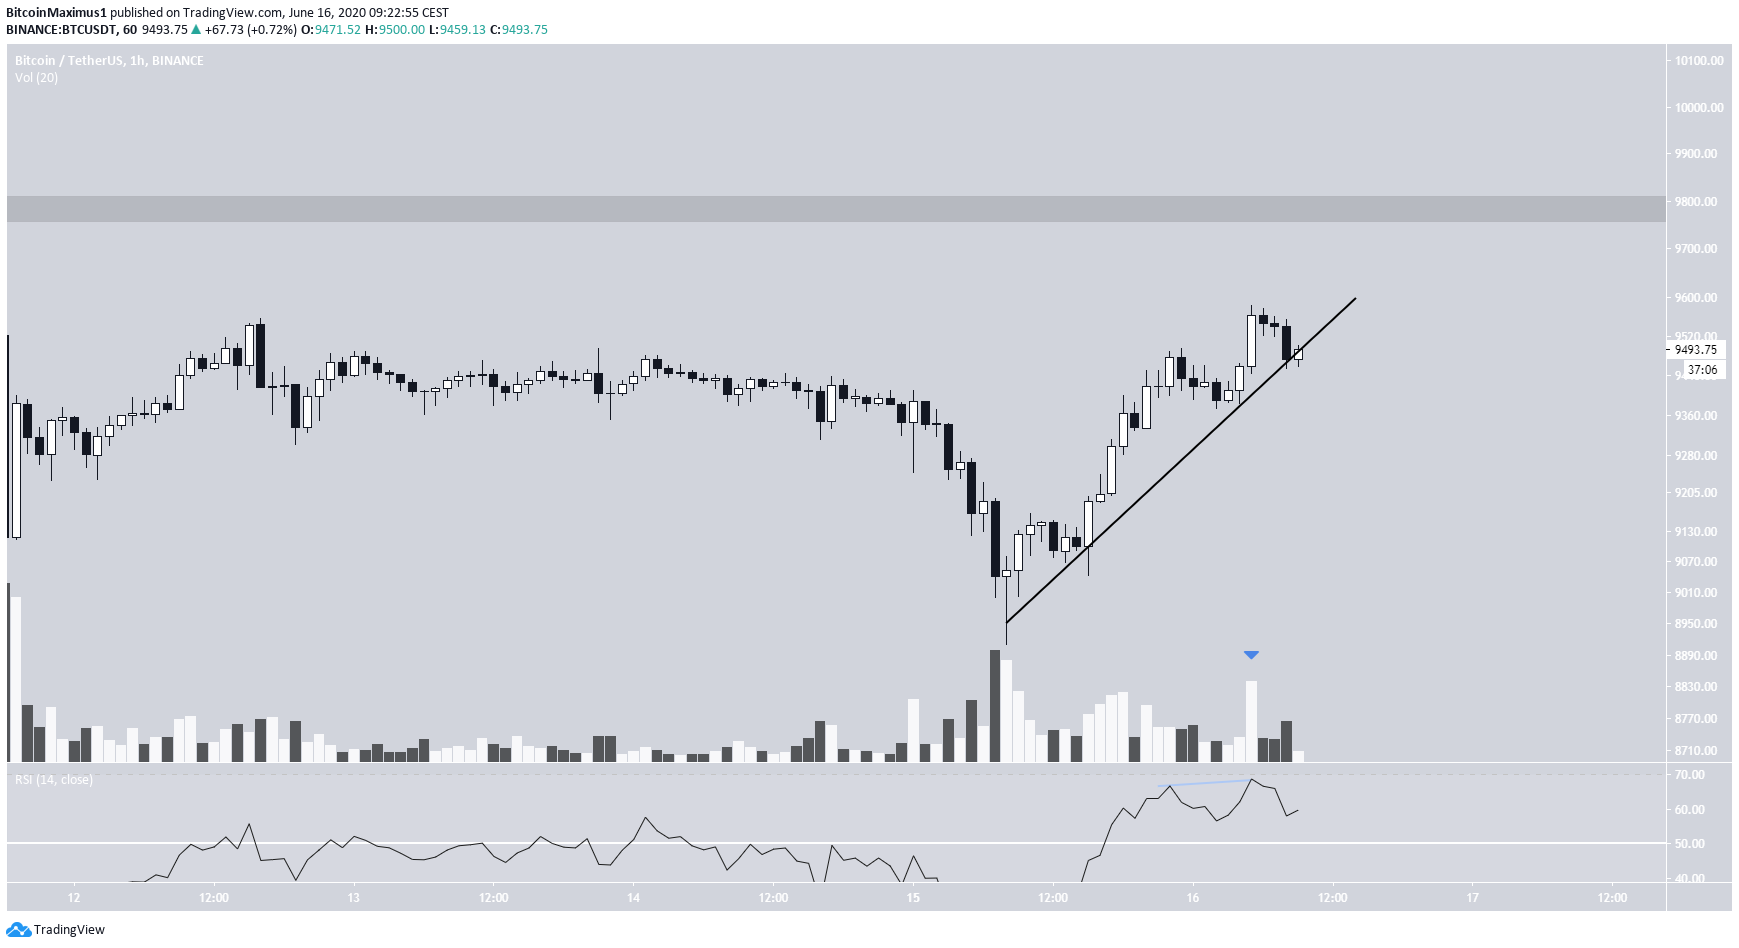
To conclude, the Bitcoin price has reclaimed an important support area and is likely to continue increasing until $9,800. However, the long-term price movement cannot be considered bullish until the price successfully flips $10,000 as support.
For our previous analysis, click here.


