
Bitcoin, Gold, and Silver may be presenting final buy opportunities for late bulls before what appears to be a certain resolution to the US government shutdown.
The price actions of BTC, XAU, and XAG indicate widespread optimism among bulls, even as chatter increases about the end of the longest US government shutdown.
US Government Shutdown Resolution Imminent: Bitcoin, Gold, and Silver to Rally?
Reports indicate that the US government shutdown could end this week, possibly as soon as Thursday, when Congress is expected to vote on the matter.
During past instances of US government shutdown, resolutions sent markets parabolic, inspiring hopes that history could repeat itself. If it does, the ensuing liquidity influx could flow into the digital gold (BTC) and commodity safe havens, such as XAU and XAG, driving a short-term price rally.
“Shutdown ending = liquidity shock incoming. Nearly $1 trillion sitting in the Treasury’s account is about to flood back into the economy…That’s the Short-term catalyst. The long-term one is QT, ending in December, and we have waited years for that one,” wrote Dan Gambardello.
With this in mind, the bulls are unrelenting, with momentum indicators and volume profiles showing steady hands still exist in the market.
Bitcoin Nurtures Recovery Rally
Since bottoming out at $98,944 on November 4, the Bitcoin price has been nurturing a recovery rally. It has recorded higher highs and higher lows. This trajectory suggests continued buyer interest despite macro uncertainty.
With the critical support at $100,300 still holding, the BTC/USDT trading pair has prospects for further upside. The immediate resistance sits at $104,300, followed by $106,234, levels that could be overcome as momentum steadily builds.
The RSI (Relative Strength Index) is rising, showing growing buyer momentum. Notice this momentum indicator has just deflected the signal line (yellow), effectively sidestepping a sell signal. When the RSI (purple) crosses the signal line to the downside, investors interpret it as a signal to sell.
A candlestick close above $108,173 could encourage more buy orders, restoring the Bitcoin price above the ascending trendline. Such a directional bias could set the tone for BTC to rise to recapture the $111,999 roadblock, potentially flipping it into support.
Nevertheless, chances of a new all-time high will only come after BTC records a decisive candlestick close above $123,891. This is the midline of the highest standing supply zone ($123,084 to $124,648).
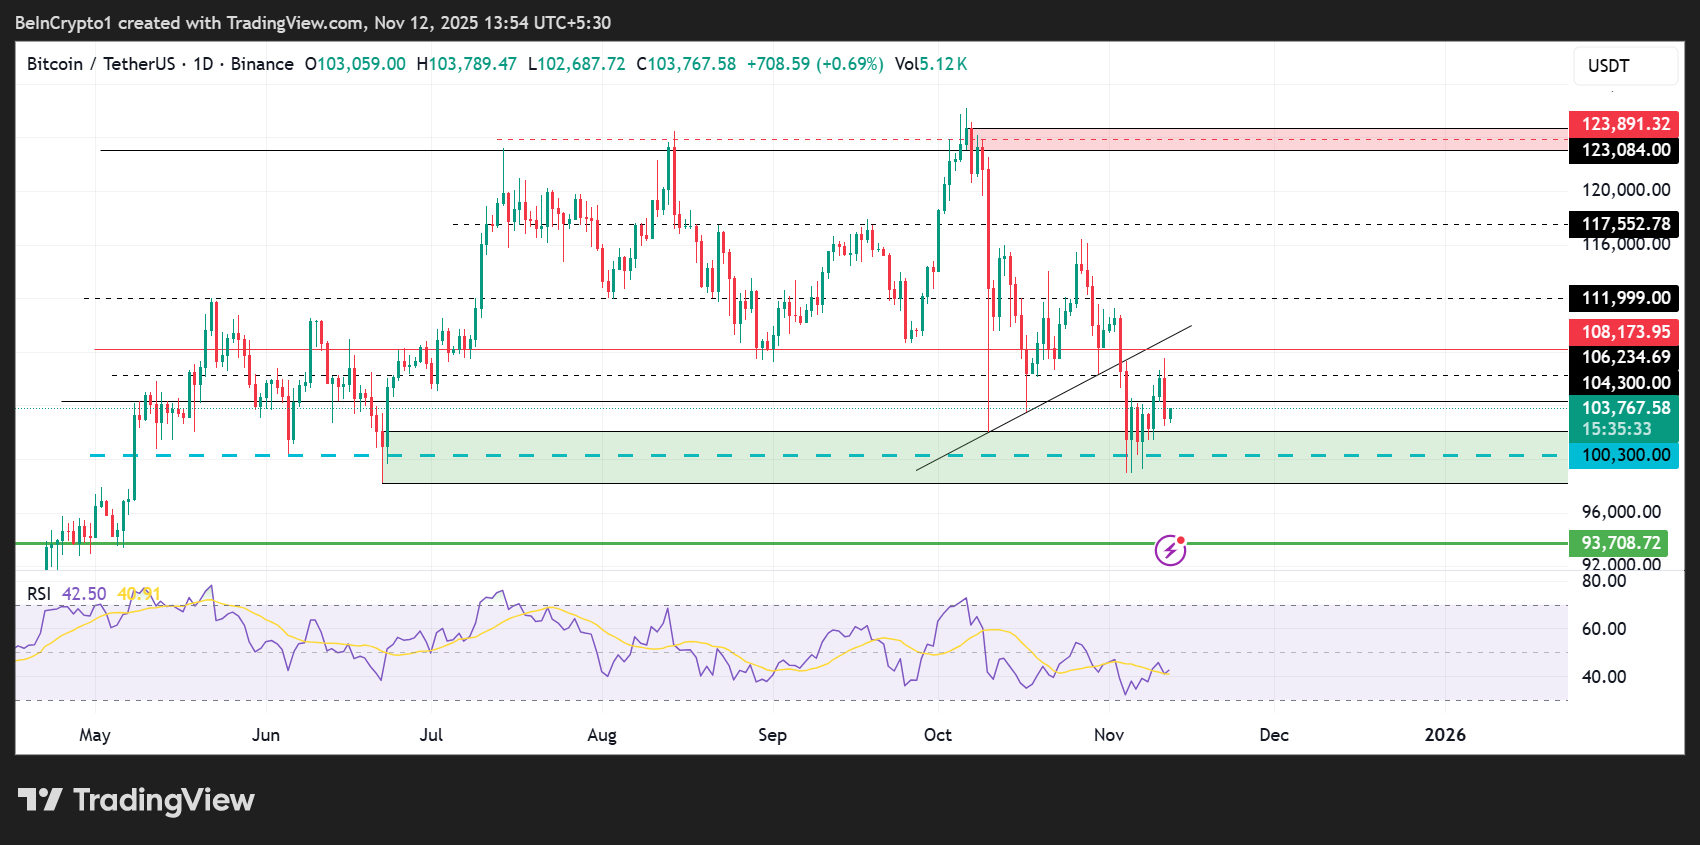
On the other hand, the RSI position below 50 indicates that while buyer optimism remains, momentum may not be sufficient to overcome the resistance at $104,300.
If this resistance holds, the Bitcoin price could pull back, falling into the demand zone between $98,200 and $104,132. If the BTC/USDT pair slips below the mean threshold of $100,300, it would exacerbate the losses. Then, BTC is likely to fall by 10% to $93,708.
Gold Could Rally Almost 5% to the October 25 High
Alongside Bitcoin, Gold is also coiling up for a potential bullish breakout after forming a bullish flag pattern. In technical analysis, this pattern forms after strong uptrends are followed by modest corrections and is considered a good continuation pattern.
They are called bull flags because the pattern resembles a flag on a pole. The pole is the result of a vertical rise in a stock, and the flag results from a period of consolidation. To determine the target objective of this technical formation, measure the height of the pole and superimpose it at the expected breakout point.
In the XAU/USD chart below, on the four-hour timeframe, the bullish flag pattern forecasts a 3.16% climb to $4,272, a level last seen on October 25.
The RSI position at 64 indicates that gold still has room to the north before it is considered overbought (70).
The fair value gap (FVG) lends credence to the supposition that there may be more room north. This zone represents an inefficiency or imbalance in the market when the price moves fast. On October 22, the gold price suffered its worst one-day crash in 12 years, leaving a market imbalance.
Until this imbalance is solved, the price will tend to go back to this zone between $4,188 and $4,244. A 4-hour candlestick close above its midline (also called consequential encroachment or CE) at $4,217 will confirm the continuation of the trend.
Such a move would increase chances of the gold price reaching the $4,217 target objective, or in a highly bulish case, extrapolate the gains to levels above $4,381, its local top, last tested in October.
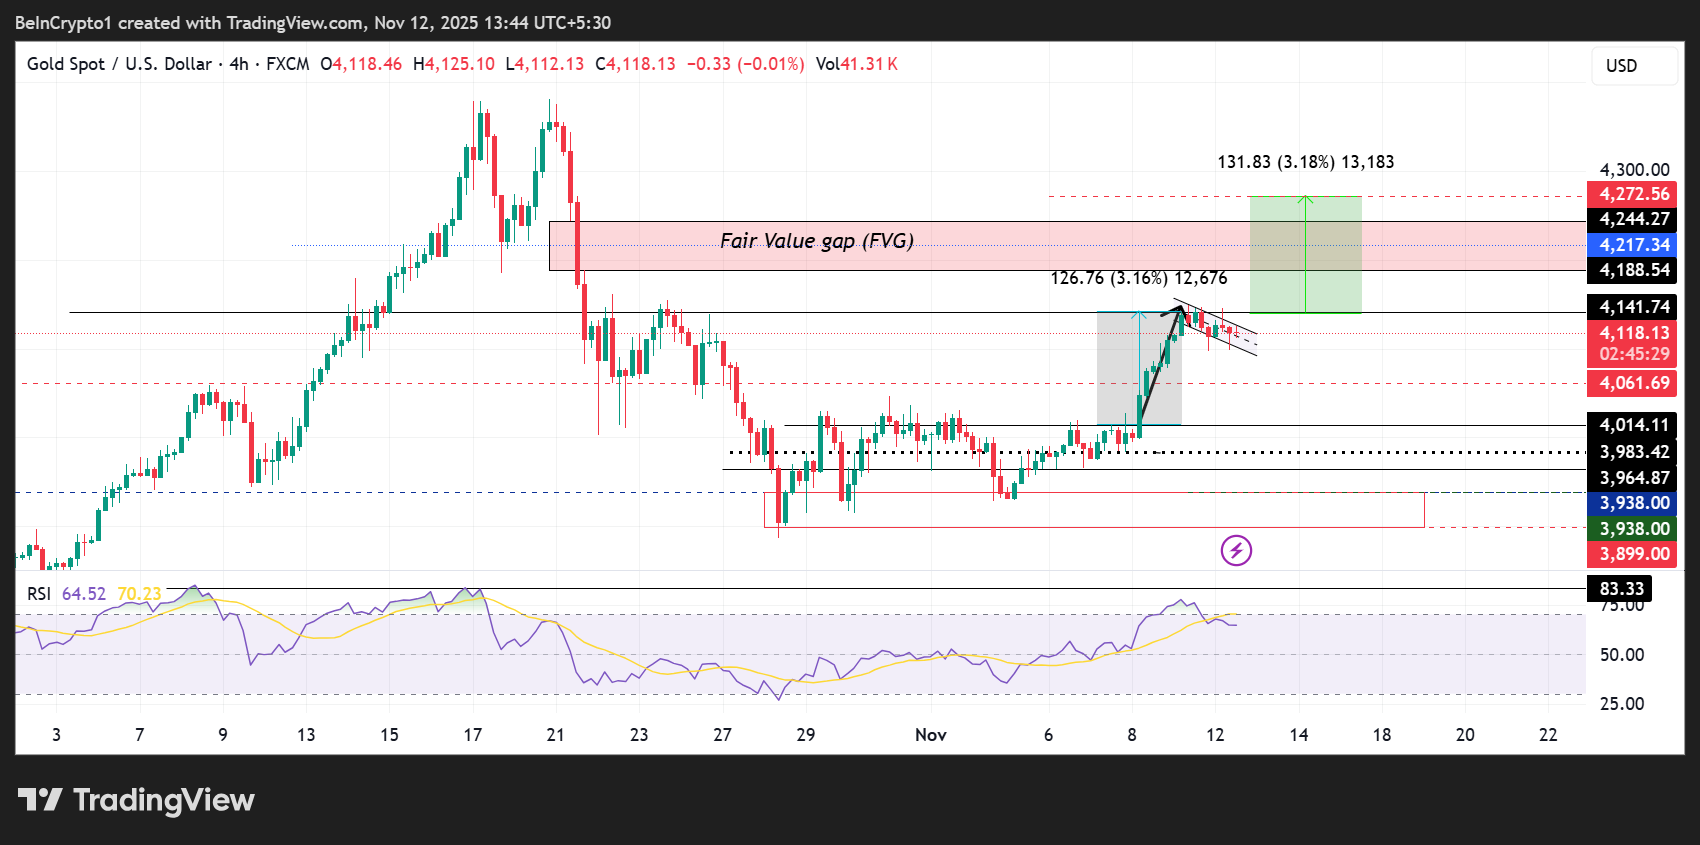
Conversely, if selling pressure increases, the gold price could drop to find immediate support at $4,061. A break and close below this level on the 4-hour timeframe would invalidate the bullish flag.
The ensuing seller momentum could plunge the gold price back into the consolidation phase between $4,014 and $3,964.
In a dire case, the downtrend could accelerate, sending the XAU/USD trading pair to collect sell-side liquidity between $3,899 and $3,938.
Silver Price Sets Eyes for $52.46, Will Momentum Hold Out?
The Silver price is bullish, recording a steady series of higher highs on the 4-hour timeframe. With the 61.8% Fibonacci retracement level providing critical support at $50.96, the XAG/USD pair could extend the gains.
If the Fibonacci indicator is enough to prompt a buy, the silver price could extend its neck higher to $52.46, a level last tested almost three weeks ago. The 78.6% Fibonacci retracement level earmarks this level.
Beyond this level, the silver price could rise to $54.37, over 5% above current levels. Despite the RSI position above 80 suggesting XAG is already massively overbought, its inclination to the north shows momentum is still rising. Besides, the XAG/USD RSI has gone this high before.
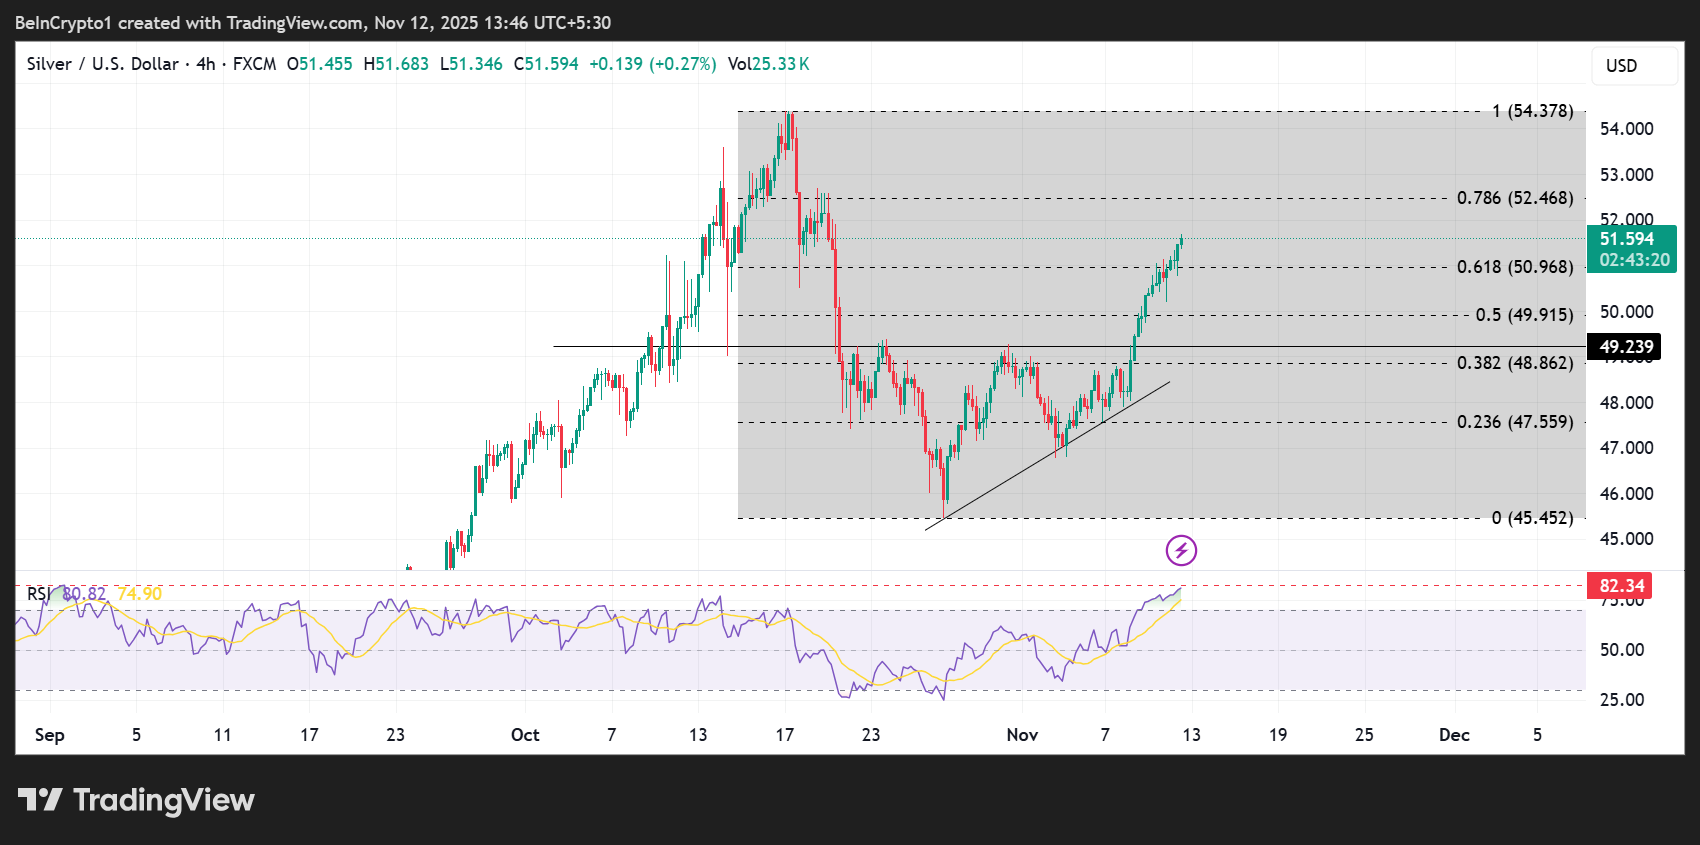
On the other hand, traders seeking to book early profits could potentially disrupt the silver rally. A breakdown of the $50.96 support level could lead to the XAG price dropping to $49.91. This is the midrange of the Fibonacci indicator.
Further down, the silver price could test the support at $49.23 or lower, to the 38.2% Fibonacci retracement level of $48.86.
A breakdown of this buyer congestion level could see the altcoin slip below the ascending trendline, potentially going as low as $47.55, the 23.6% Fibonacci retracement level. Such a move would mean an 8% drop below the current price.
