On June 1, the Bitcoin (BTC) price broke out from a pattern that had been in place for nearly one month and proceeded to reach a high of $10,380. While this is a very bullish development, the price has yet to move above a crucial resistance area that will likely determine the direction of the long-term trend.
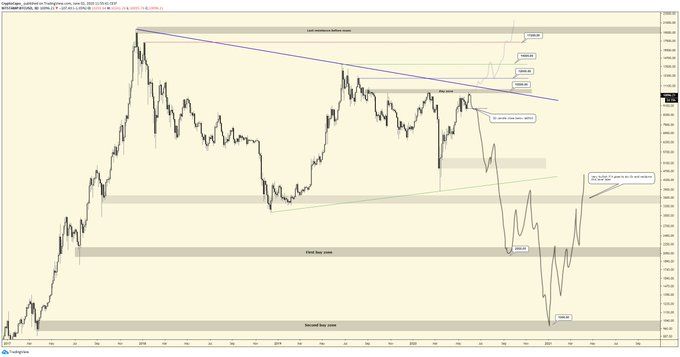
Cryptocurrency trader @CryptoCapo_ tweeted a chart saying that in order for the trend to pick a direction, the price has to move outside of the $8500-$10,500 area:
This is my plan. -3D candle close below $8.5k: bearish scenario (primary) almost confirmed. -S/R flip of the $10.5k level: bearish scenario almost invalidated, and targets should be $12k and $14k. Consolidation above $14k and it will probably go to the ath.
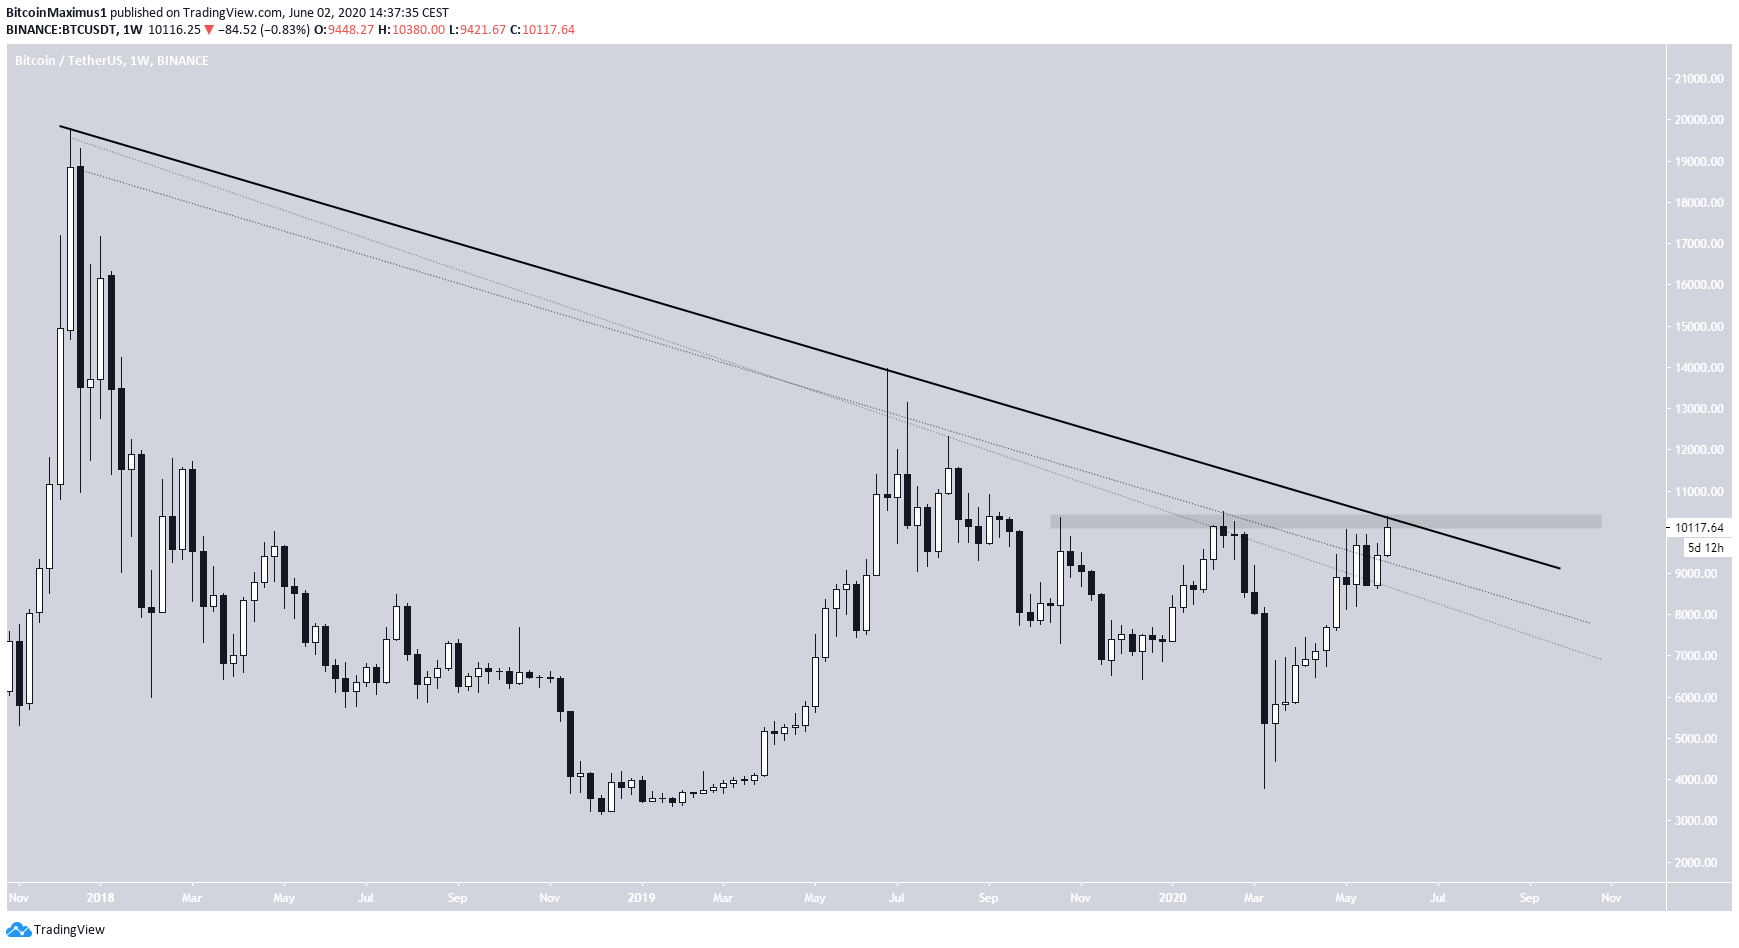
The importance of the $10,400-500 area cannot be overstated. The rallies on October 2019 and February 2020 ended at $10,370 and $10,500, respectively — while yesterday’s high was at $10,380.
Also, while there are several possible descending resistance lines drawn from the December 2017 high — the majority of which the price has already broken out — if we use the exact highs of December 2017 and July 2019, respectively, the price has just validated this descending resistance line for the third time.
Therefore, until the BTC price decisively clears this resistance, we cannot state that its long-term trend is bullish.
Short-Term Breakdown
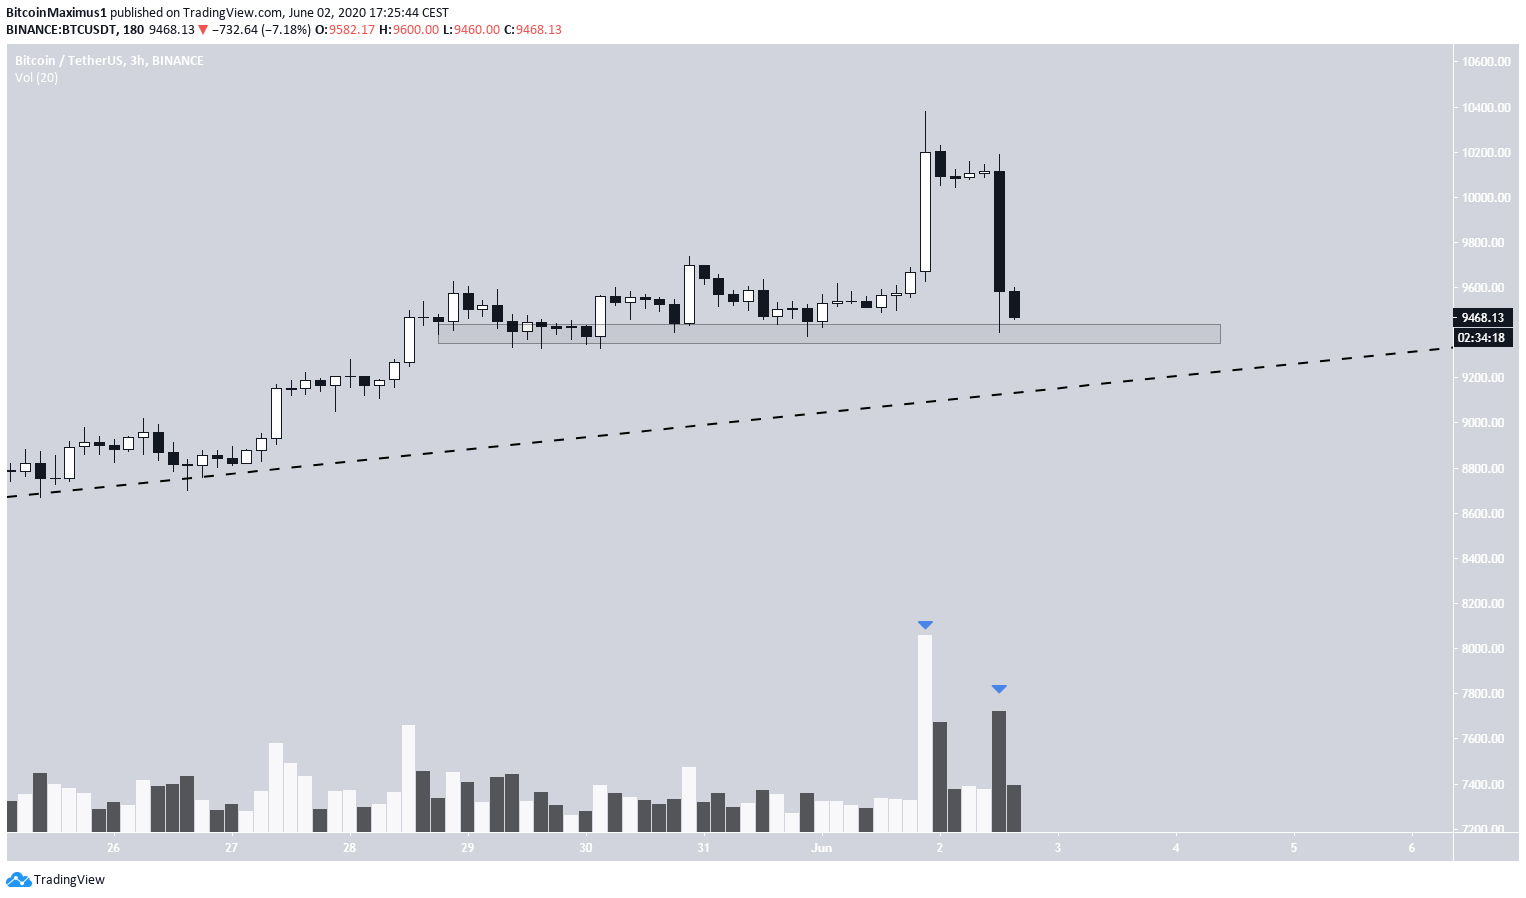
During the time of writing, the Bitcoin price was strongly rejected by the $10,500 area, creating a massive bearish engulfing candlestick in lower time-frames. However, the price is still holding on to the $9400 minor support area, allowing for the possibility of an upwards retracement.
In addition, it is worth noting that volume has been higher during yesterday’s breakout than during today’s decrease — suggesting that bulls are still in control.
In order for the direction of the long-term trend to be confirmed, the Bitcoin price has to do one of two things:
- Break out above $10,500 and validate it as support, which would make the trend bullish.
- Break down below the long-term ascending support line which is currently at $8900.
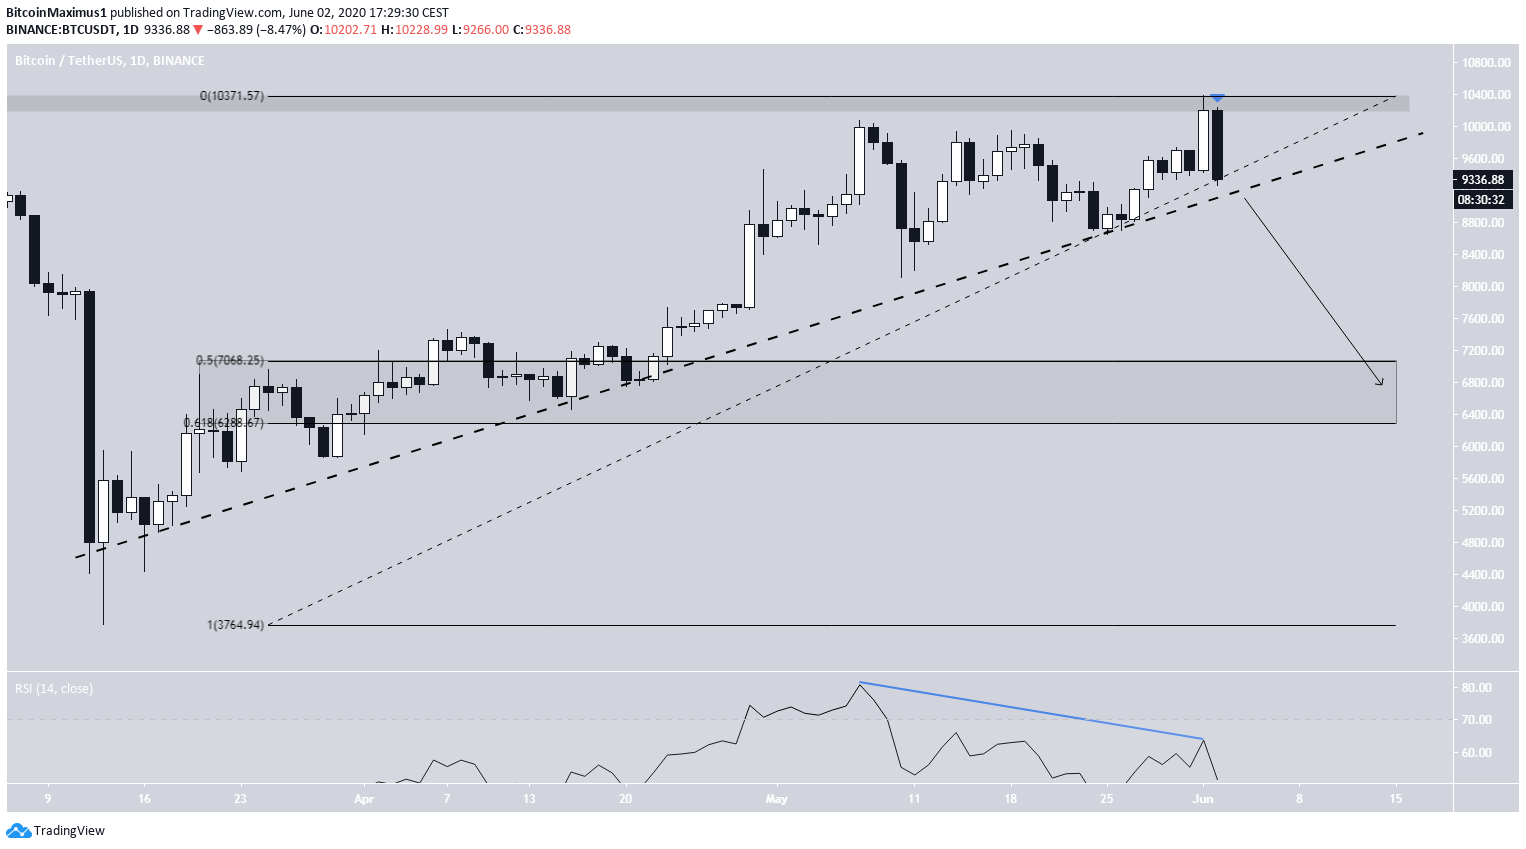
The BTC price is in the process of creating a bearish engulfing candlestick and has generated considerable bearish divergence in the daily RSI, so the second option seems more likely. However, until the price breaks down from the ascending support line, we cannot confirm that this is the case.
If the price were to break down, it could decrease all the way to $6200-$7000 — the 0.5-0.618 Fib levels of the entire upward move.