
On Oct 8, Bitcoin (BTC) broke out from a month-long consolidation pattern.
While there is still resistance left to clear, it is very likely that the trend is bullish.
Bitcoin Breaks Out from Triangle
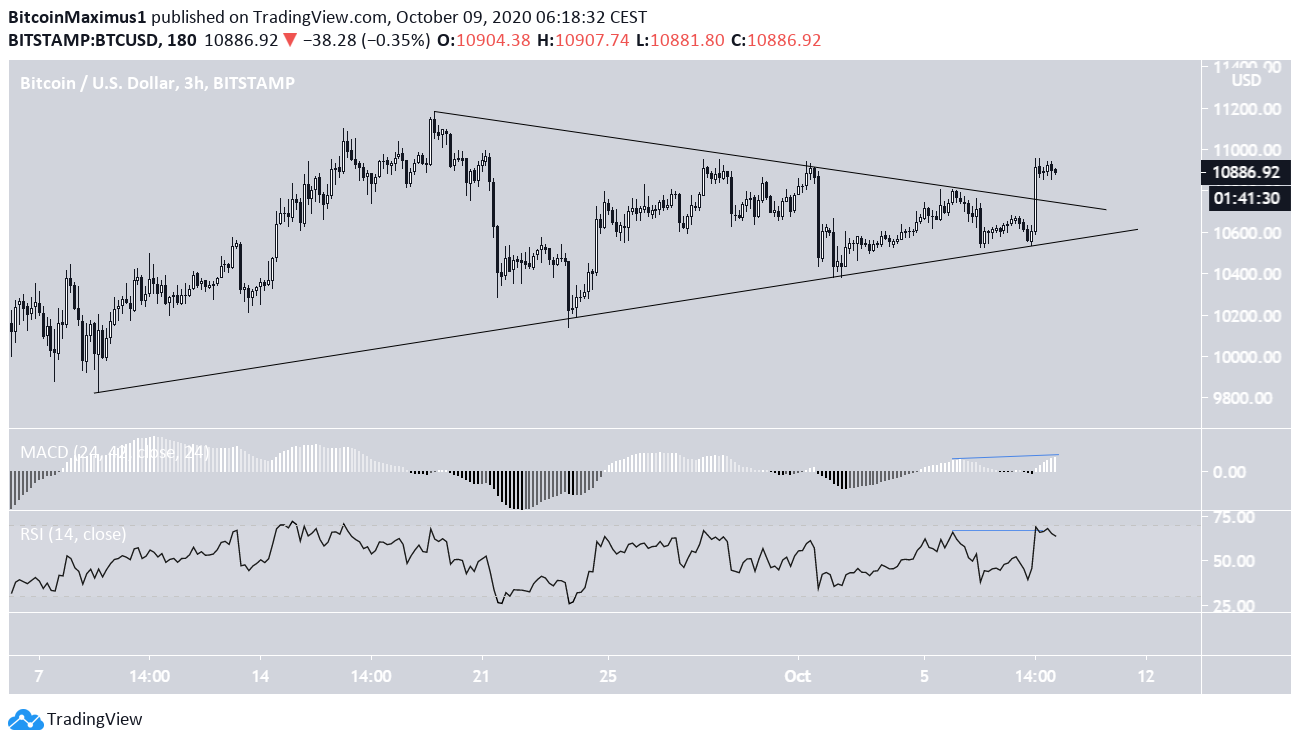
On Oct 8, the Bitcoin (BTC) price began an upward move that caused it to break out from a symmetrical triangle which it had been consolidating in since Sept 8.
There is no weakness in short-term time-frames yet. Both the RSI and MACD are increasing and neither has generated a bearish divergence.
Therefore, the breakout looks legitimate and a continuation of the upward movement is expected.
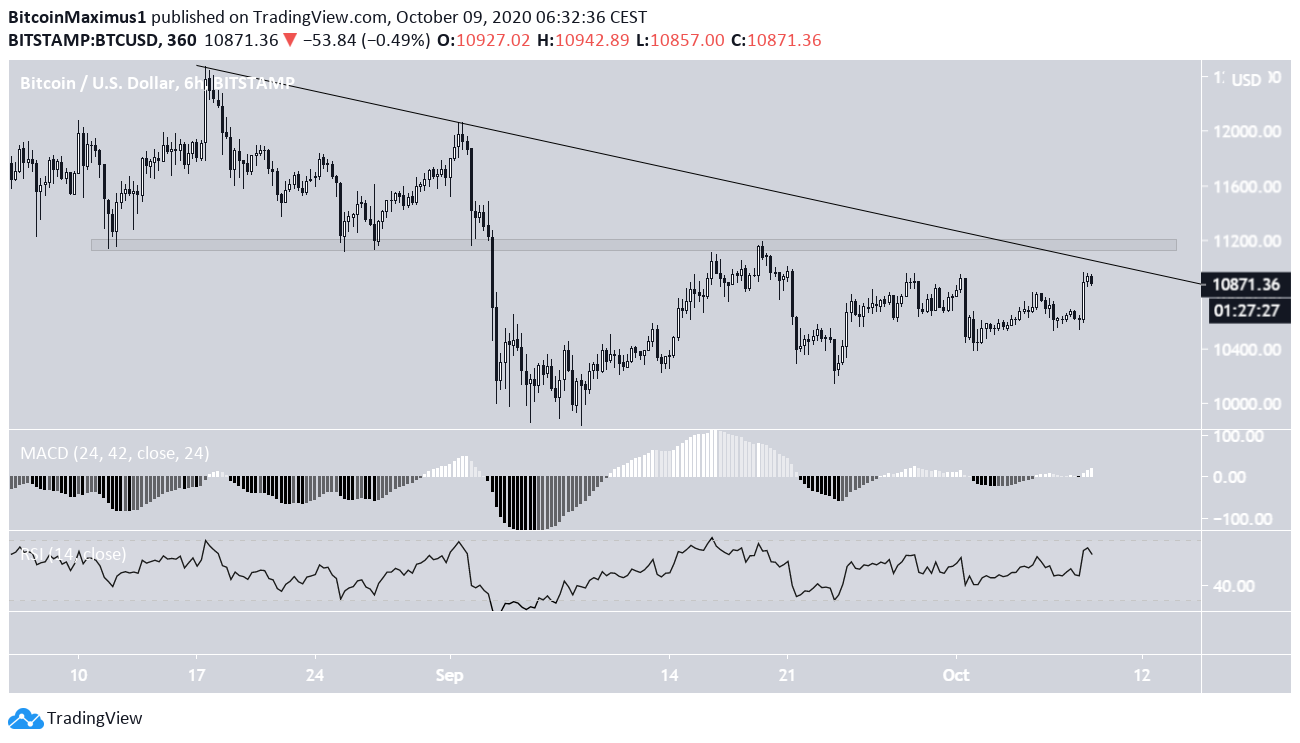
However, the price is still facing very strong resistance at $11,200.
The area previously acted as support before turning to resistance on Sept 19. In addition, it coincides with a descending resistance line drawn since the Aug 17 high.
Similar to the 2-hour time-frame, there are no bearish signals on the 6-hour chart. Both the RSI and MACD are increasing without generating bearish divergence.
A breakout above the $11,200 area would confirm that the trend is bullish.
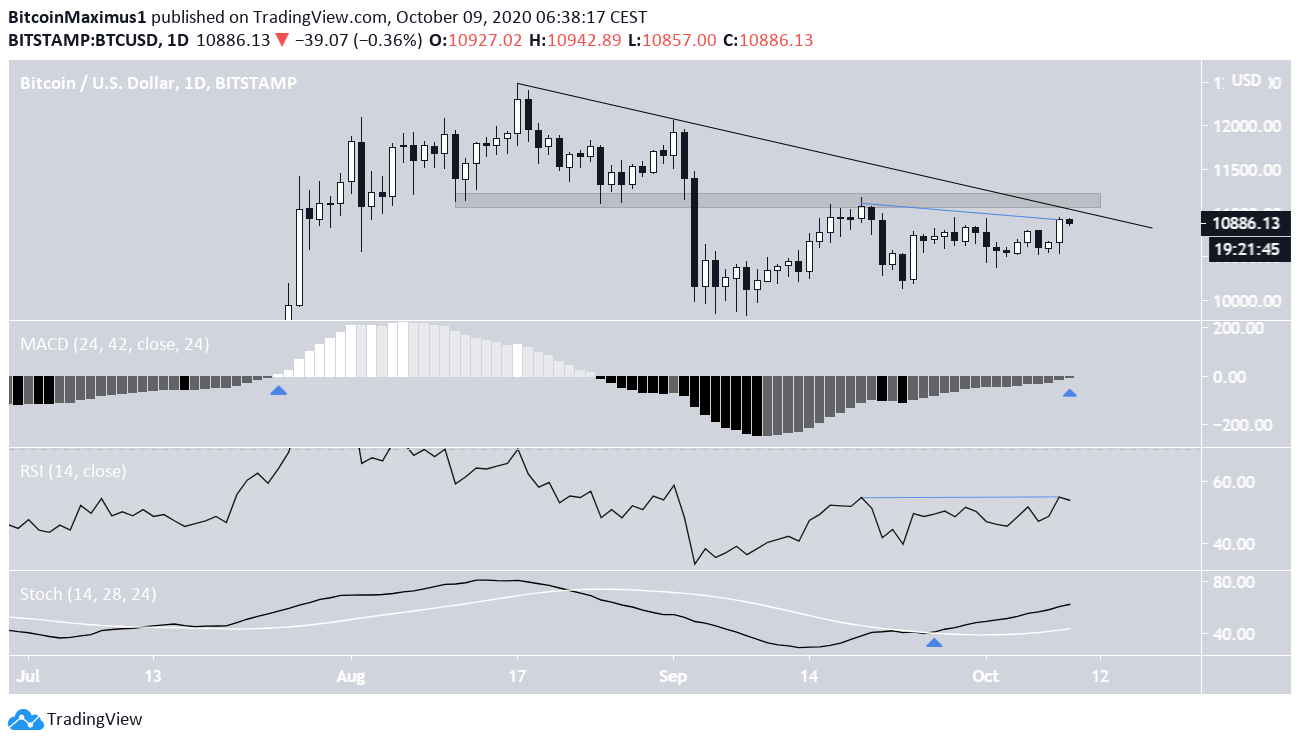
The daily time-frame is also bullish as the MACD has almost crossed into positive territory. If it does, it would be the first time it has done so since July 25. The Stochastic Oscillator has also made a bullish cross and is moving upwards.
While the possible hidden bearish divergence in the RSI raises some flags, it is not yet confirmed and is not sufficient to neutralize the other bullish signs.
Therefore, the price is expected to make another attempt at breaking out above $11,200.
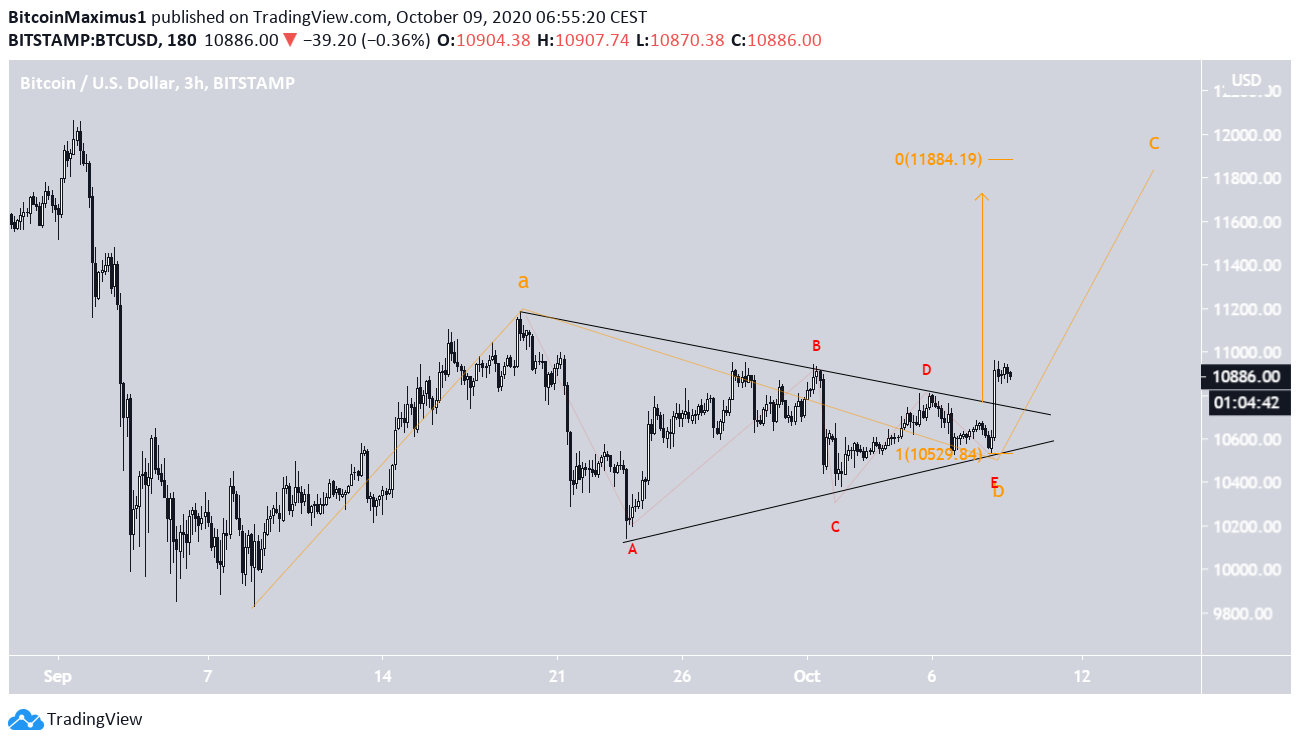
Wave Count
BTC likely began a bullish impulse (shown in orange below) with the aforementioned low on Sept 9, which created the symmetrical triangle. If so, the price is currently in wave three of a five-wave formation.
The sub-wave and minor sub-wave counts are given in blue and red, respectively.
A decrease below $10,374 would invalidate this wave count.
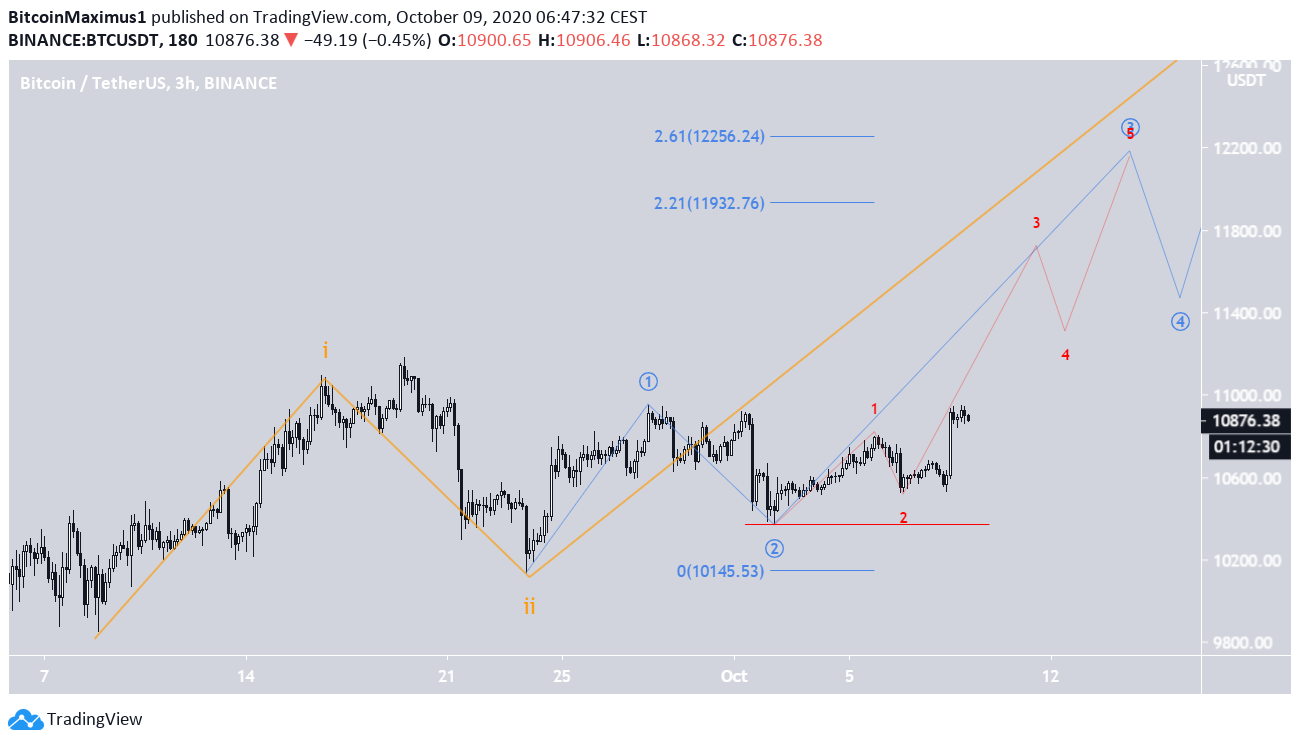
There is an alternative count which suggests that the triangle breakout was the B wave of an A-B-C formation (orange). The count still suggests that the price will increase towards $11,800, a target found by projecting the length of wave A to C and the length of the triangle to the breakout point.
However, a decrease would likely follow instead of continuation towards a new yearly high.
To conclude, the Bitcoin price is expected to make another attempt at breaking out above $11,200 and possibly continue higher.
For BeInCrypto’s previous Bitcoin analysis, click here!
Disclaimer: Cryptocurrency trading carries a high level of risk and may not be suitable for all investors. The views expressed in this article do not reflect those of BeInCrypto.
