


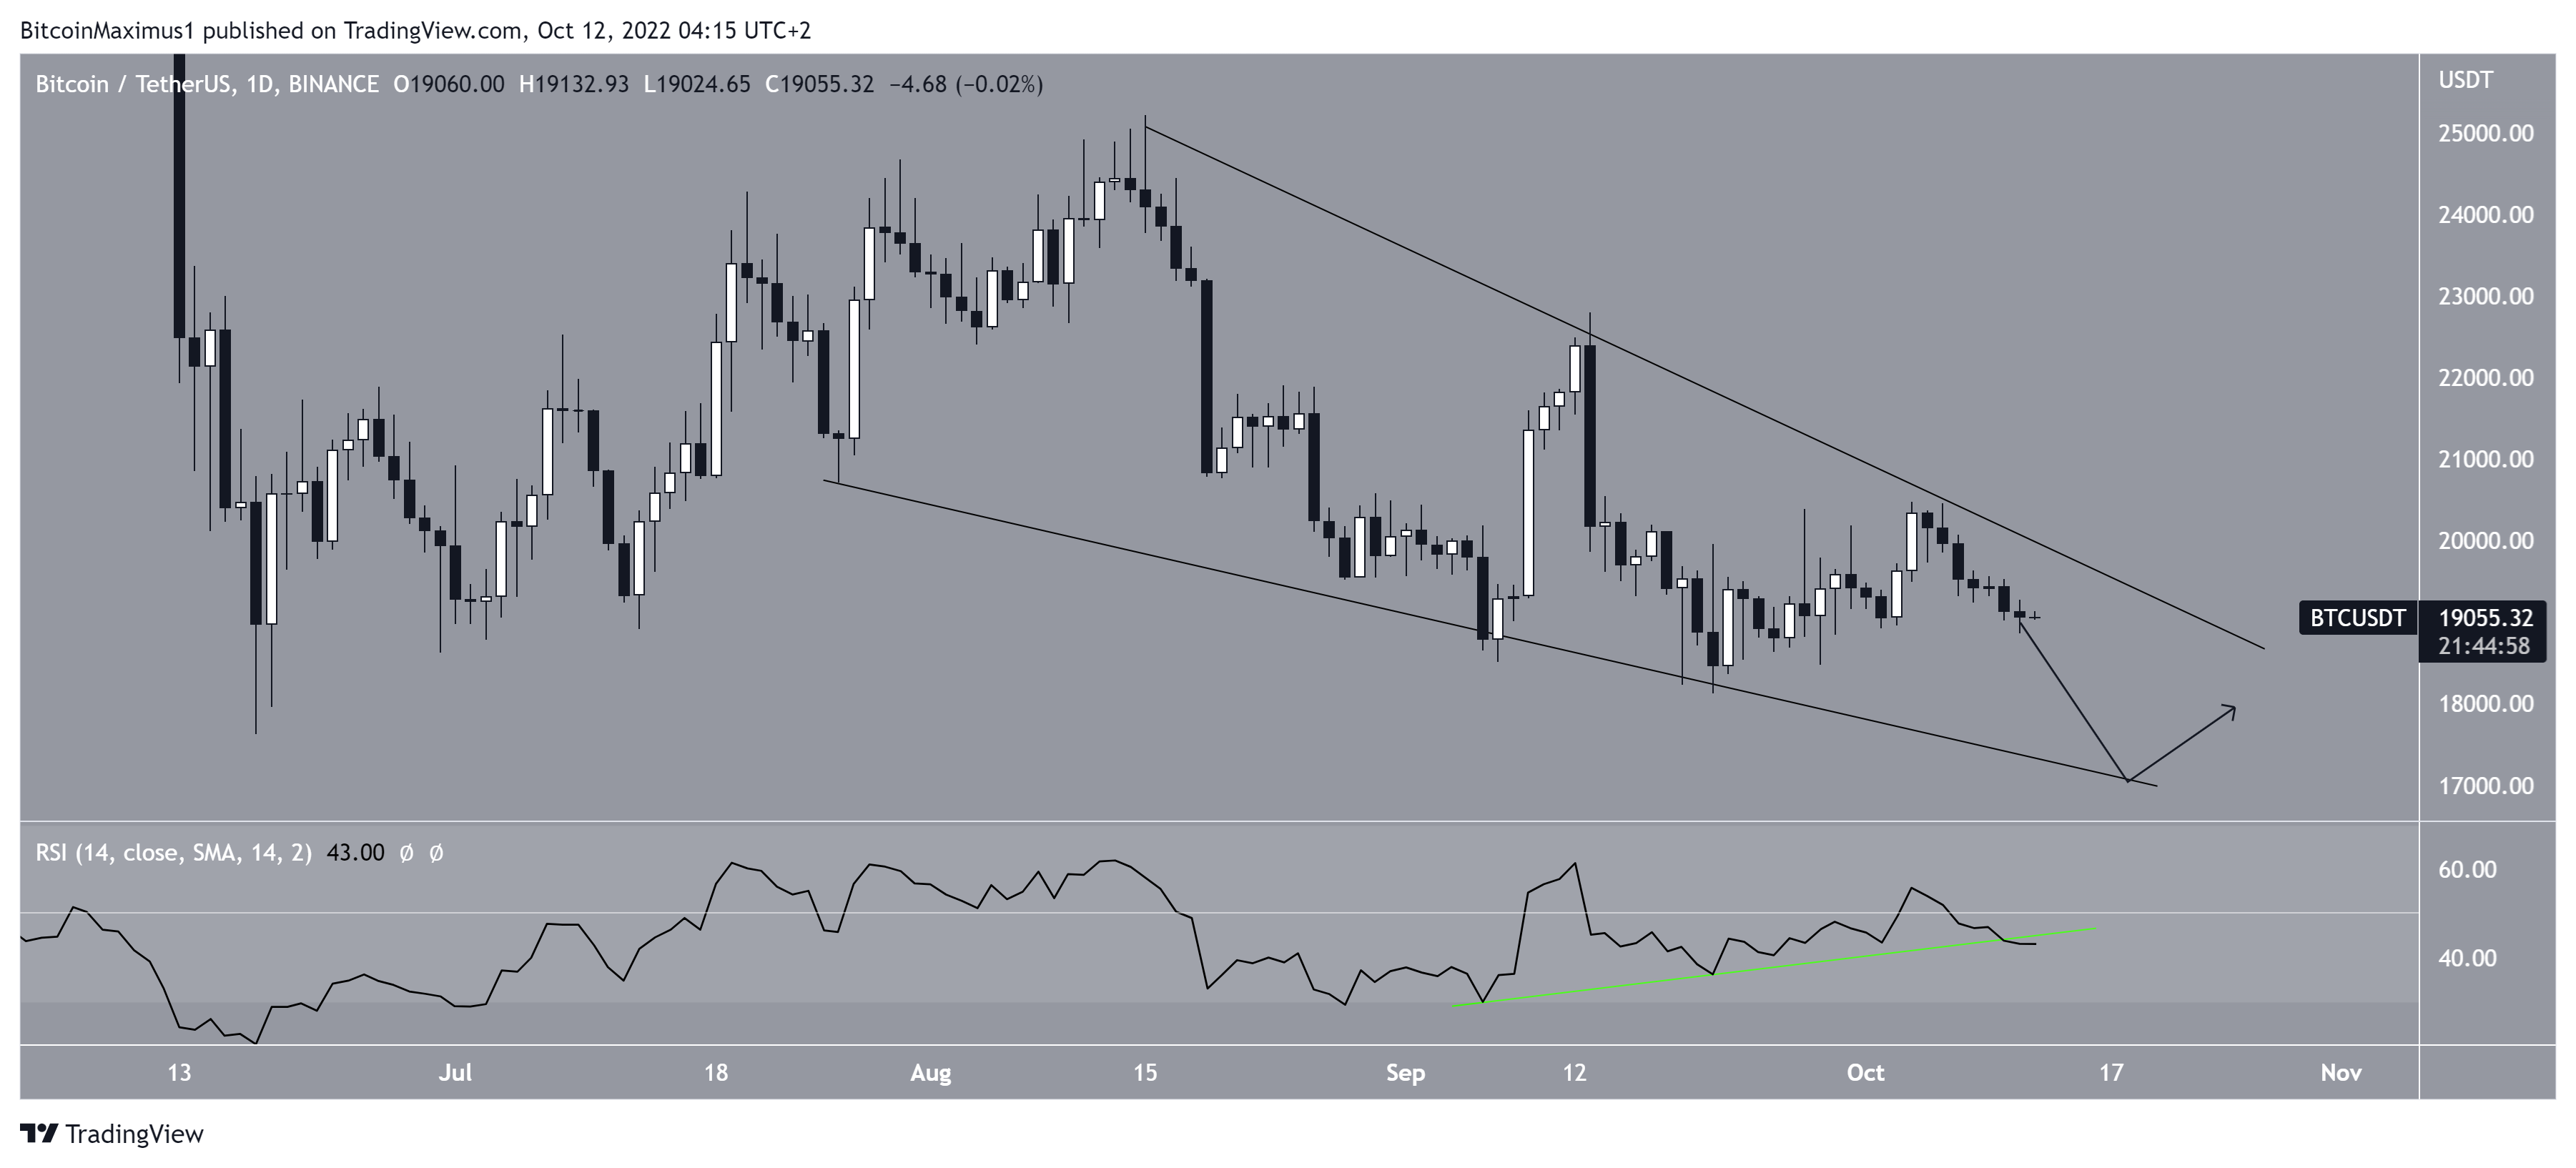
Bitcoin (BTC) price is trading inside a descending wedge and could complete its correction after one final decrease in the crypto market.
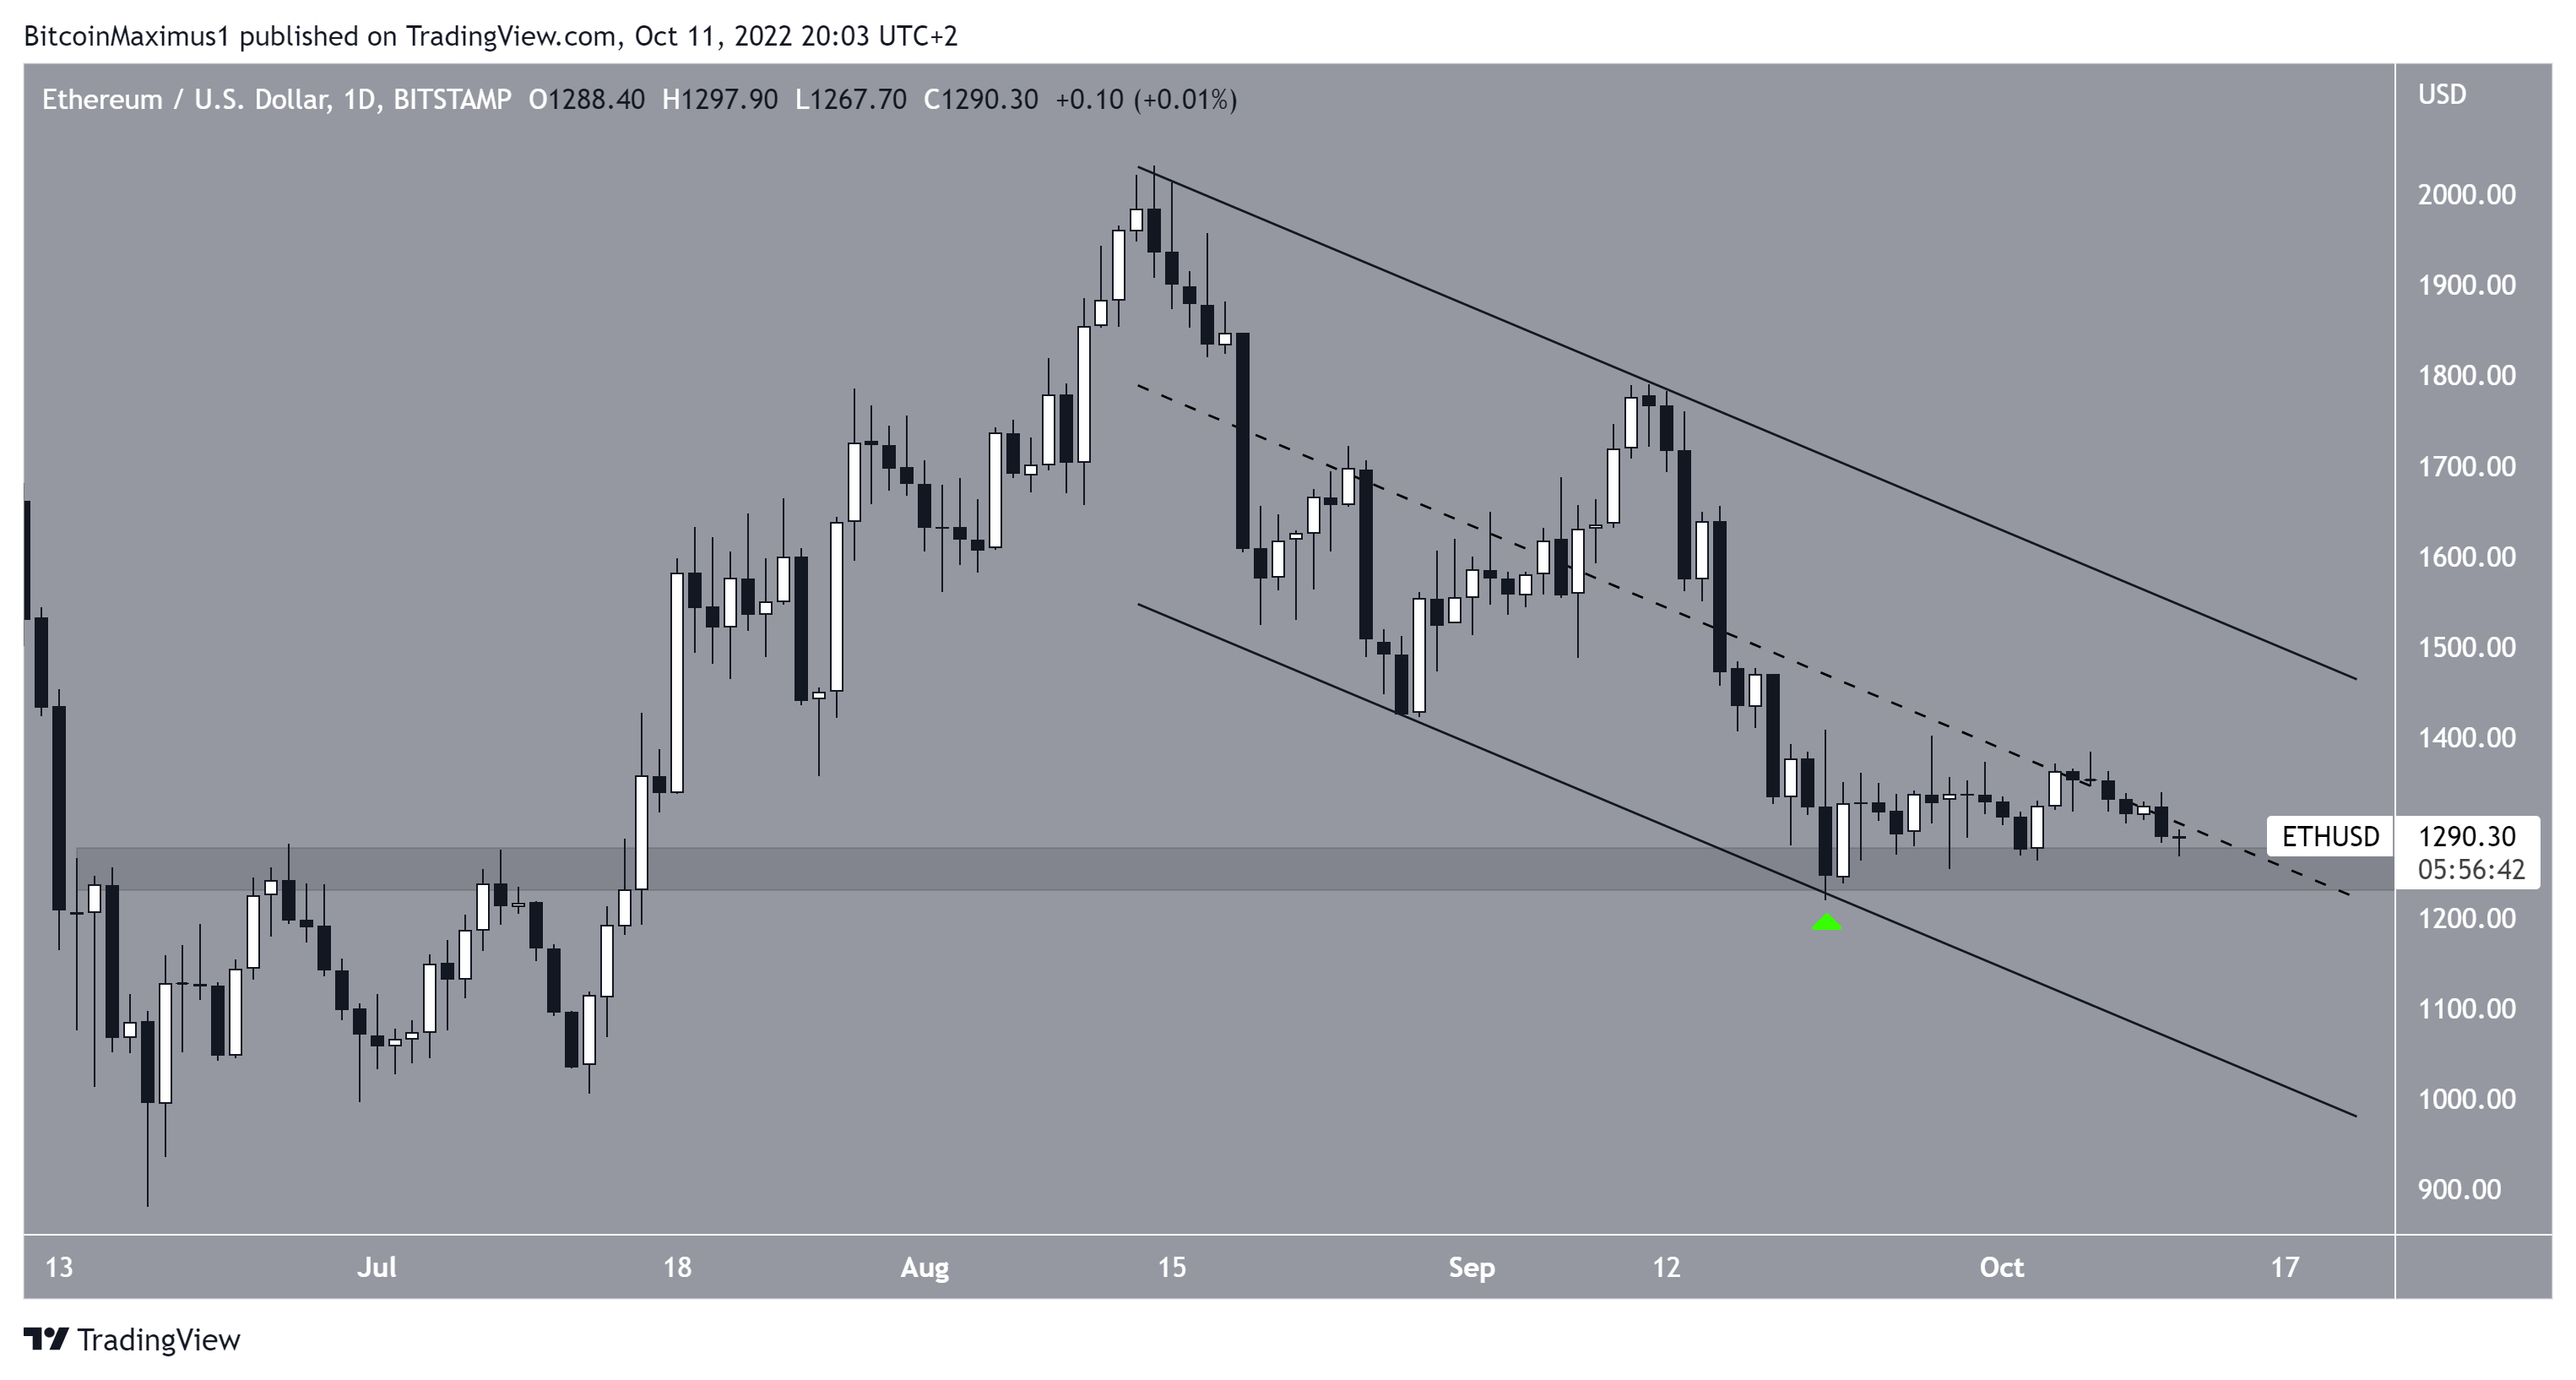
Ethereum (ETH) price is still holding above the $1,260 horizontal support area. It is possible that the correction is complete regardless of the crypto news surrounding the token.
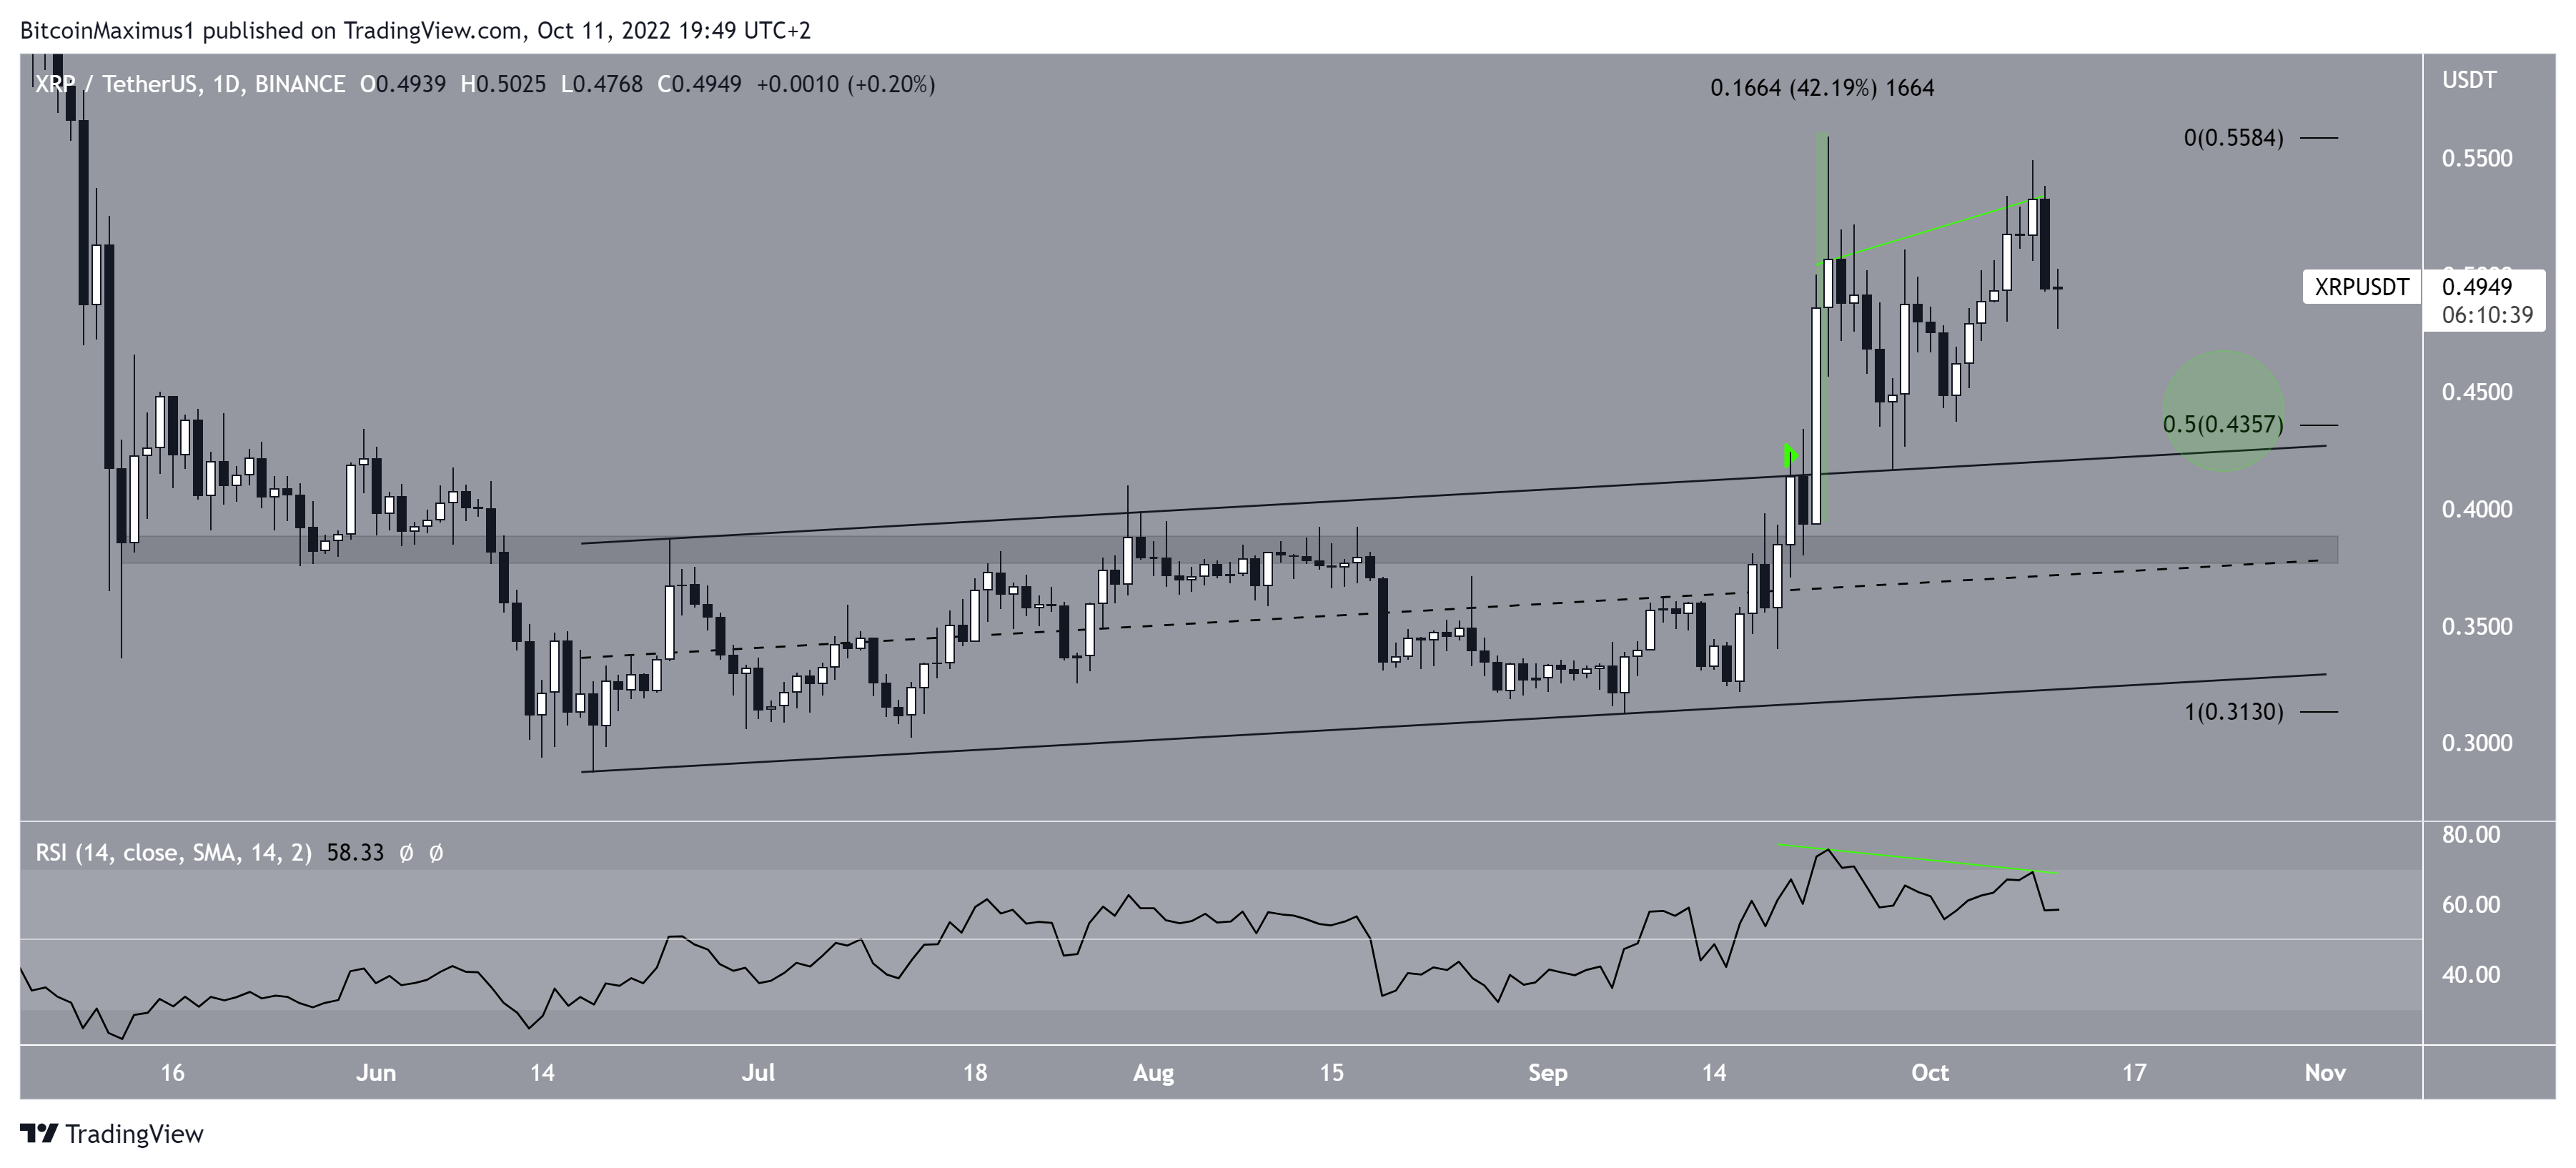
The bearish pattern for the XRP price, alongside its bearish divergence, suggests that a short-term downside is expected, even with speculation mounting around the Sec vs Ripple lawsuit.
Bitcoin Price Prediction: BTC bound for another downswing
BTC price has been decreasing inside a descending wedge since reaching a high of $25,211 on Aug. 15. The downward movement has led to a low of $18,125 on Sept. 21. This was just slightly above the yearly low of $17,622, which was reached on June 18.
The descending wedge is considered a bullish pattern despite the negative Bitcoin news, meaning that an eventual Bitcoin price breakout from it is expected.
The six-hour RSI is bearish since it has broken down from its ascending support line (green line) and has decreased below 50.
As a result, a downward BTC price movement toward the support line of the wedge seems likely for. This would also cause a Bitcoin price re-test of the yearly lows.
Ethereum Price Prediction: ETH holds a key support level
ETH price has been falling inside a descending parallel channel since reaching a high of $2,030 on Aug. 13. The downward Ethereum price movement led to a low of $1,243 on Sept. 21.
Descending parallel channels usually contain corrective movements. As a result, an eventual ETH price breakout from the channel would be likely for the price of Ethereum.
On Sept. 21, ETH price bounced at the confluence of the $1,260 horizontal support area and the support line of the channel (green icon).
While it has yet to initiate a significant upward movement, Ethereum price has managed to hold on above the support area.
An increase above the middle of the channel would be a strong sign in indicating that the downward movement is complete, and an eventual breakout in ETH price will follow.
Conversely, a rejection from the middle of the channel would indicate that Ethereum price could fall toward the $1,050 region, but the Ethereum news could turn positive, invalidating the bearish ETH price prediction.
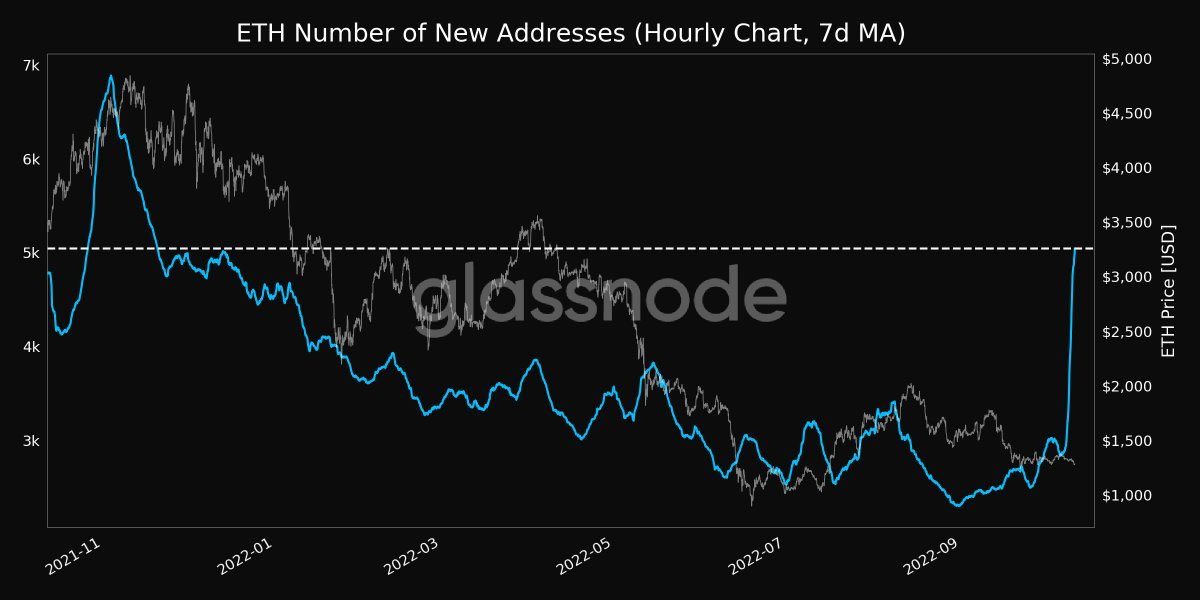
It is also worth mentioning that the number of new addresses for ETH has just reached a 10-month-high. At the time, the ETH price was very close to its all-time high. This shows that interest in the network still remains high despite the downturn in Ethereum price.
XRP Price Prediction: Ripple double top could lead to $0.38 retest
On Sept. 22, XRP price broke out from an ascending parallel channel that had previously been in place since the June 18 lows. The next day, it reached a high of $0.56, a 42% increase in only two days without having anything to do with XRP news.
After a short-term retracement, XRP price created a slightly lower high of $0.55 on Oct. 9. When combined with the aforementioned $0.56 high, this created a double top, which is considered a bearish pattern for Ripple price.
Additionally, the double top was combined with a bearish divergence in the daily RSI (green line). Such divergences often precede bearish trend reversals. The next day, XRP price created a bearish engulfing candlestick, further supporting the possibility of a bearish reversal.
If a downward movement follows, the closest support area would be at $0.44. This is the 0.5 Fib retracement support level and coincides with the resistance line of the previous channel.
If the area fails to support the price of XRP, the next closest support would be at $0.38, created by a horizontal support area and the middle of the channel.
For Be[In]Crypto’s latest Bitcoin (BTC) analysis, click here
Disclaimer: Be[in]Crypto strives to provide accurate and up-to-date information, but it will not be responsible for any missing facts or inaccurate information. You comply and understand that you should use any of this information at your own risk. Cryptocurrencies are highly volatile financial assets, so research and make your own financial decisions.


