


On Monday, the United States and China agreed to a 90-day tariff relief deal. The announcement triggered renewed optimism across global financial markets, with crypto markets also benefiting from the sentiment shift.
However, this translated to just $5 million in net inflows into the Bitcoin ETF market, its lowest single-day total inflow since April 14.
Profit-Taking Slows Bitcoin ETF Demand
As trading activity rocketed on Monday, BTC soared to an intraday high of $105,819. However, profit-taking soon followed, causing the leading coin to shed some of its gains and close at $102,729.
The dip below the psychologically significant $105,000 threshold dampened institutional enthusiasm, discouraging large capital inflows into spot Bitcoin ETFs. As a result, net inflows into the ETF market stalled at just $5.2 million on Monday, representing the lowest single-day total inflow since April 14.
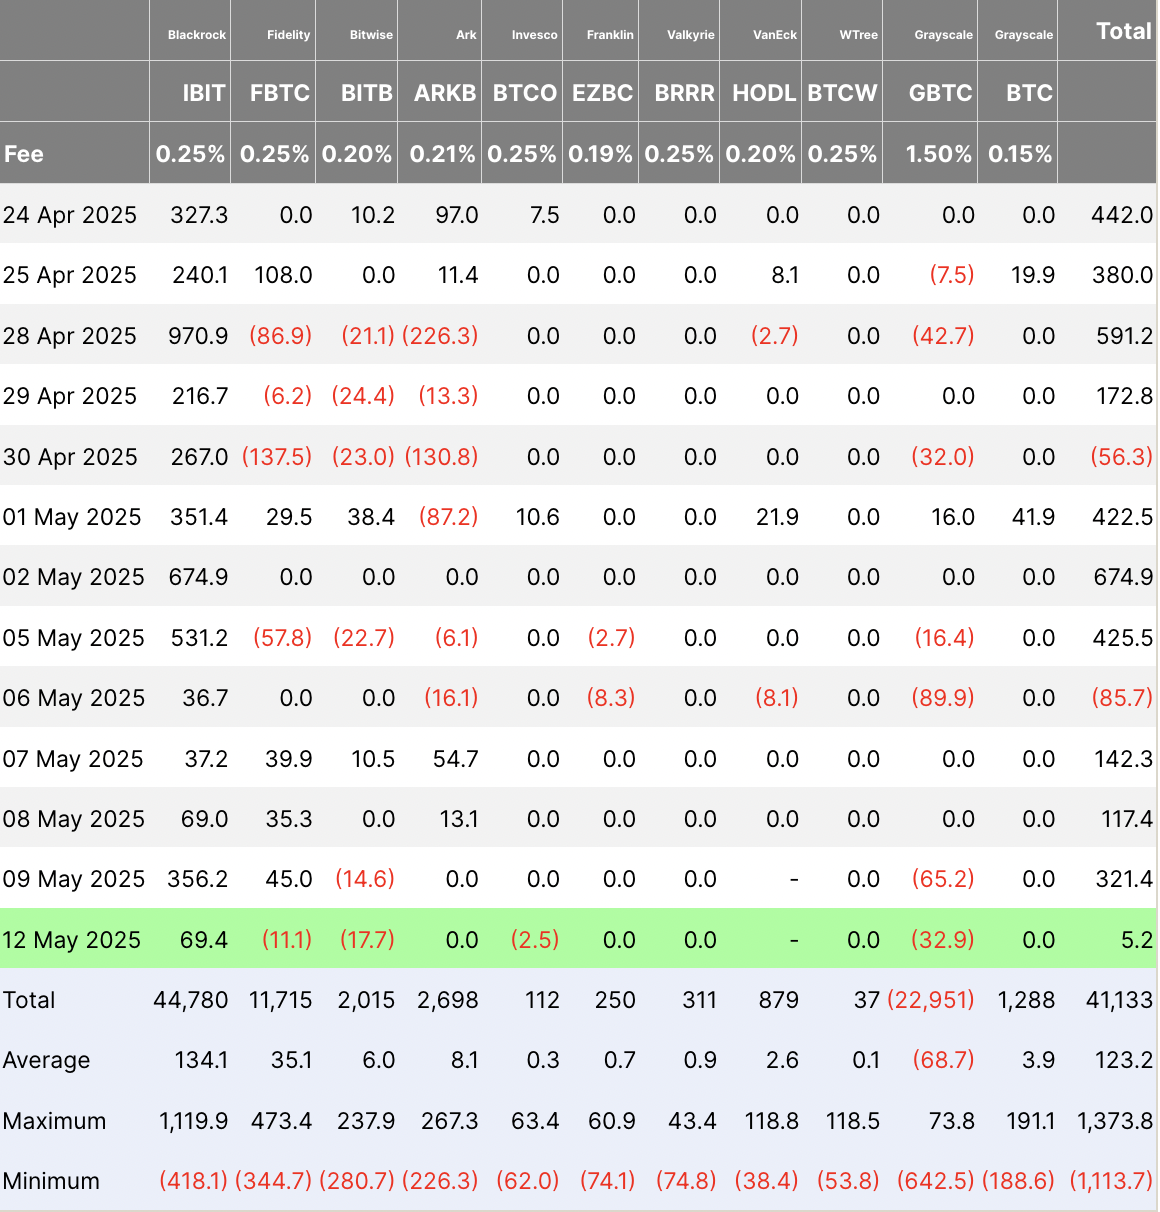
BlackRock’s iShares Bitcoin Trust (IBIT) recorded the highest daily inflow among all issuers. On Monday, the fund’s net inflow was $69.41 million, bringing its total historical net inflow to $44.78 billion.
Meanwhile, Grayscale’s Bitcoin Trust ETF (GBTC) recorded the highest net outflow among all issuers on Monday, with $32.92 million leaving the fund. GBTC’s total historical net inflows stand at $22.95 billion as of this writing.
The pullback signals that institutional investors may be holding back until BTC reclaims or stabilizes above key resistance levels.
Bitcoin Cools Off After Brief Surge to $105,000
At press time, BTC trades at $102,367, down 2% over the past 24 hours. On Monday, the coin briefly surged to a three-month high of $105,819 following the US-China trade agreement news. However, the rally was short-lived, as profit-taking by traders triggered a pullback, causing BTC to close below the psychological $105,000 price mark.
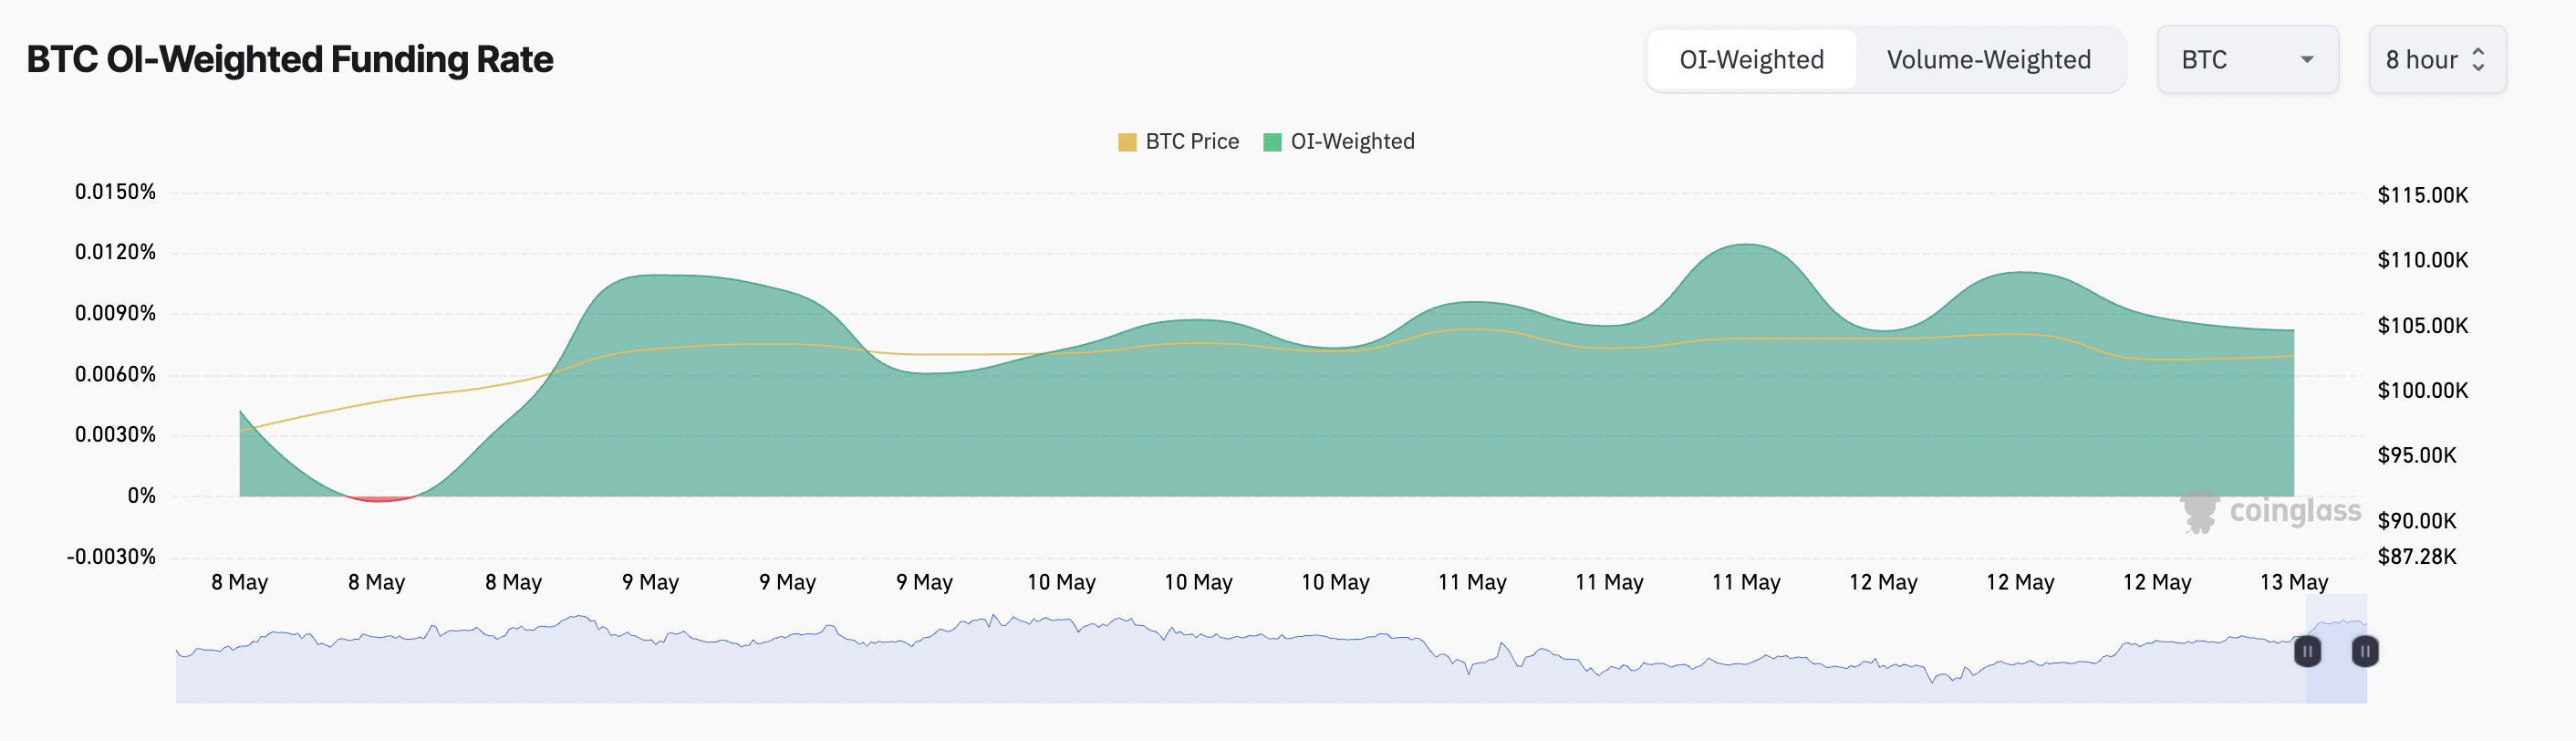
While the dip signals near-term selling pressure, market sentiment remains optimistic. This is reflected by BTC’s funding rate, which remains positive, suggesting that traders continue to bet on a sustained rally, despite the temporary retreat.
Moreover, a look at the BTC liquidation heatmap reveals a significant concentration of liquidity around the $105,337 level.
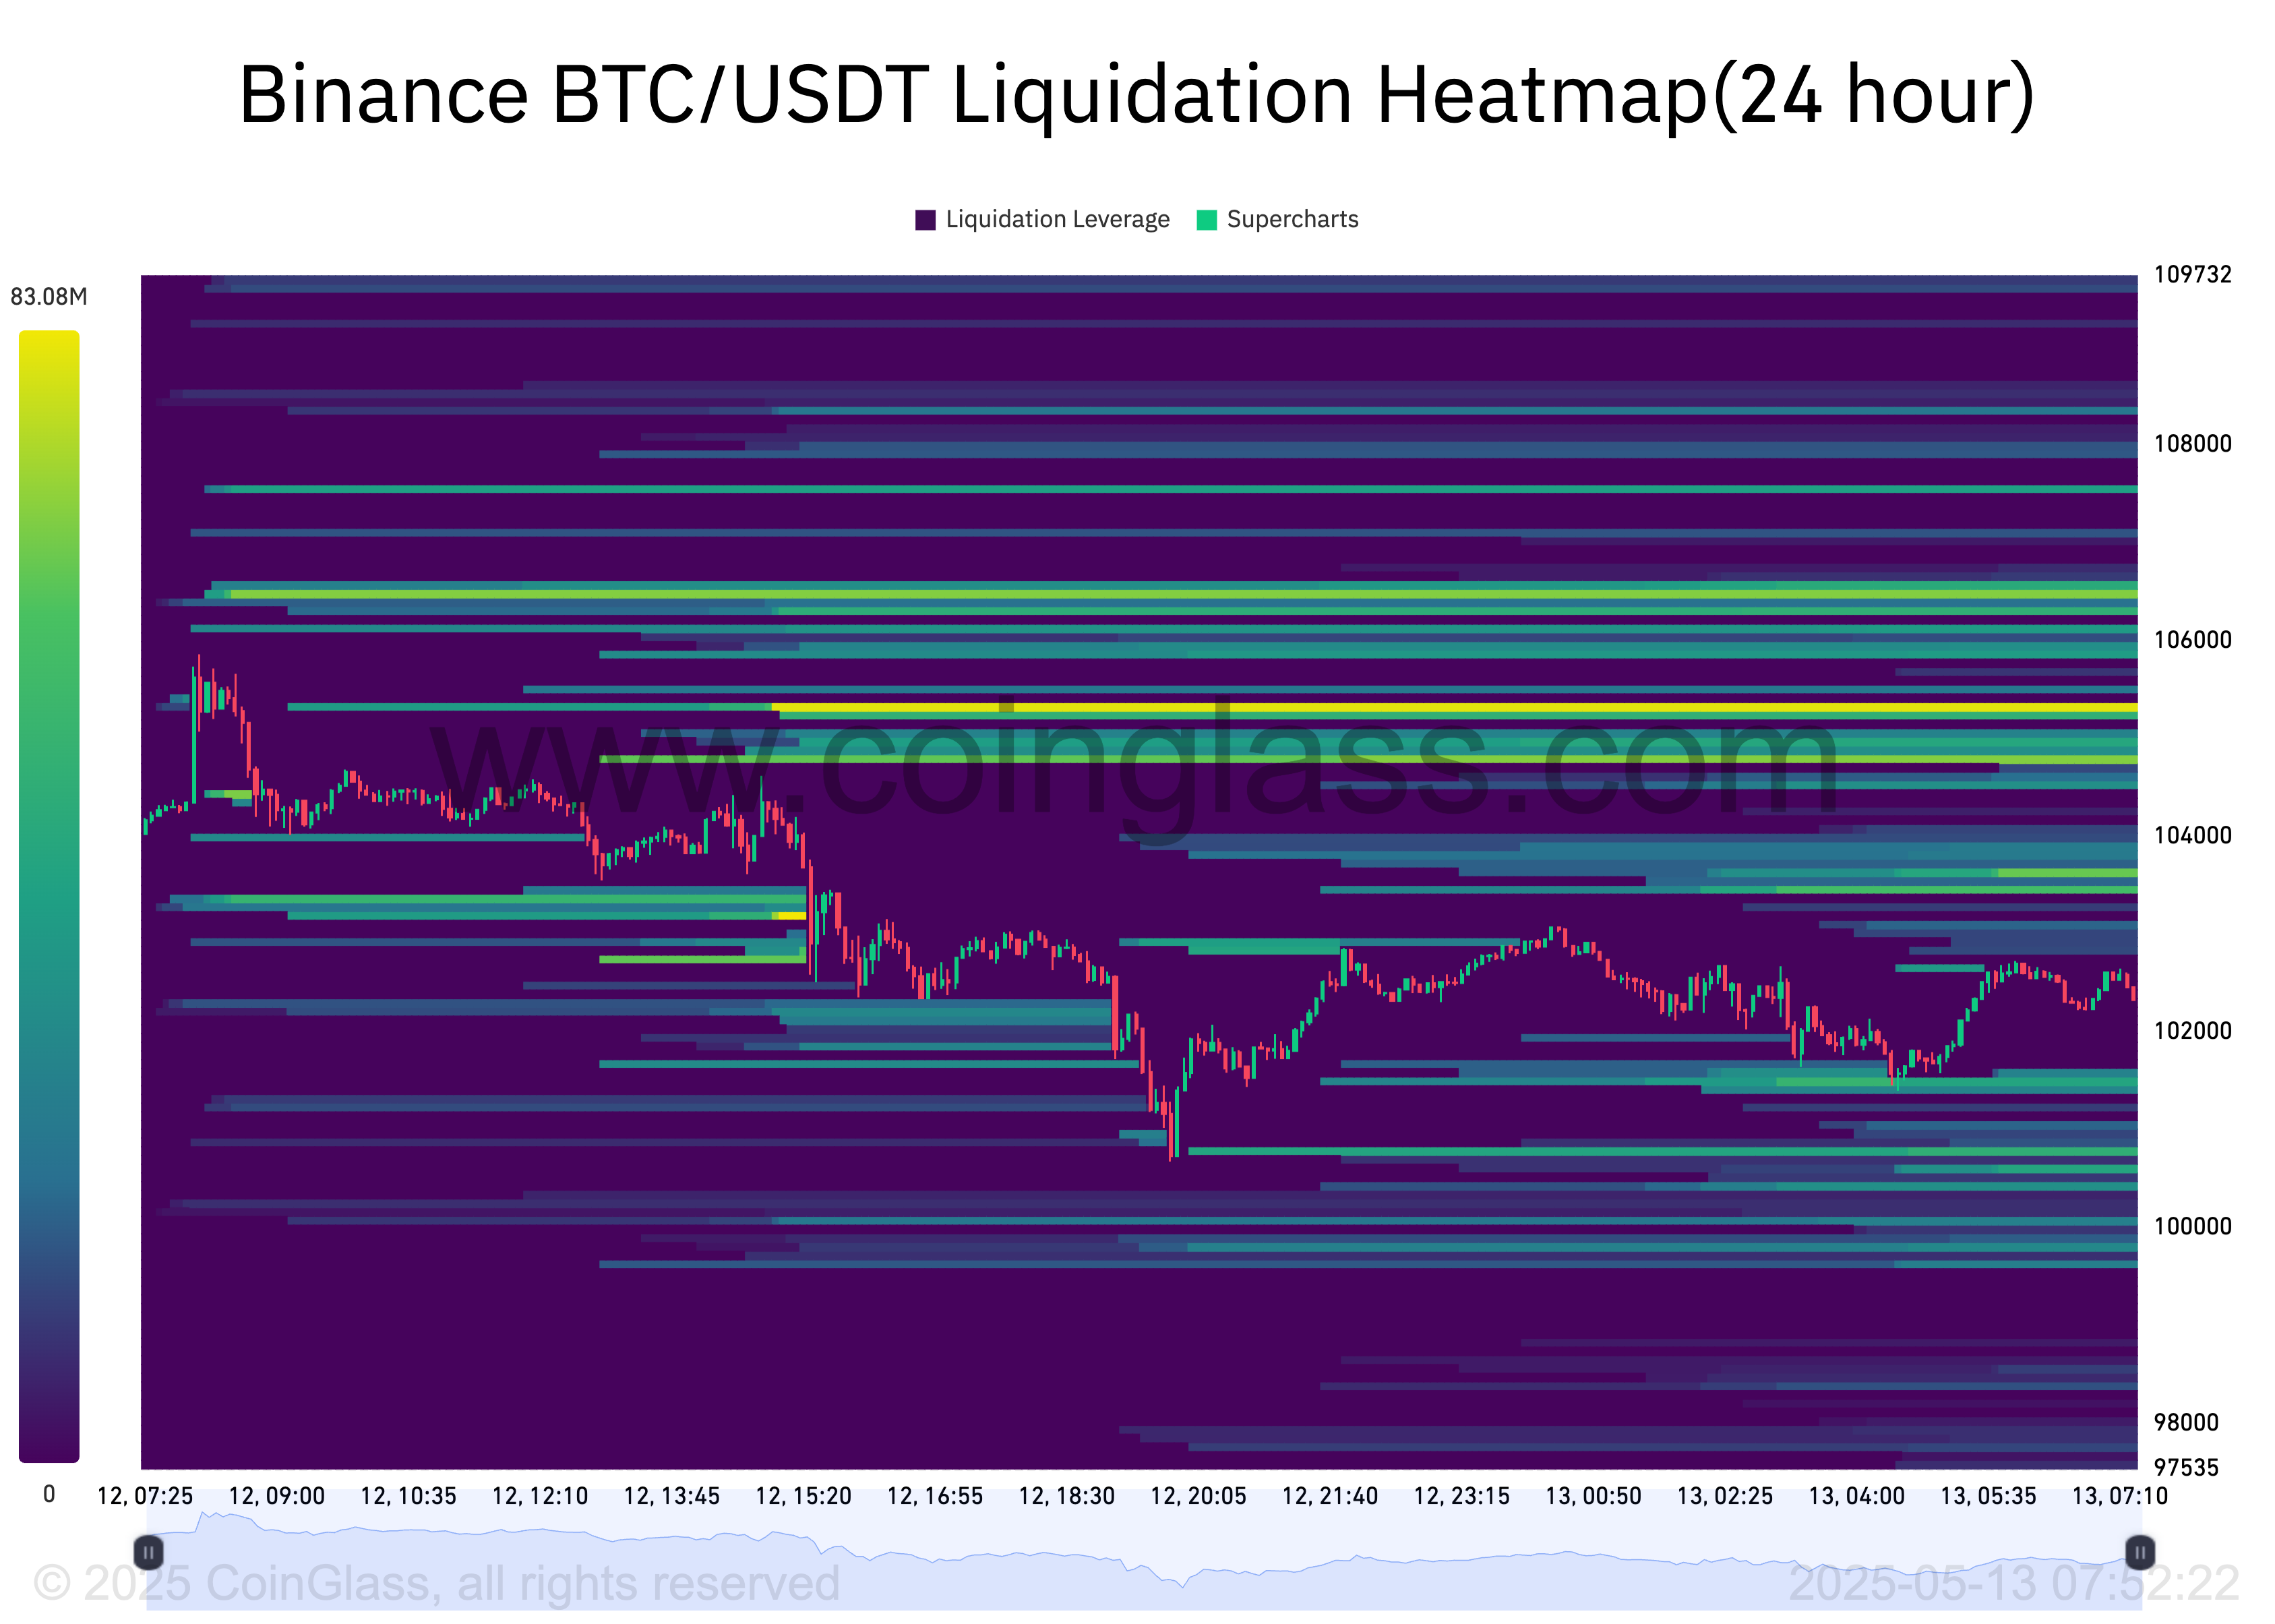
The heatmap highlights potential price zones where large-scale liquidations could occur, providing traders insight into high-liquidity areas.
These zones, marked in yellow, indicate that if BTC resumes its upward momentum, it could potentially breach the $105,000 level, assuming the current bullish setup holds. In such a scenario, traders holding short positions could face a short squeeze.


