


Bitcoin ETFs are gaining momentum, with reports indicating up to $105 million in positive flows on Monday. This brings the cumulative inflows to nearly $2.40 billion in the last three weeks.
Experts ascribe the inflows to increased global liquidity, which can boost the Bitcoin price by improving market sentiment.
Bitcoin ETFs Demand Returns with $105 Million Inflows on Monday
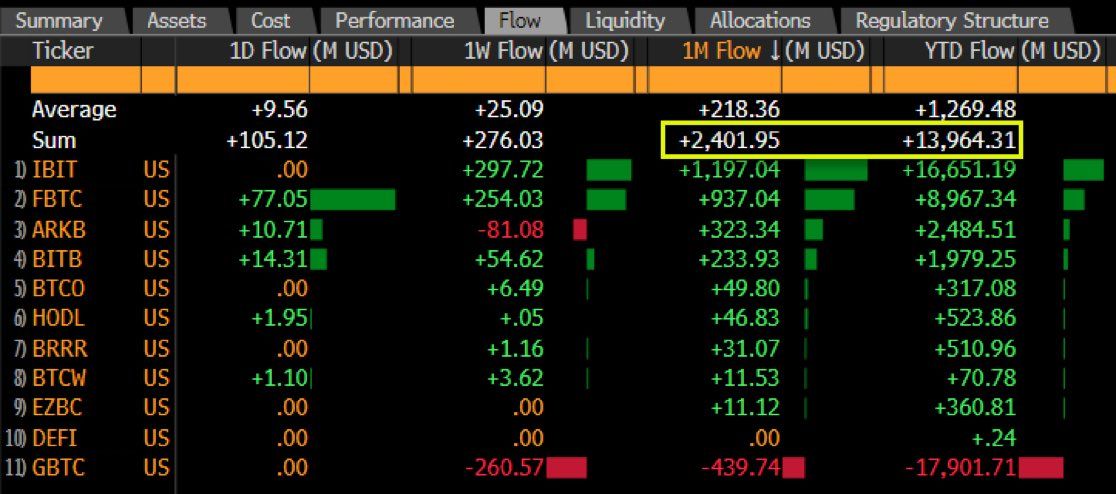
Bitcoin ETFs market rebound continues to strengthen, with reports showing $105 million inflows on June 3. This marks 15 consecutive trading days (three weeks) of positive flows and brings the cumulative inflows to $2.40 billion, as the on-chain data platform SpotOnChain shows.
Fidelity took the day with its Bitcoin ETF, FBTC, recording up to $77 million (over 1,110 BTC) in inflows on Monday. Meanwhile, Grayscale’s GBTC and BlackRock’s IBIT recorded zero net flows the same day. Bitwise ETF, BITB, recorded $14 million in inflows, while Ark21Shares’ ARKB ETF saw up to $10 million in positive flows.
Read more: How To Trade a Bitcoin ETF: A Step-by-Step Approach
The spike in inflows coincides with an increase in global liquidity. Bitcoin analyst Willy Woo highlights that the relationship between BTC price and M2 expansion reflects broader market sentiment and economic conditions.
A high M2 expansion indicates a loose monetary policy and increased money supply. In response, Bitcoin’s price often rises as investors seek alternative assets for potential returns.
Notably, Bitcoin’s price usually reacts positively to increases in the money supply and inflation concerns. This happens as investors see BTC as a hedge against traditional fiat currencies such as the US dollar, which could depreciate because of inflation.
BTC Price is in the Accumulation Phase
Bitfinex analysts noted in a Monday market update that Bitcoin ETF inflows for the last two weeks have averaged $136M [million] per day. “This is 4x the $32M daily sell pressure from miners,” they said, observing that Bitcoin is in an accumulation period.
The analysts also highlighted that the correction phase could be nearing its end. They ascribed the recent drop from $73,777 to selling activity among long-term holders. The report indicates that long-term holders have started to re-accumulate BTC for the first time since December 2023.
Investor confidence has risen since the April 20 Bitcoin halving, reinforcing the bullish thesis. This can be seen in the surge in Bitcoin’s realized capitalization, approaching $600 billion.
Also Read: Bitcoin Halving Cycles and Investment Strategies: What To Know
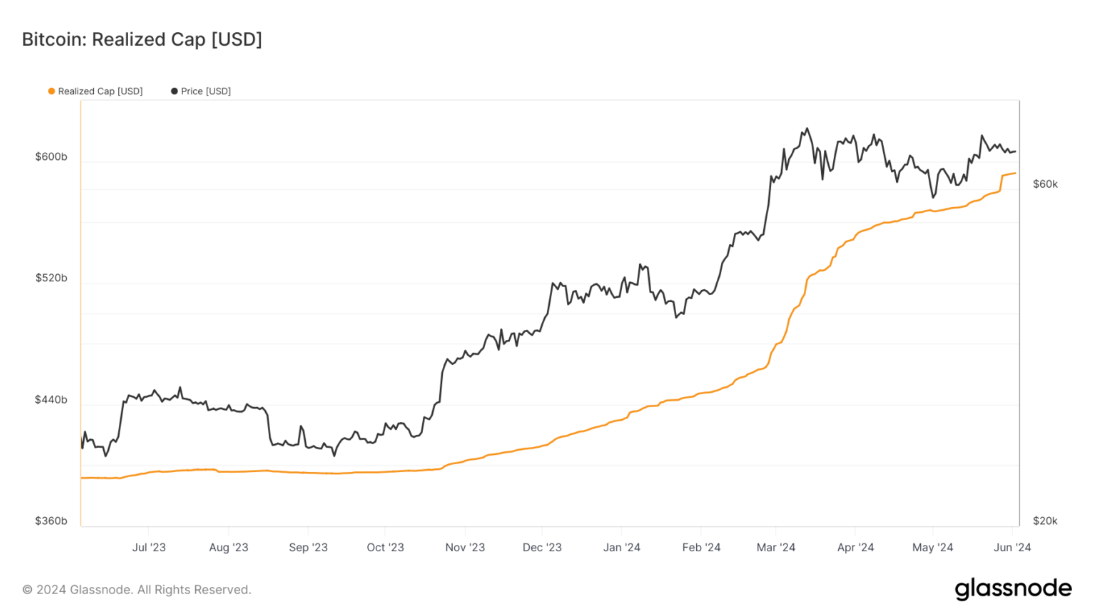
The BTC Realized Cap metric shows Bitcoin’s true value based on the price at which coins last moved. It provides a unique perspective on market dynamics, investor behavior, and historical trends within the Bitcoin ecosystem.
Bitcoin Dynamics Outlook Amid Shifting Investor Sentiment
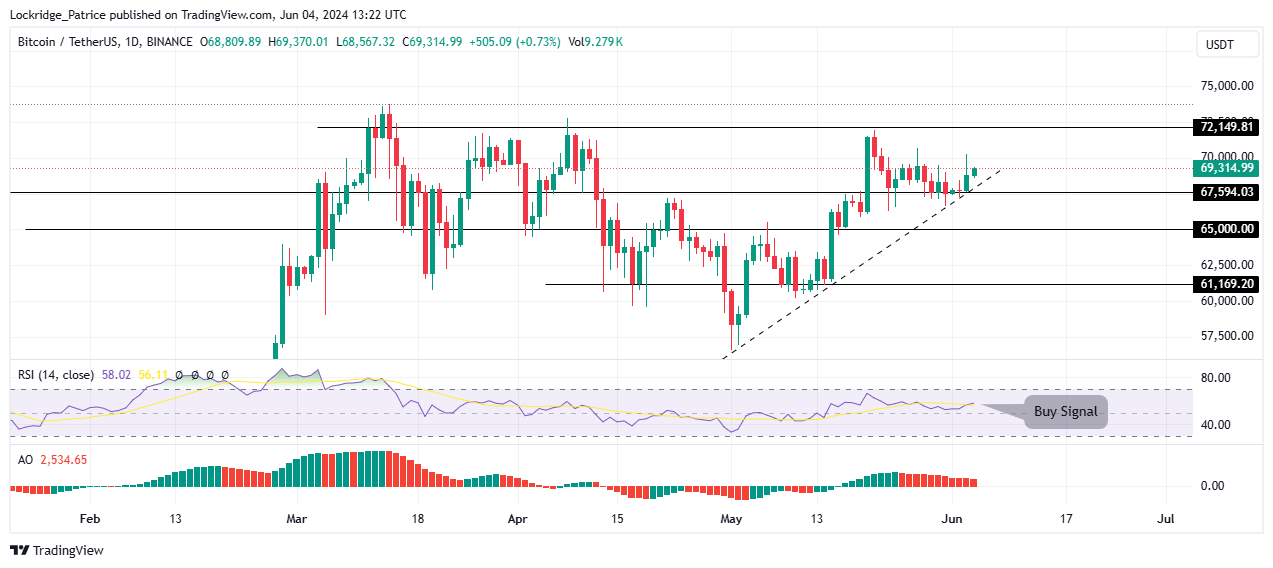
The Bitcoin price has continued to consolidate along an ascending trend line since May 1, with a series of higher lows. Standing 22% above the range low of $56,552, BTC looks primed for more gains as it attempts to break consolidation.
Tailwinds sprout from a buy signal executed when the Relative Strength Index (RSI) crosses above the signal line (yellow band). Traders heeding this call could see Bitcoin’s price head north. The Awesome Oscillator’s position in positive territory reveals bullish sentiment, adding credence to the bullish thesis.
On the flip side, the volume profile shows that while there is a lot of bullish activity (orange nodes) waiting to interact with Bitcoin price at current levels, there is even more bearish activity (grey nodes). With this, the bulls must haul BTC above the $72,149 threshold for Bitcoin price to escape the thicket.
Read more: Bitcoin (BTC) Price Prediction 2024/2025/2030
A drop below $67,594 could trigger panic selling, potentially pushing the price down to $65,000. If that level doesn’t hold, Bitcoin could revisit the $61,169 support level, presenting a potential buying opportunity for investors.
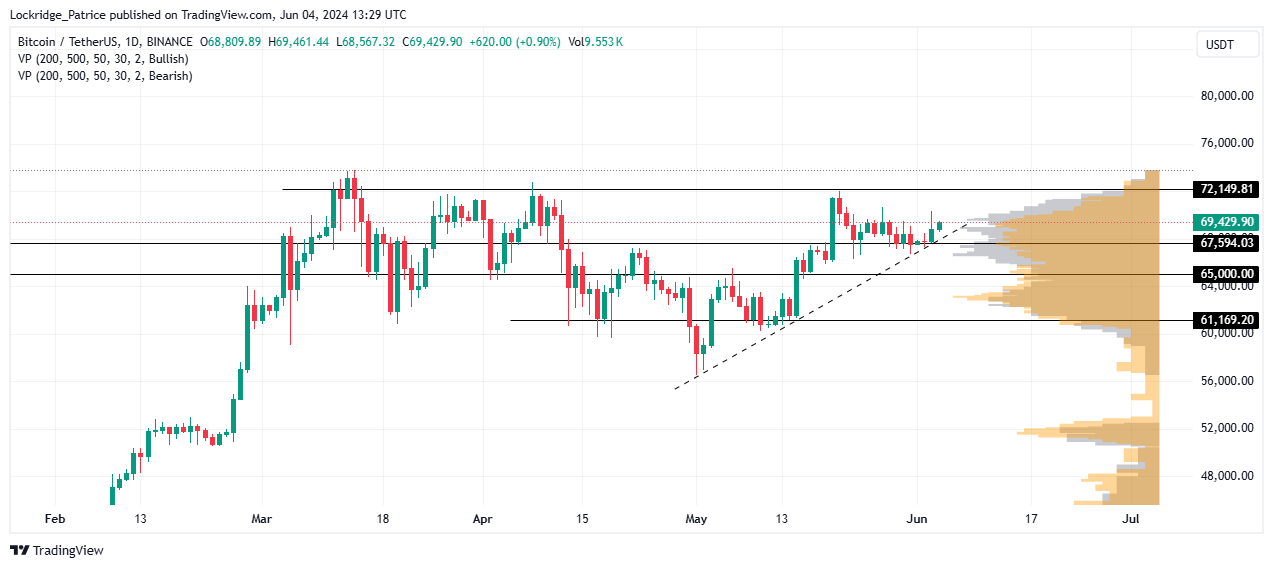
In a dire case where bearish momentum abounds, a candlestick close below $56,000 would invalidate the bullish outlook. At the time of writing, Bitcoin price is trading at $69,429.


