
On Aug 17, the Bitcoin (BTC) price created a bullish engulfing candlestick and broke out above its previous high.
While the breakout looks legitimate, it is not yet clear if there is enough buying power for BTC to continue making higher-highs.
Bitcoin’s Questionable Breakout
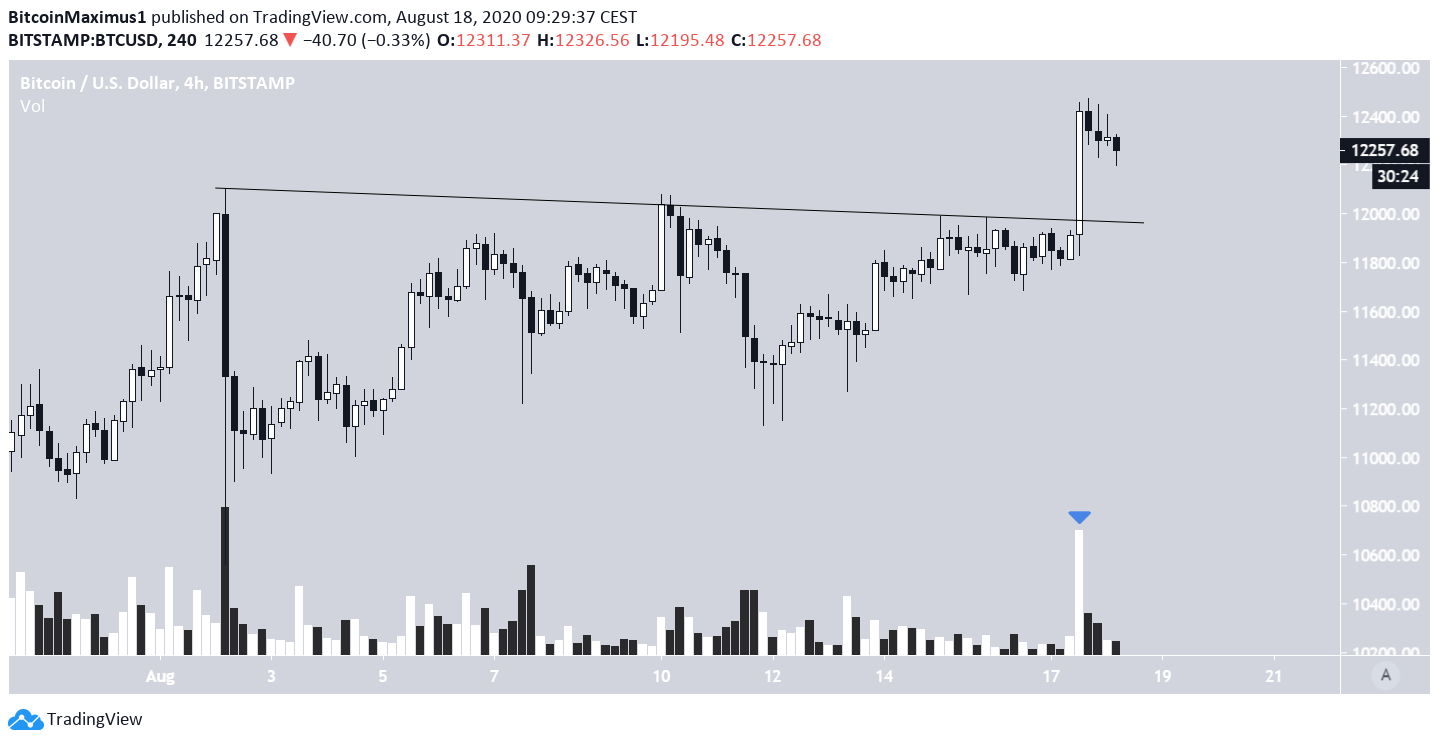
On Aug 2, the Bitcoin price reached a high of $12,123 but dropped sharply the same day. Since then, the $12,000 area has been acting as resistance, thwarting multiple attempts at a breakout since. Yesterday, the Bitcoin price created a bullish engulfing candlestick and was finally successful in breaking out and closing over $12,000. In the future, the same area is expected to act as support. Technical indicators are providing mixed signals. There is a bearish divergence in the daily RSI, and volume has been very low during the breakout. On the bullish side, the MACD has shown a bullish reversal signal and has nearly turned positive.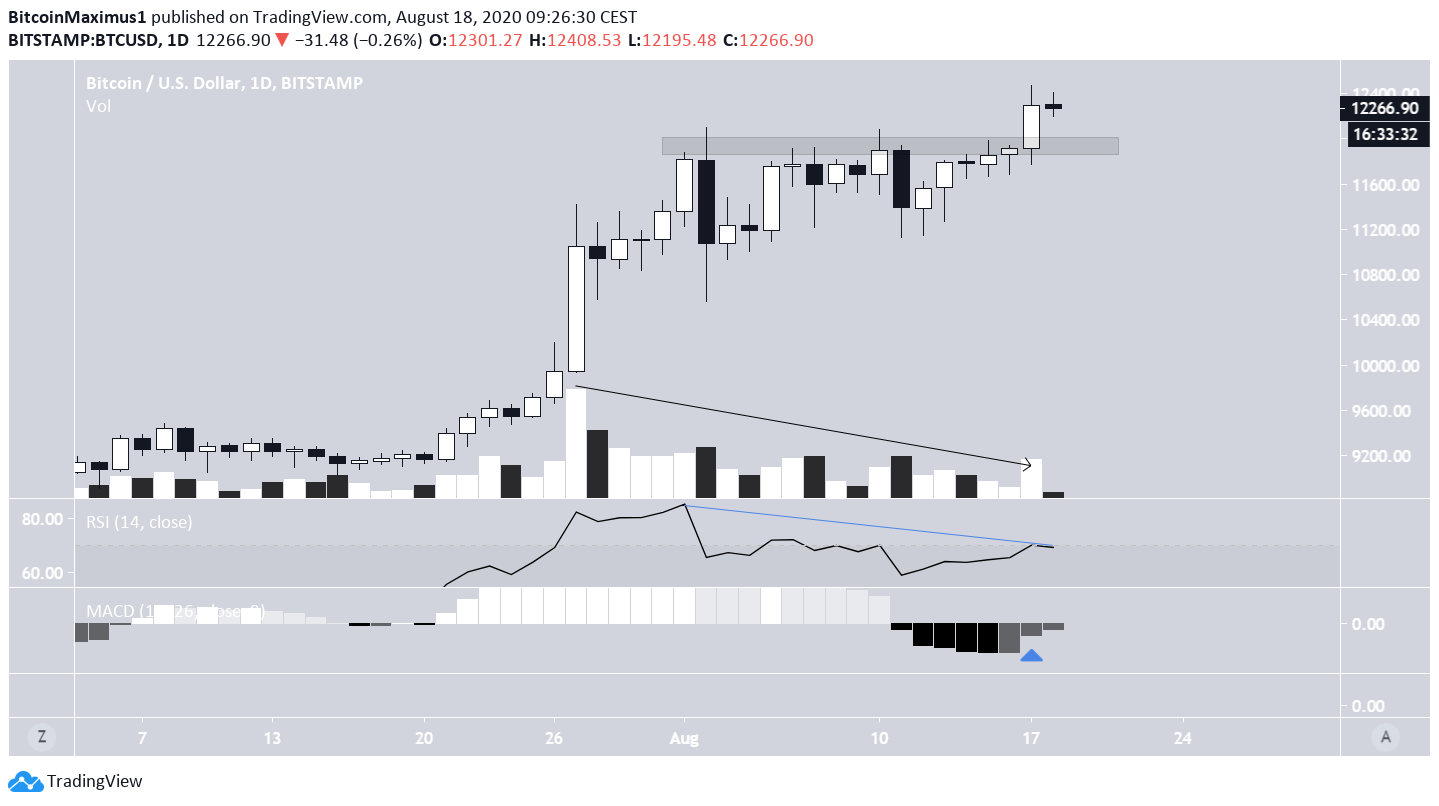
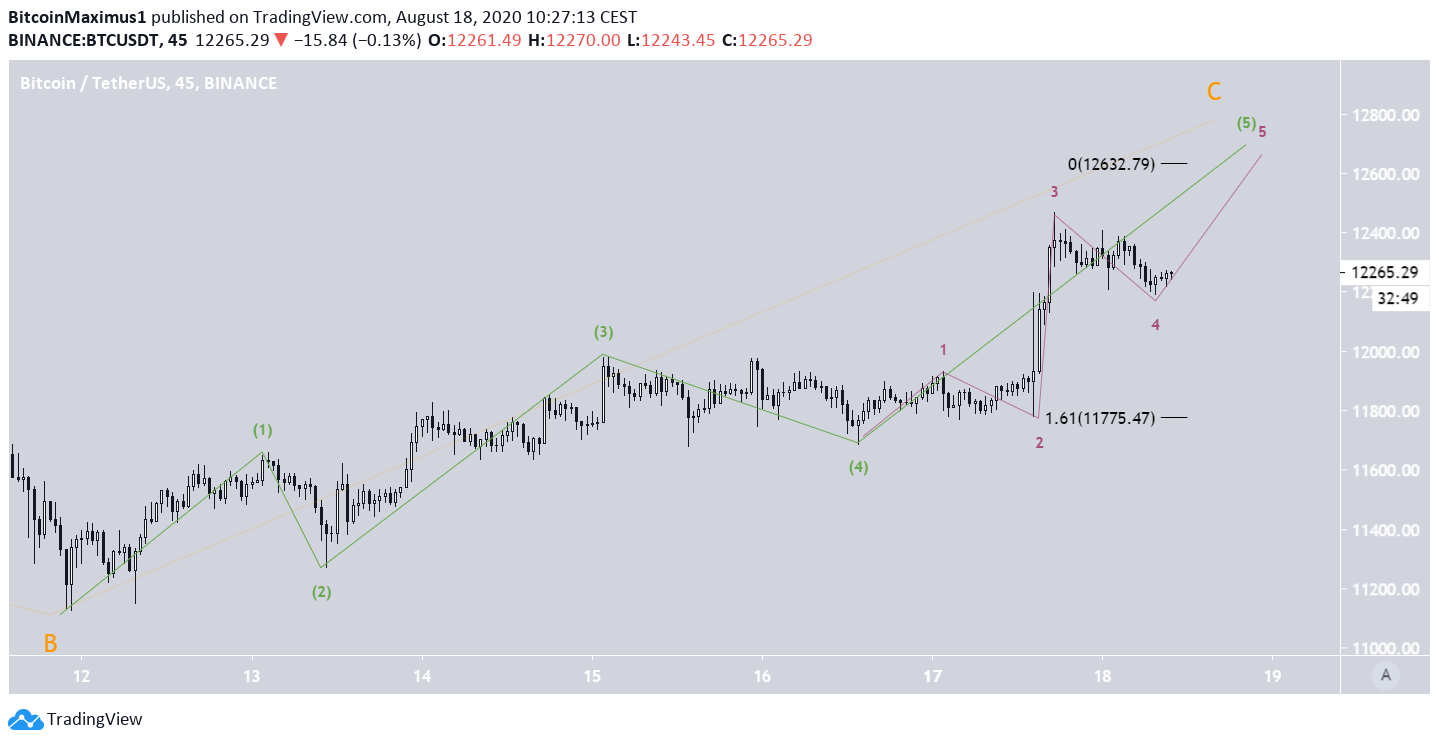
Wave Count
Since the August 2 breakdown, the price has been making higher lows. However, due to the considerable overlap and sub-wave formation, it’s possible that the upward movement is corrective rather than impulsive. If so, the price is still in a B wave (blue), that is transpiring with an A-B-C sub-wave formation (orange). The most likely high for the C wave would be found near $12,550. The high is found by projecting the length of sub-wave A to the bottom of sub-wave B (orange). Furthermore, it is the 1.27 Fib level of the external retracement of wave A (blue)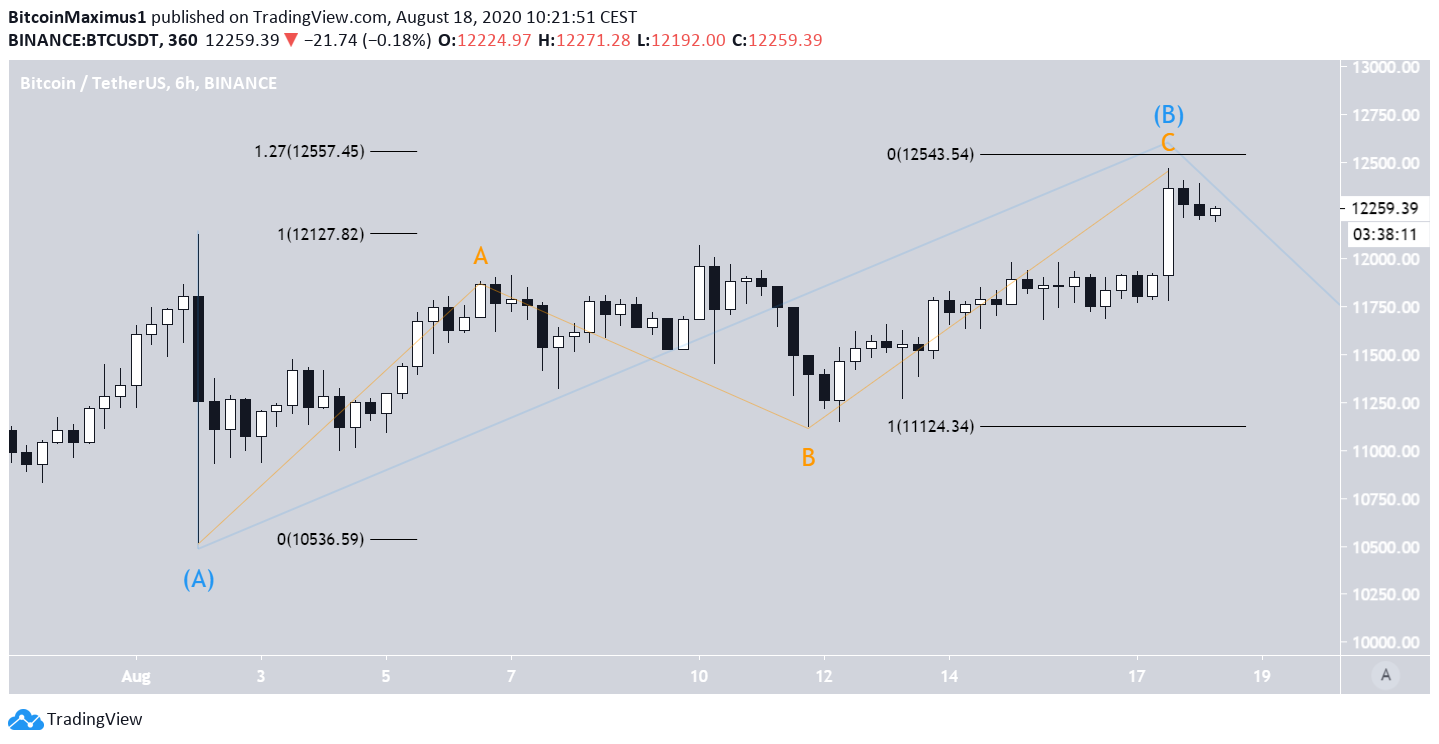
Top crypto platforms in the US
Disclaimer
In line with the Trust Project guidelines, this price analysis article is for informational purposes only and should not be considered financial or investment advice. BeInCrypto is committed to accurate, unbiased reporting, but market conditions are subject to change without notice. Always conduct your own research and consult with a professional before making any financial decisions. Please note that our Terms and Conditions, Privacy Policy, and Disclaimers have been updated.

Valdrin Tahiri
Valdrin discovered cryptocurrencies while he was getting his MSc in Financial Markets from the Barcelona School of Economics. Shortly after graduating, he began writing for several different cryptocurrency related websites as a freelancer before eventually taking on the role of BeInCrypto's Senior Analyst.
(I do not have a discord and will not contact you first there. Beware of scammers)
READ FULL BIO
Sponsored
Sponsored