


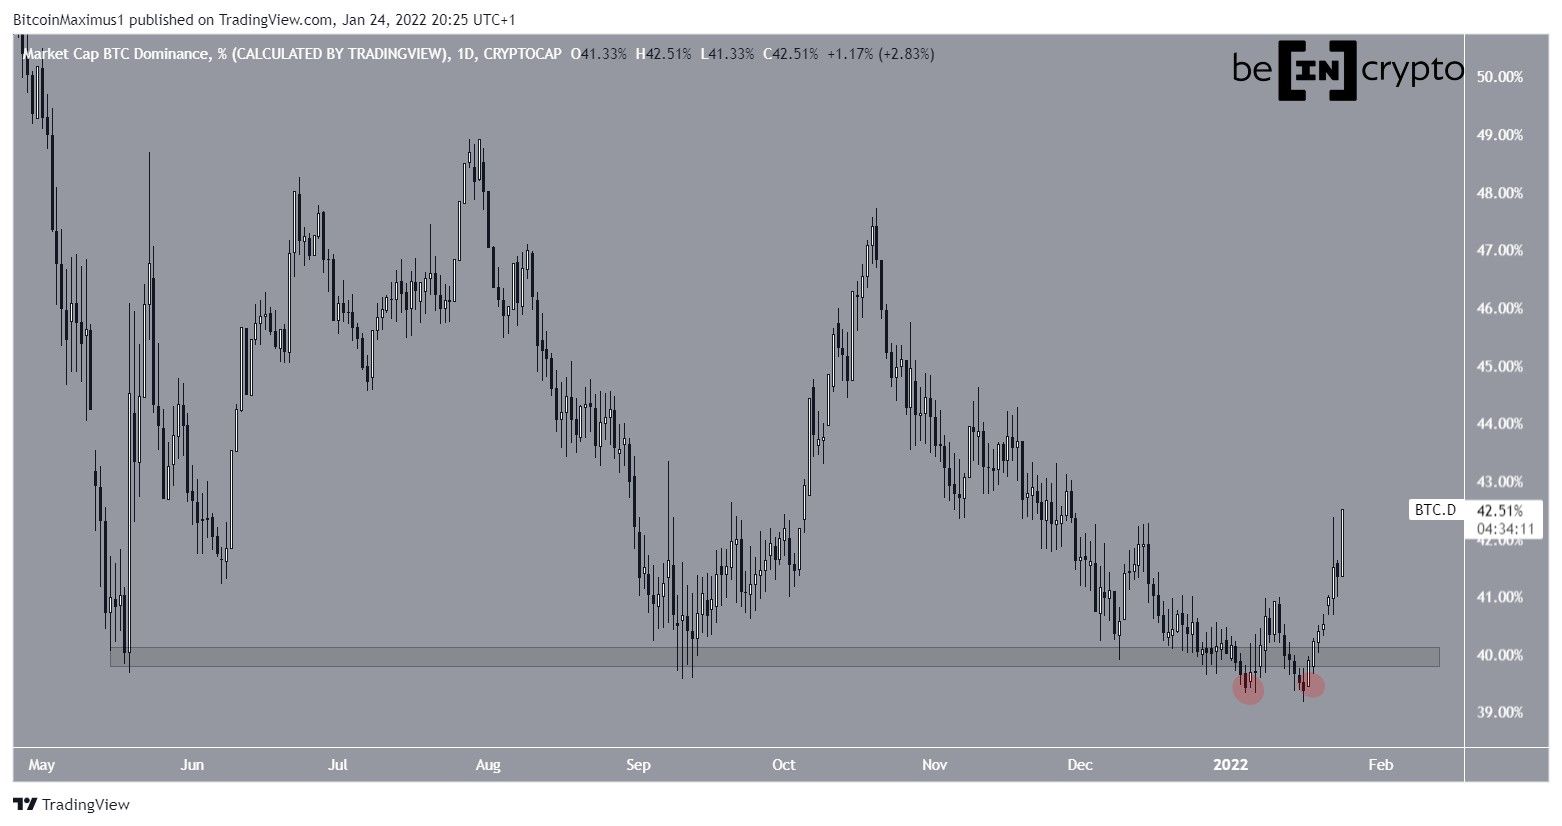
The Bitcoin dominance rate (BTCD) has been moving upwards since Jan 16 and has reclaimed a crucial horizontal area in the process.
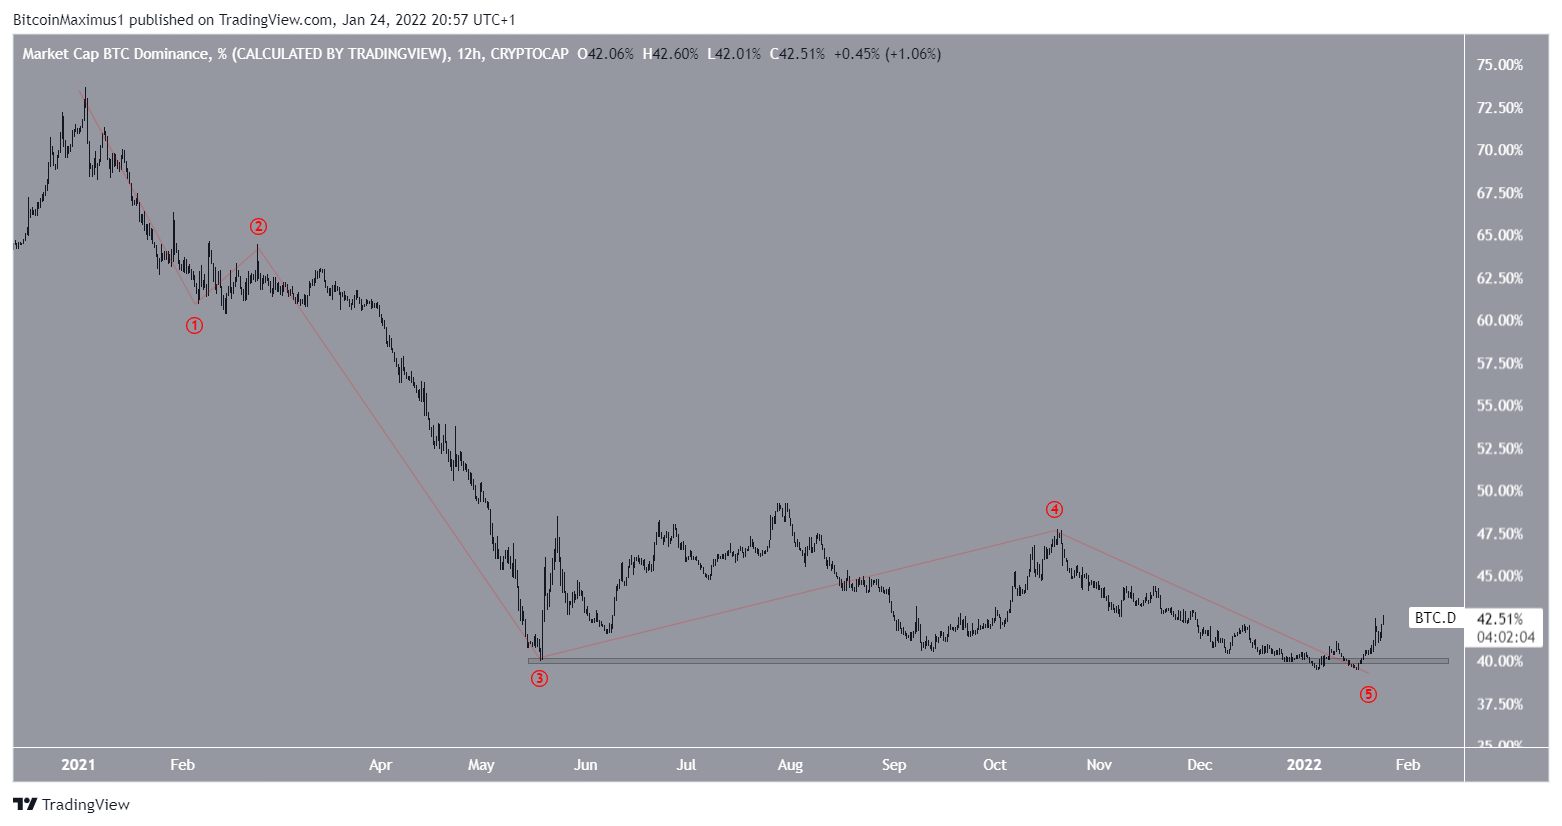
Since May 18, 2021, Bitcoin dominance had been trending above the 40% horizontal support area. The area has supported the BTCD multiple times since then. A rebound from this support led to a local high of 47.72% on Oct 20, but it started to slip immediately after.
At the beginning of 2022, the BTCD deviated slightly below this support area on two occasions (red circles) before reclaiming the level on Jan 21.
Future BTCD movement
Cryptocurrency trader @eliz883 tweeted a BTCD chart, stating that the current bounce could precede a significant upward move.
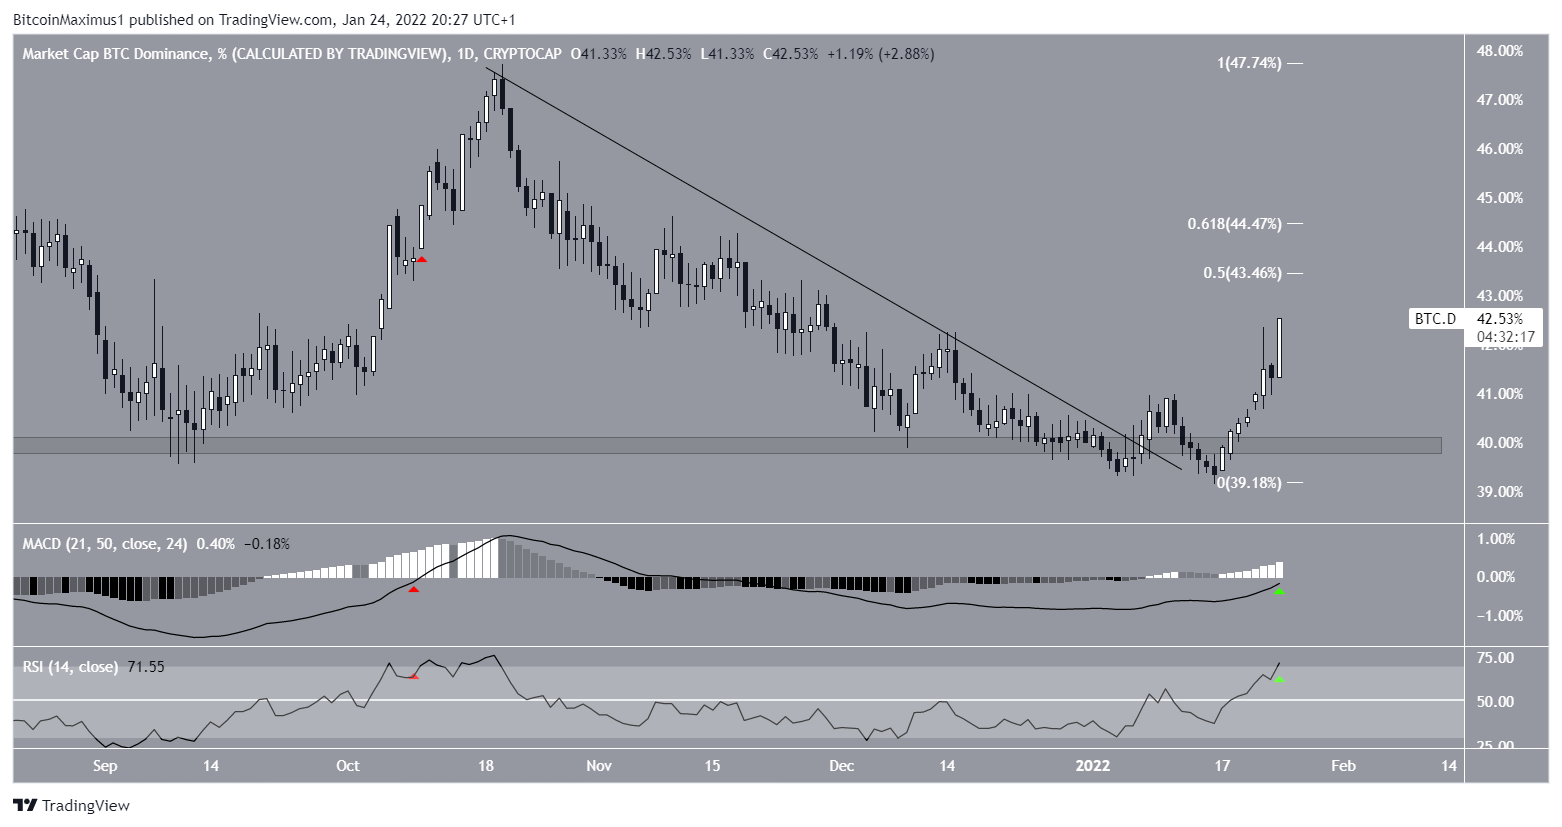
The bounce transpired after BTCD broke out from a descending resistance line that had been in place since the aforementioned 47.72% high. It greatly accelerated on Jan 24, creating a large bullish candlestick.
BTCD is now approaching the 0.5-0.618 Fib retracement resistance area, found between 43.45%-44.45%.
Technical indicators are bullish since both the RSI and MACD are increasing (green icons). The RSI is a momentum indicator, and values above 50 are considered bullish. Currently, it’s close to moving above 70. Similarly, the MACD, which is created by short and long-term moving averages (MA), is nearly positive.
While both of these are considered bullish developments, it’s worth mentioning that the previous time these indicators had these values (red icons), BTCD was very close to its 47.72% top, which coincided with the top of the descending resistance line.
Therefore, while it seems likely that BTCD will be able to move back into the 43.45%-44.45% area, it could still potentially get rejected once it reaches the zone.
Long-term structure
The weekly chart shows that the 40% support area is the last line of defense prior to a potential new all-time low. A breakdown below it could be the catalyst for a sharp fall.
Both the MACD and RSI have generated considerable bullish divergences (green line). This suggests that an upward move is likely to follow.
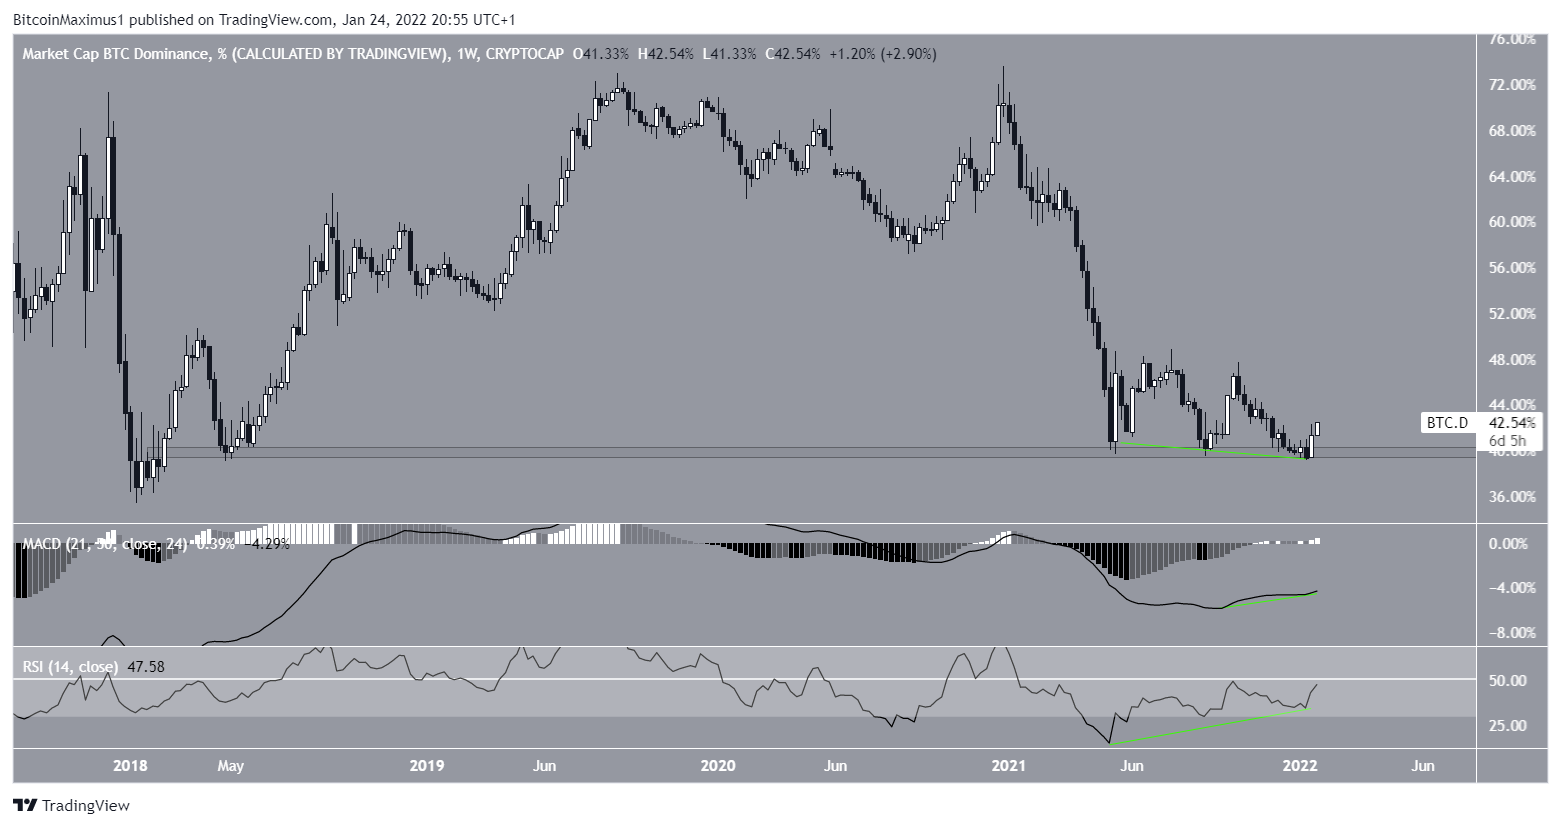
Finally, when measuring from the 2021 high, there is a clear five-wave downward pattern that has already been completed. While there is the possibility that wave five will extend, the structure looks complete as is.
Therefore, when combining these with the readings from the daily time frame, an eventual breakout from the 43.45%-44.45% area seems to be the most plausible scenario.
For BeInCrypto’s latest Bitcoin (BTC) analysis, click here.


