
The Bitcoin dominance rate (BTCD) is trading at a long-term ascending support line that has been in place since the beginning of February.
Technical indicators suggest that the BTCD will break down from this line.
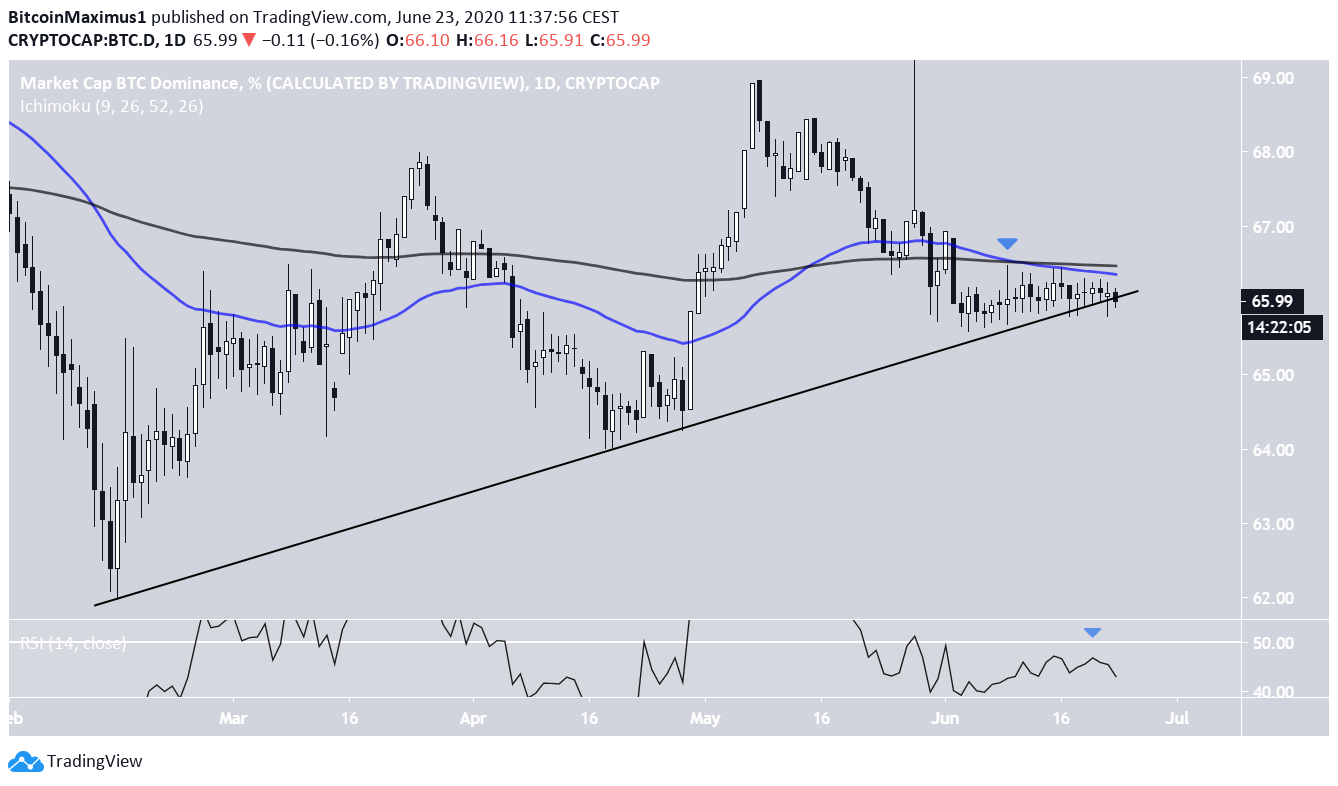
Ascending Bitcoin Support Line
The Bitcoin dominance rate has been following an ascending support line since Feb 14. At the time of press, it was trading on top of his support line and has been clinging to it since June 1. The fact that the rate has been touching the support line so many times but has yet to initiate a bounce makes a breakdown more likely.
Furthermore, a bearish cross has transpired between the 50 and 200-day MAs, a sign that a bearish trend has begun. Both MAs are sitting just above the trading range and offering resistance to the rate. The fact that the cross is transpiring after a previous failed bullish cross makes a breakdown even more likely.
Finally, the daily RSI failed to even reach the 50-line and is moving downwards.
Well-known trader @damskotrades stated that he is cautious with his altcoin plays because of the fact that the Bitcoin dominance rate is trading at an important support level, more specifically the ascending support line we just discussed. He gave three main observations:
I’m cautious with my Altcoin plays.
– Less risk per trade
– Less Altcoin set ups open in the long category at the same time.
– Focus on higher time frame levels
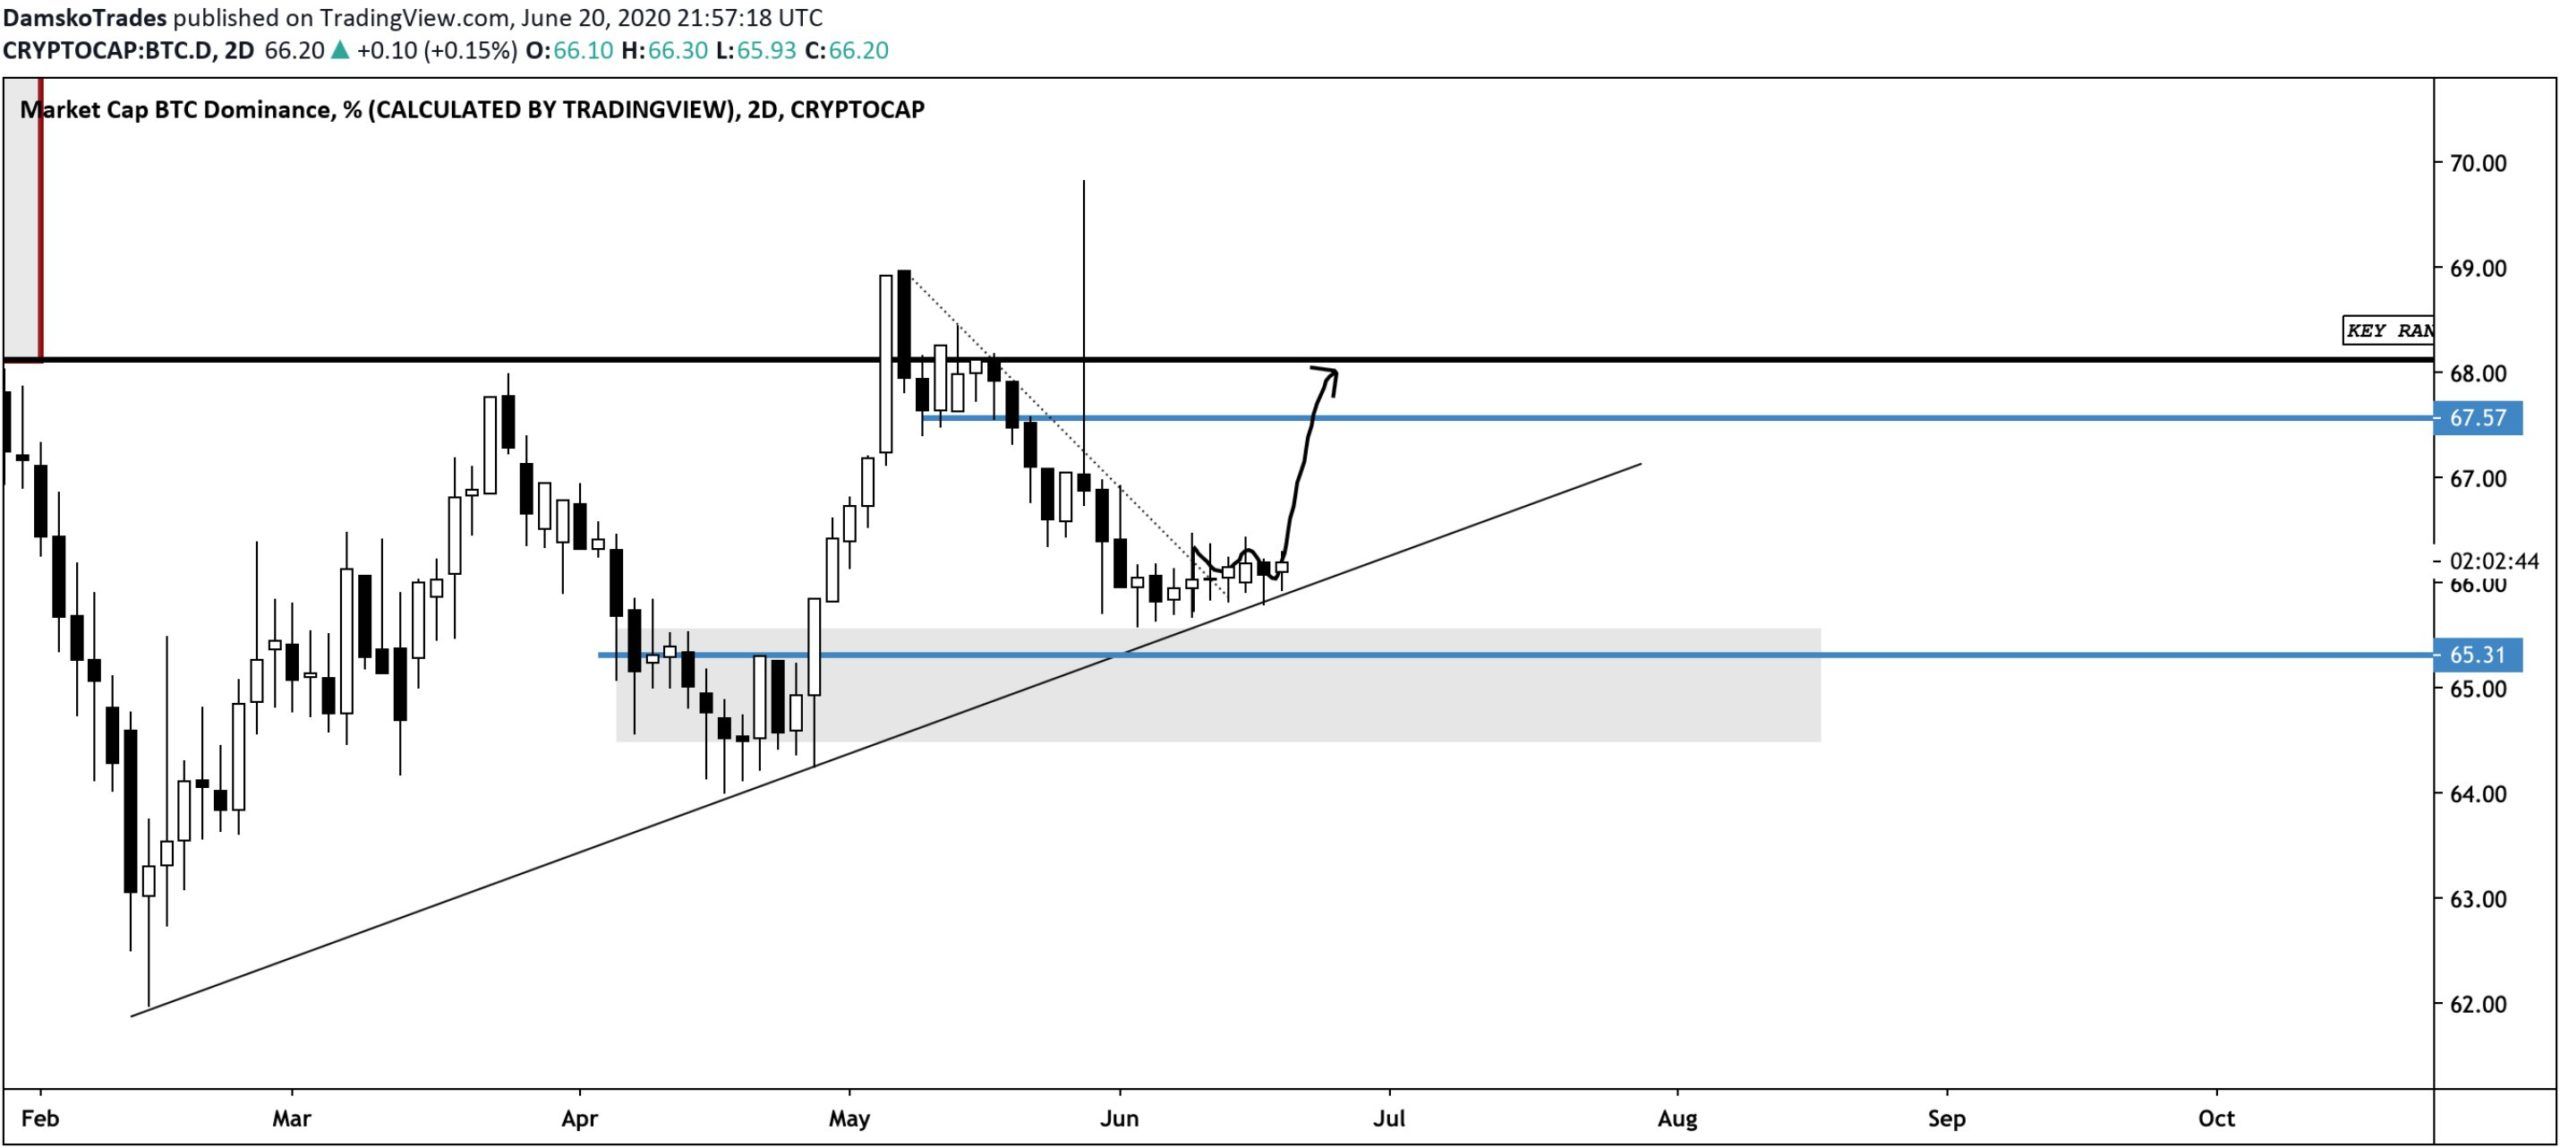
However, due to the reasons discussed above, we believe that it is more likely that BTCD breaks down instead.
Long-Term Resistance
The weekly chart shows that the BTCD has been following a descending resistance line since September 2019. This indicates that even if BTCD were to bounce at the current support line, it would likely find resistance at 67%,
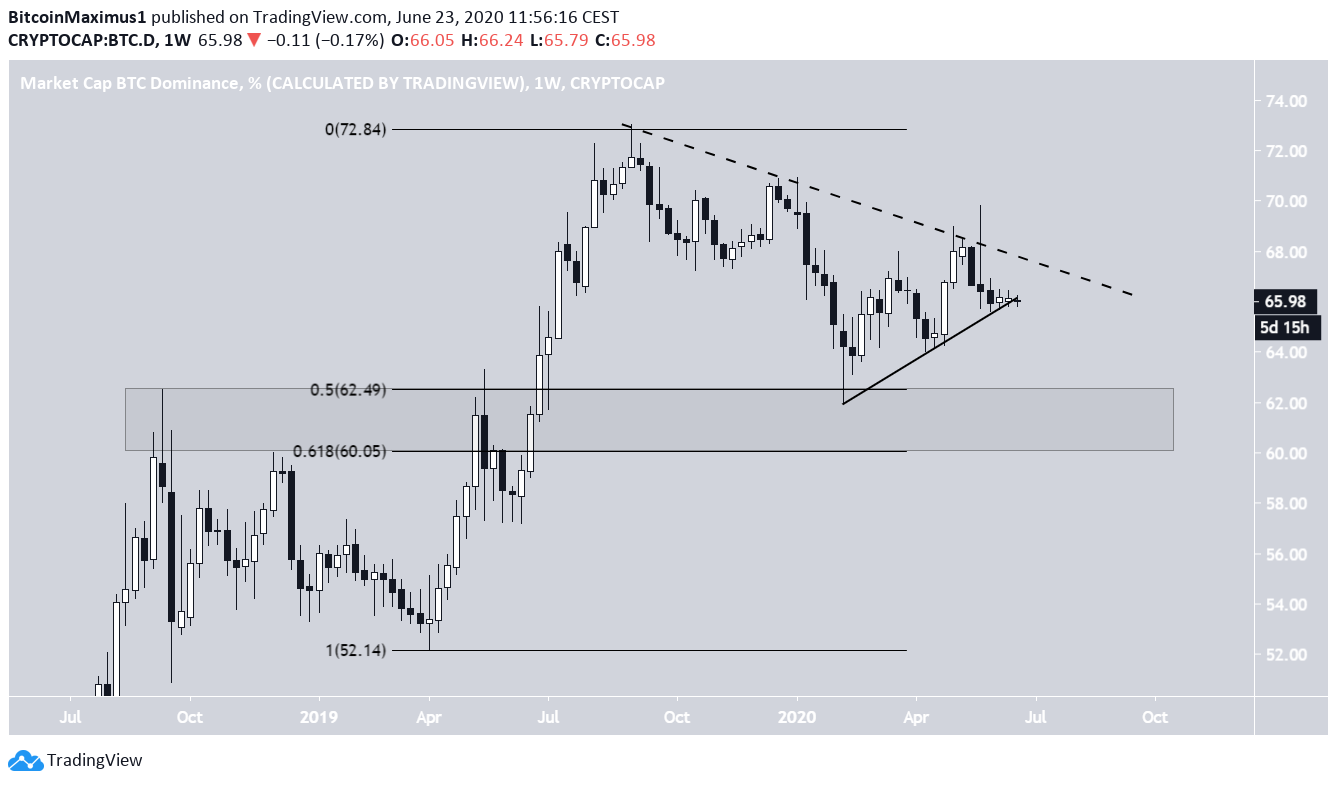
If BTCD were to break down, it is likely to decrease towards the previous resistance area and the 0.5-0.618 Fib levels of this entire upward move, found between 60-62.5%.
To conclude, BTCD is following an ascending support line from which a breakdown is expected. The closest support level is found at 60-62.5%.
