


The Bitcoin Dominance Rate (BTCD) is trading at a confluence of support levels in both the weekly and daily timeframes. If the ongoing upward movement is to continue, the current support level would be expected to initiate a bounce.
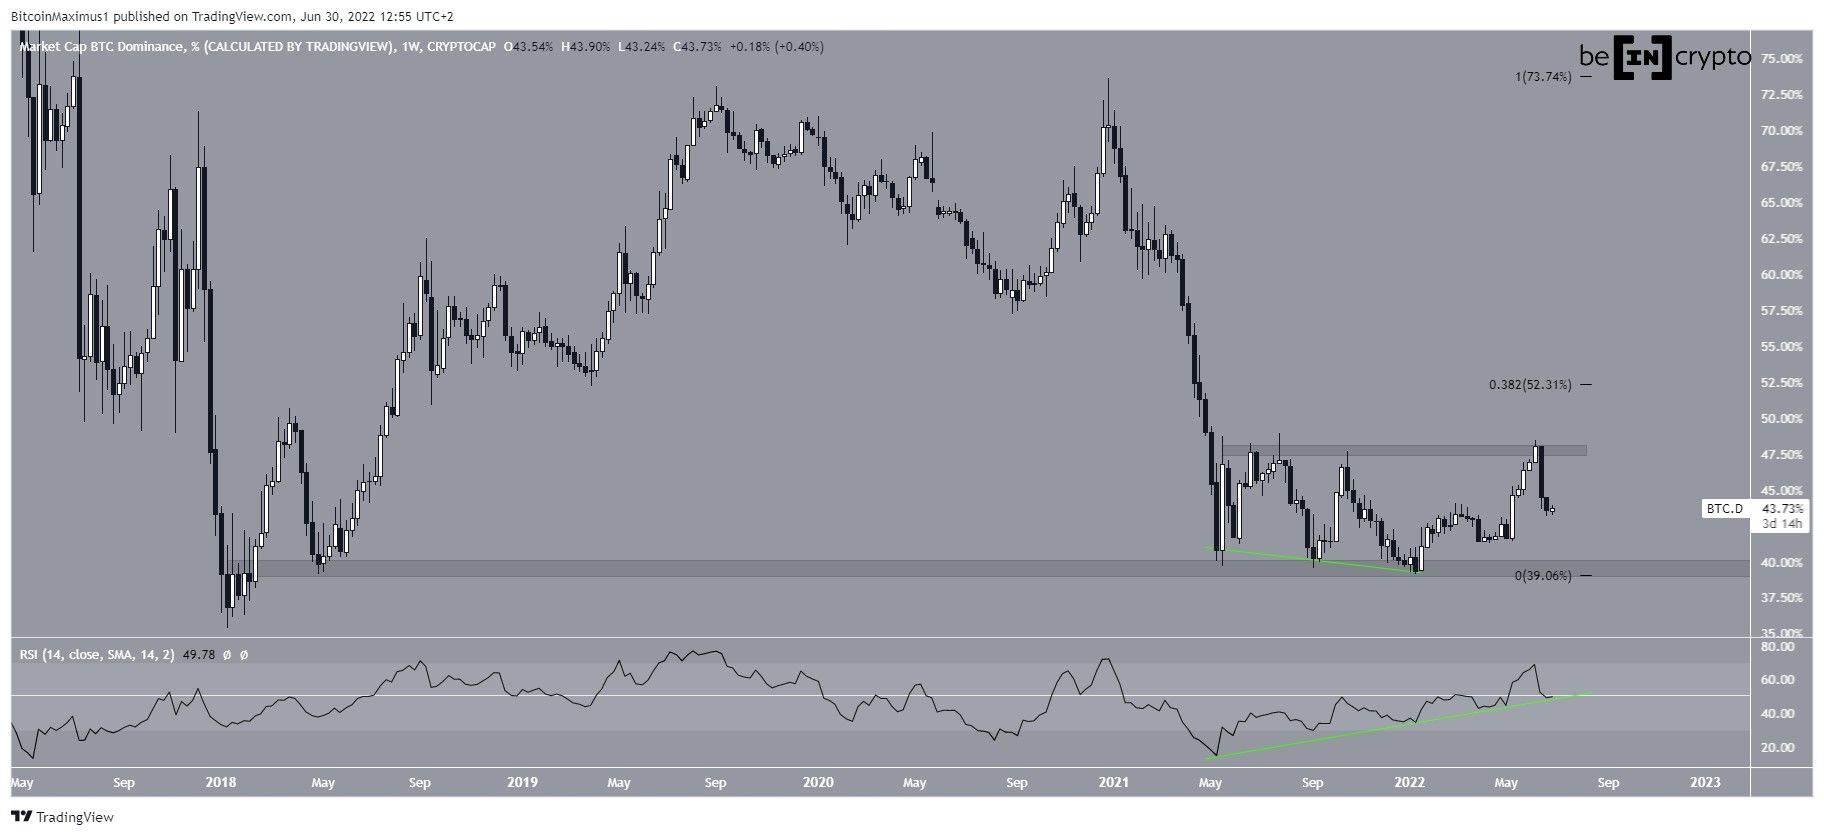
Between May-Dec. 2021, BTCD created a triple bottom pattern at the 40% long-term support area. The triple bottom is considered a bullish pattern. Thus, it is expected to lead to breakouts the vast majority of the time.
Supporting this possibility, the weekly RSI also generated a very significant bullish divergence. The divergence trendline (green) is still intact, and the RSI is right at 50. So, the current level on the weekly chart offers a great possibility for a bounce.
So far, BTCD has been rejected by the 47.50% horizontal resistance area. If it were successful in moving above it, the next resistance is at 52.30%.
Future BTCD movement
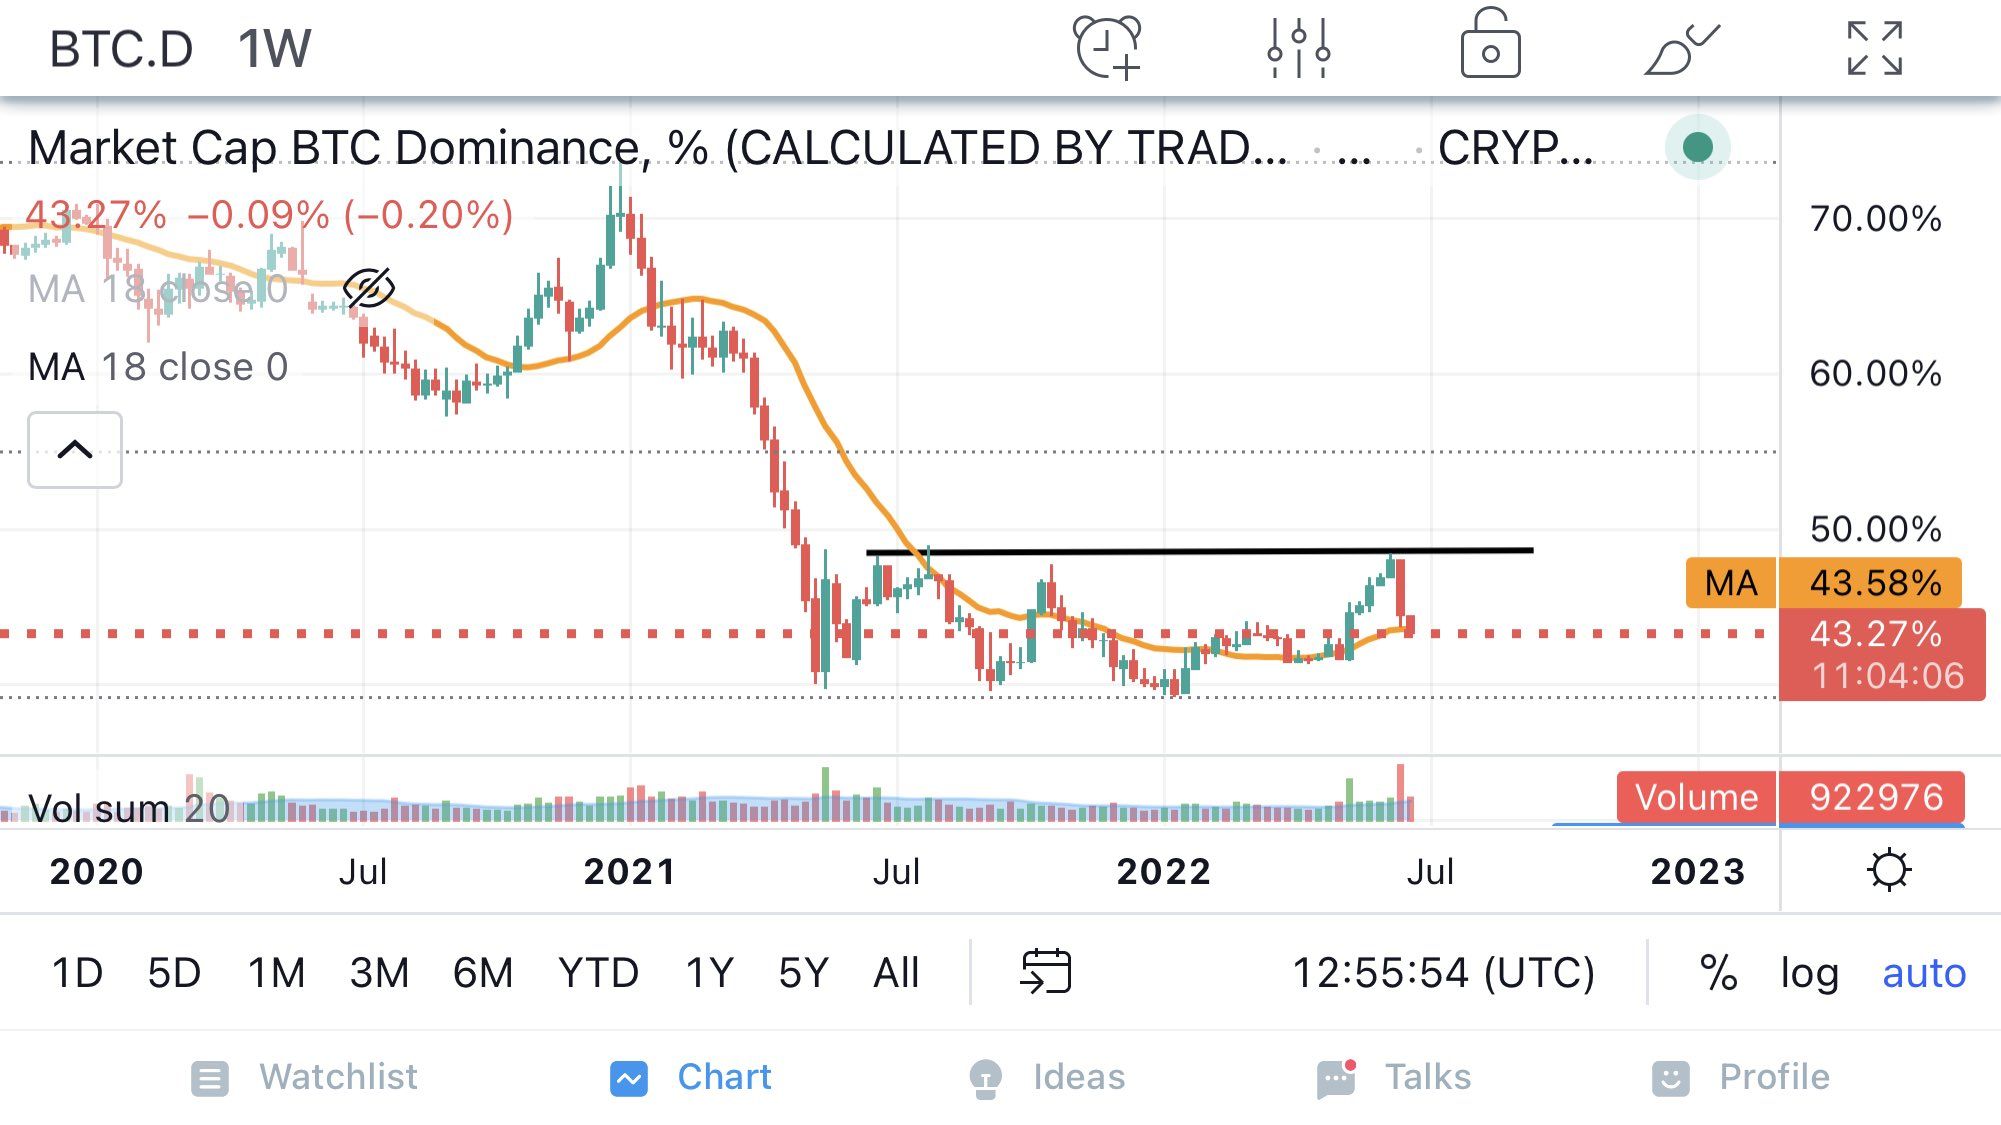
Well-known futures trader @peterlbrandt posted a chart of BTCD, stating that a close above 50% would be a very strong sign that BTC is moving higher.
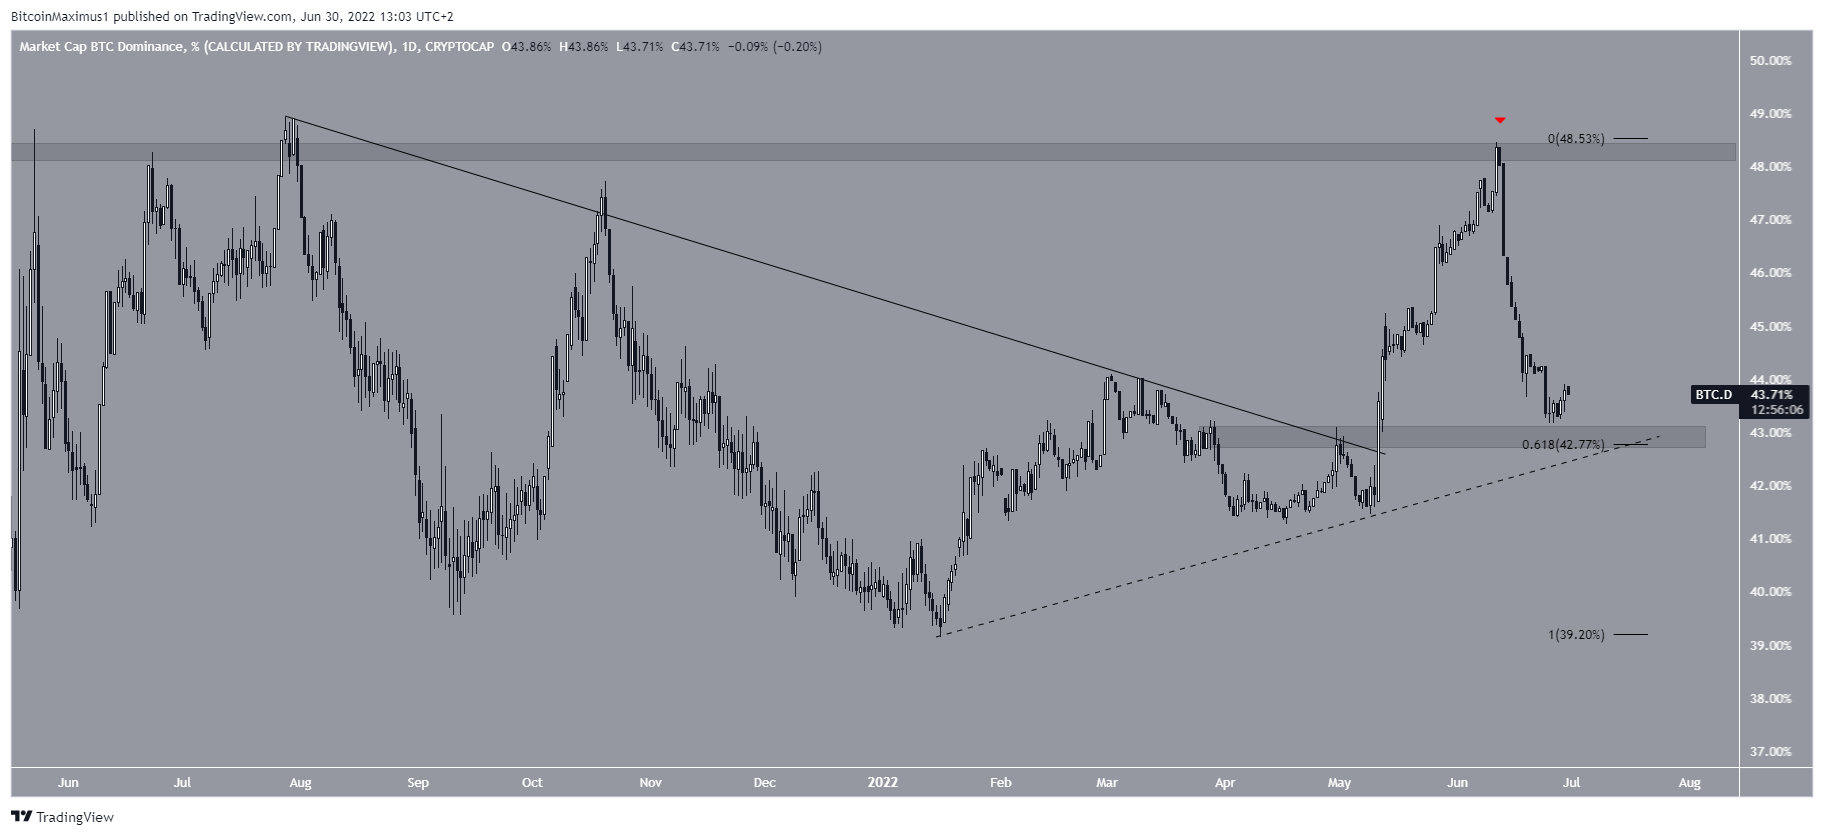
The daily chart shows that BTCD has broken out from a descending resistance line. However, after the rejection, it fell to a confluence of support levels at 43%.
This support is created by the 0.618 Fib retracement support level and an ascending support line.
So, in alignment with the weekly chart, the daily one indicates that a bounce at the current level would be likely.
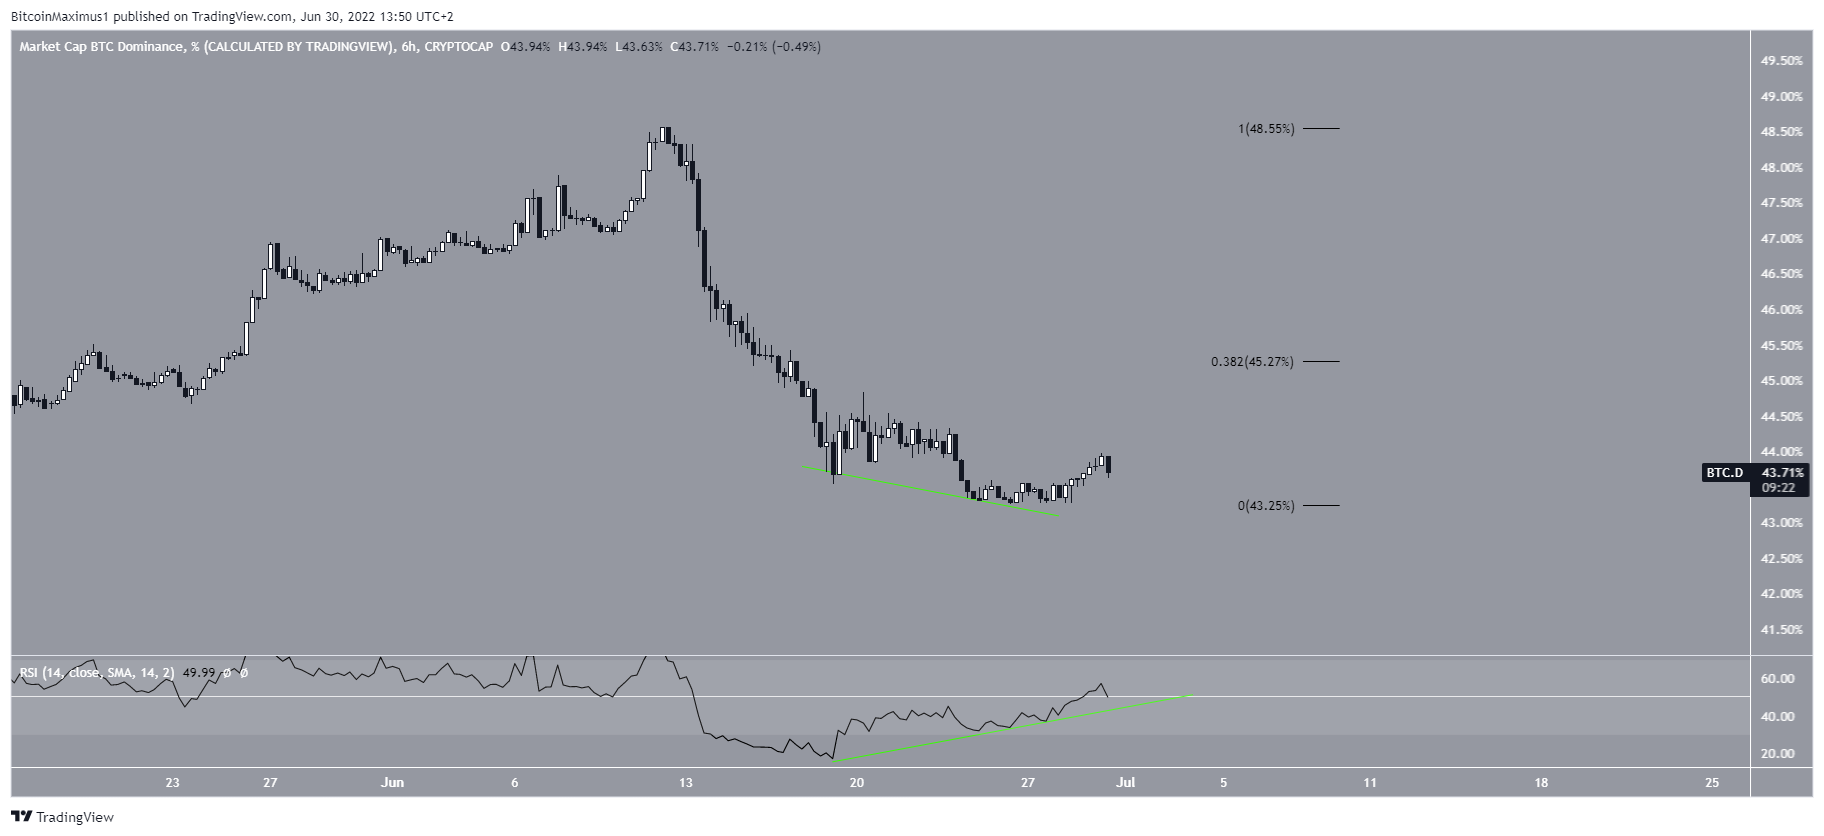
The two-hour chart supports this possibility, suggesting that a bounce is likely. The main reason for this is that the six-hour RSI has generated a very significant bullish divergence, and is now above 50.
If an upward movement does begin, the first resistance area would be at 45%, created by the 0.382 Fib retracement resistance level.
For Be[in]Crypto’s latest bitcoin (BTC) analysis, click here



