
The Bitcoin dominance rate (BTCD) was very close to reaching a new yearly low but it has bounced back some in the short term
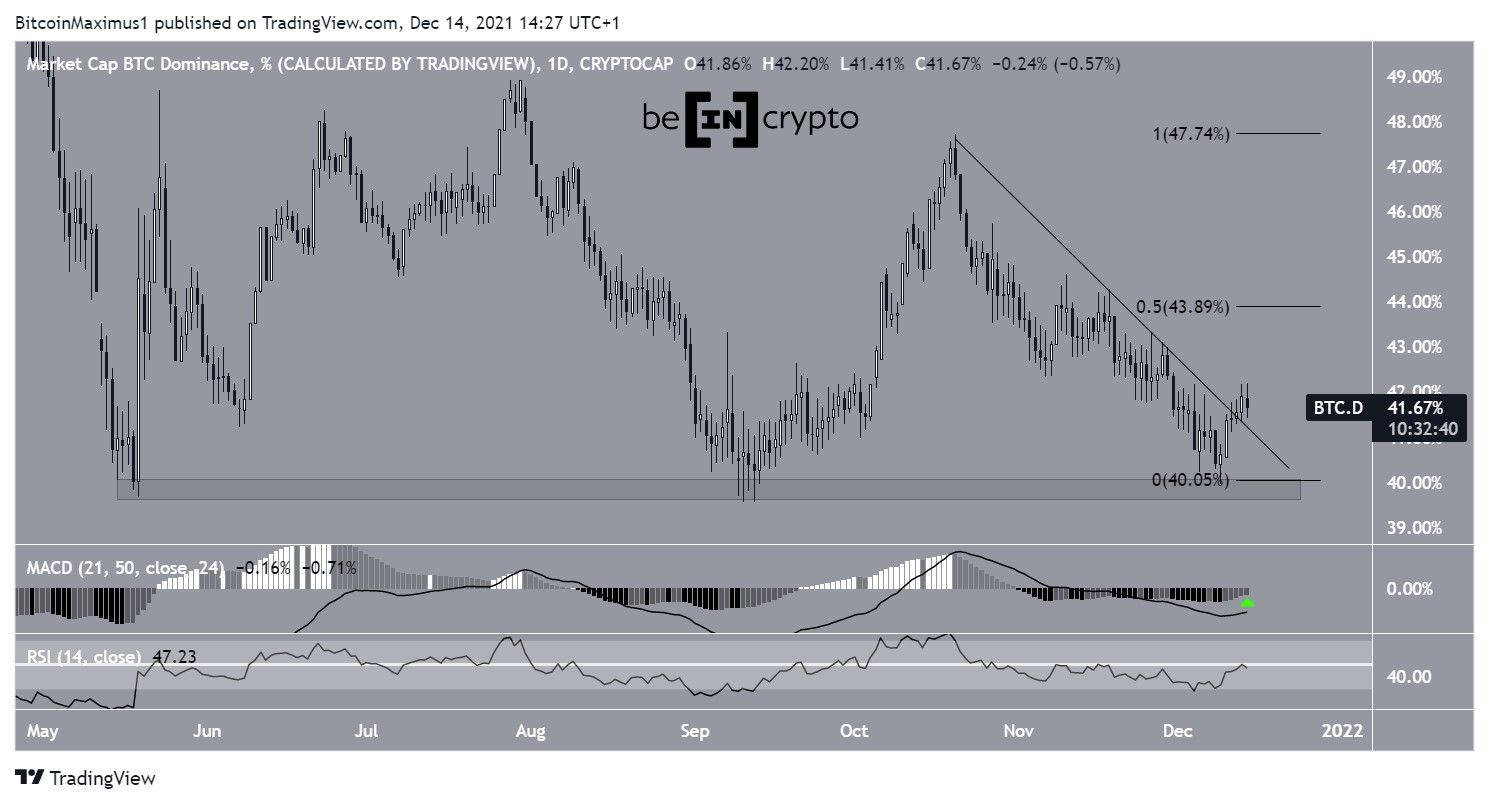
The Bitcoin dominance rate has been decreasing since Oct 20 after reaching a high of 47.72%. Throughout the descent, it followed a descending resistance line. This led to a low of 39.95% on Dec 9. The low was made very close to the long-term 39.50% support area.
The dominance rate bounced back after and proceeded to break out from the descending resistance line on Dec 12. If it continues to increase, the main resistance area would be found at 44%. This target is both the 0.5 Fib retracement resistance level and a horizontal resistance area.
Technical indicators are starting to show bullish signs. The MACD is moving upwards and is nearly positive. The MACD is created by short and long-term moving averages (MA), and this is a sign that the short-term MA is gaining speed relative to the long-term average.
Similarly, the RSI is moving upwards and is at the 50-line. Readings above this line are normally considered signs of a bullish trend.
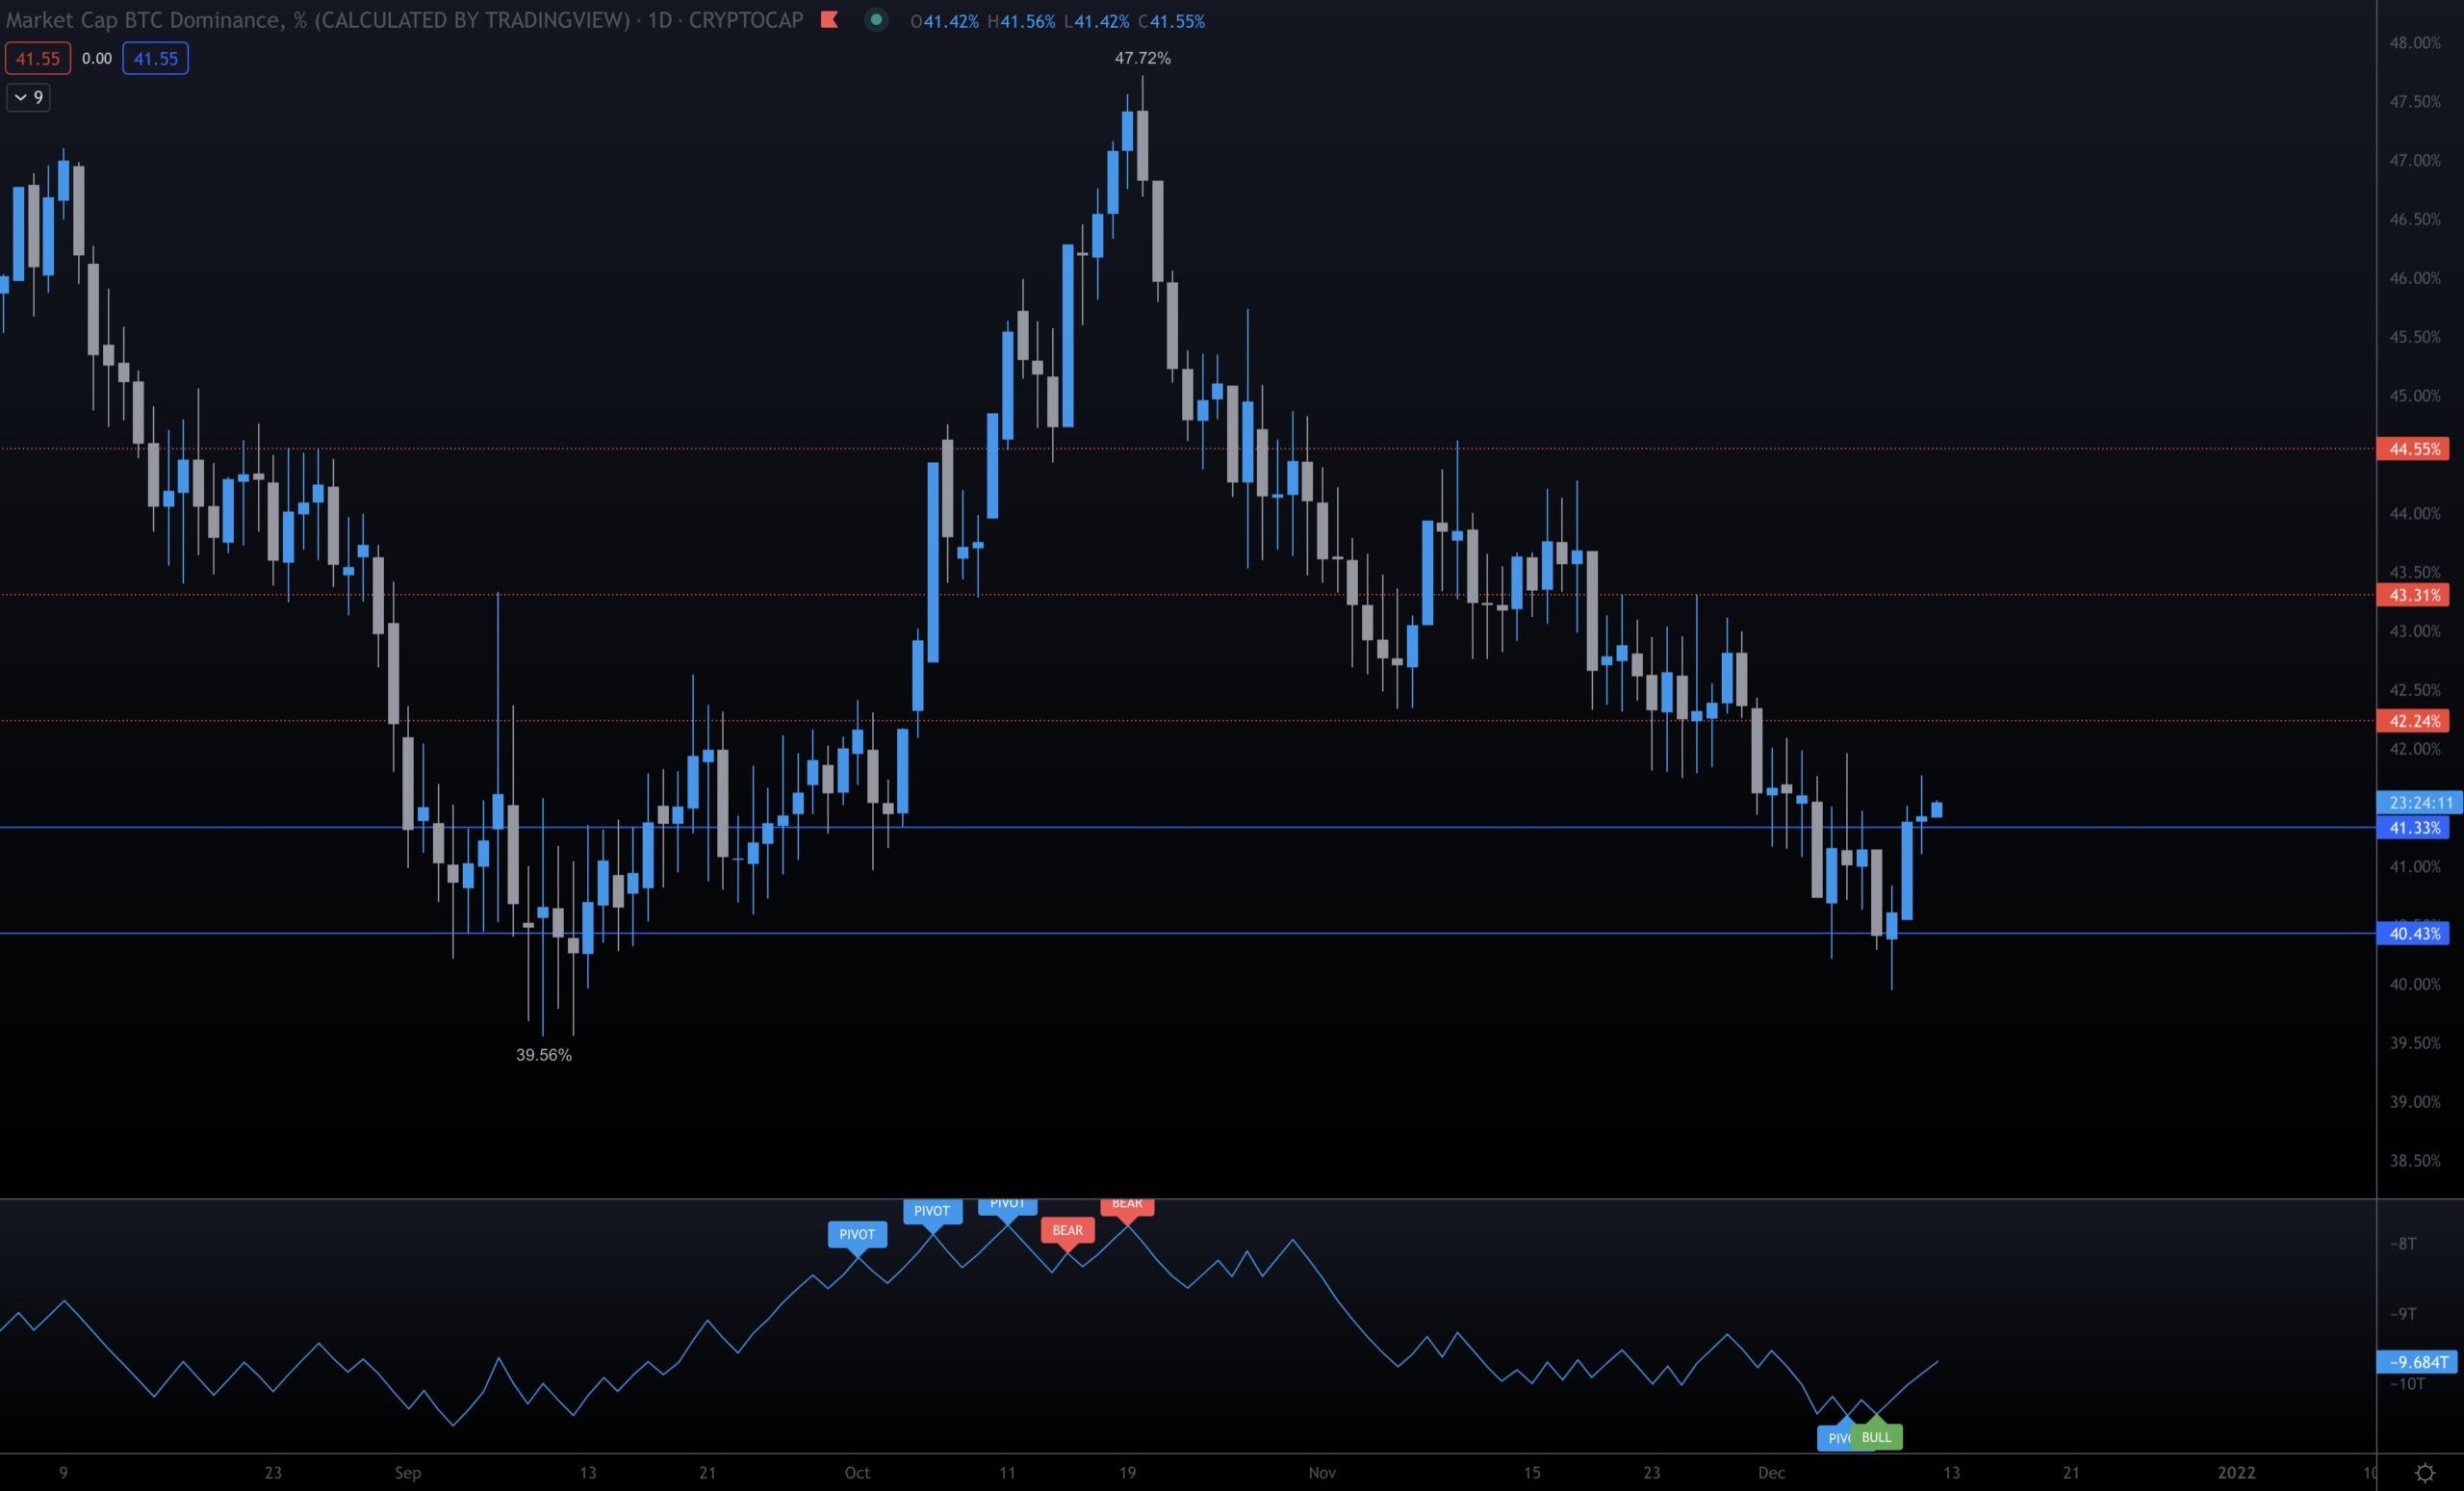
Cryptocurrency trader @TradingTank stated that the on-balance volume (OBV) indicator, which measures volume changes, is showing a bottom on BTCD. While this has yet to be confirmed, the MACD and RSI are also showing signs of a potential bottom.
Long-term BTCD movement
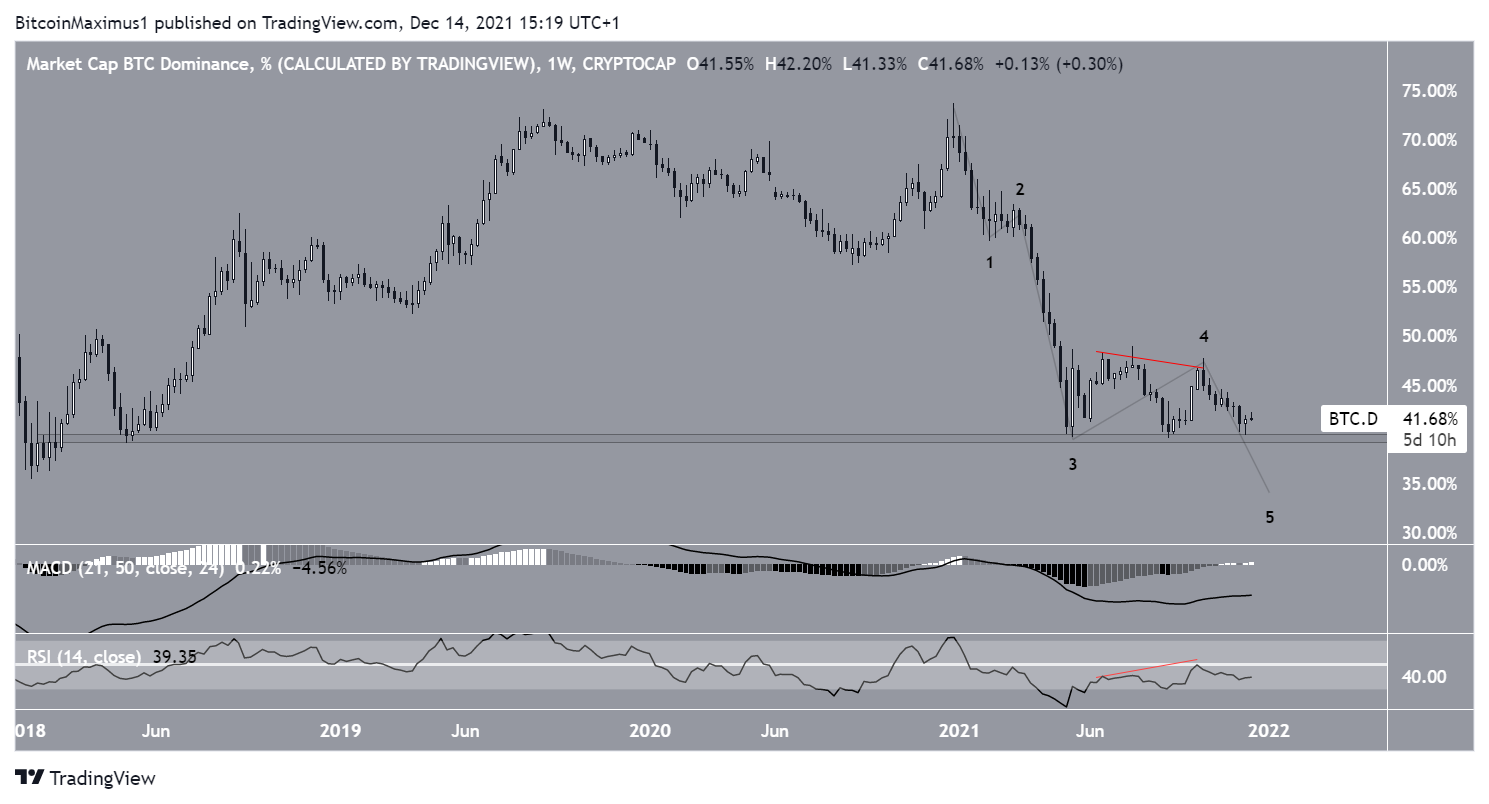
Despite the ongoing bounce in the daily time frame, the weekly chart still paints a bearish picture.
The weekly RSI has generated a hidden bearish divergence (red line). This same pattern preceded the massive fall to the 40% range. Furthermore, the indicator is still below 50 and the MACD is still negative.
The downward move that began in December 2020 looks like it has four completed waves. As a result, another leg to the downside would be likely to complete the fifth and final wave.
The readings from the weekly time frame suggest that any bounce is likely to be short-lived, and the downward movement is expected to continue in the long term.
For BeInCrypto’s latest Bitcoin (BTC) analysis, click here
