


The Bitcoin dominance rate (BTCD) has been falling since it was rejected on June 11. However, the conditions are ripe for long-term bullish continuation.
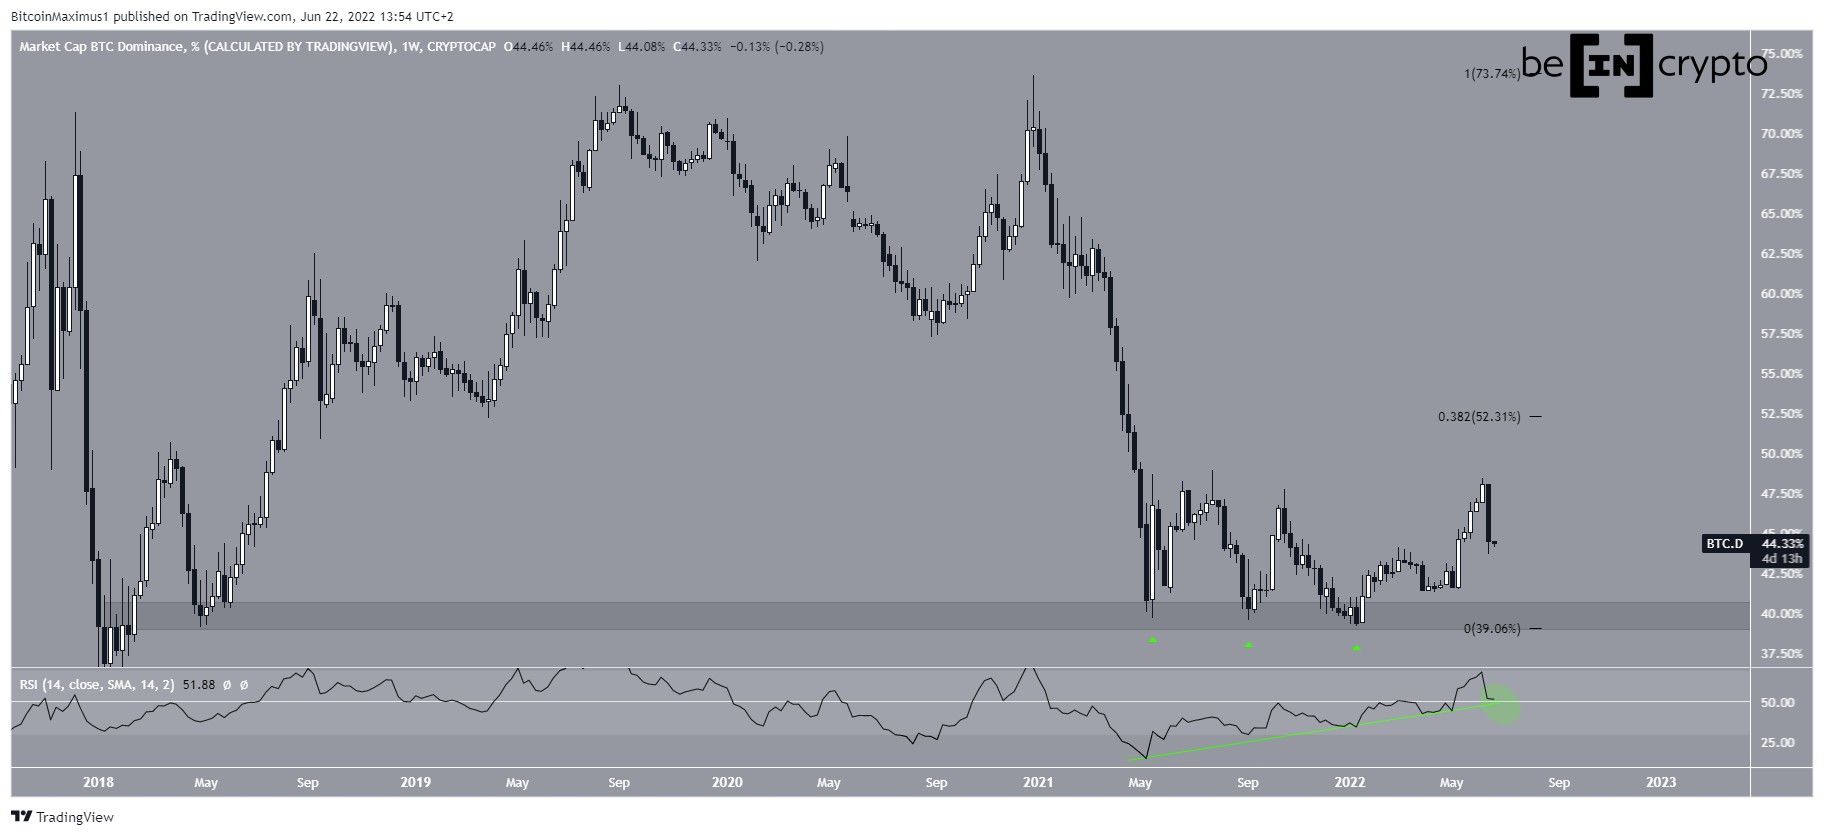
BTCD created a triple bottom pattern at the 40% long-term support area between May-Dec 2021. The triple bottom is considered a bullish pattern, meaning that it leads to breakouts the majority of the time.
Additionally, the pattern was combined with a bullish divergence in the weekly RSI, further adding legitimacy to the pattern. Moreover, the trendline of the bullish divergence is still intact and the RSI is in the process of bouncing at the 50 line. So, the conditions for bullish continuation are present in the weekly RSI.
If the reversal continues, the closest resistance would be at 52.3%. This is the 0.382 Fib retracement resistance level when measuring the entire drop.
BTCD Gets Rejected
Cryptocurrency trader @CryptoGemsMiner tweeted a chart of BTCD which shows an ongoing rejection.
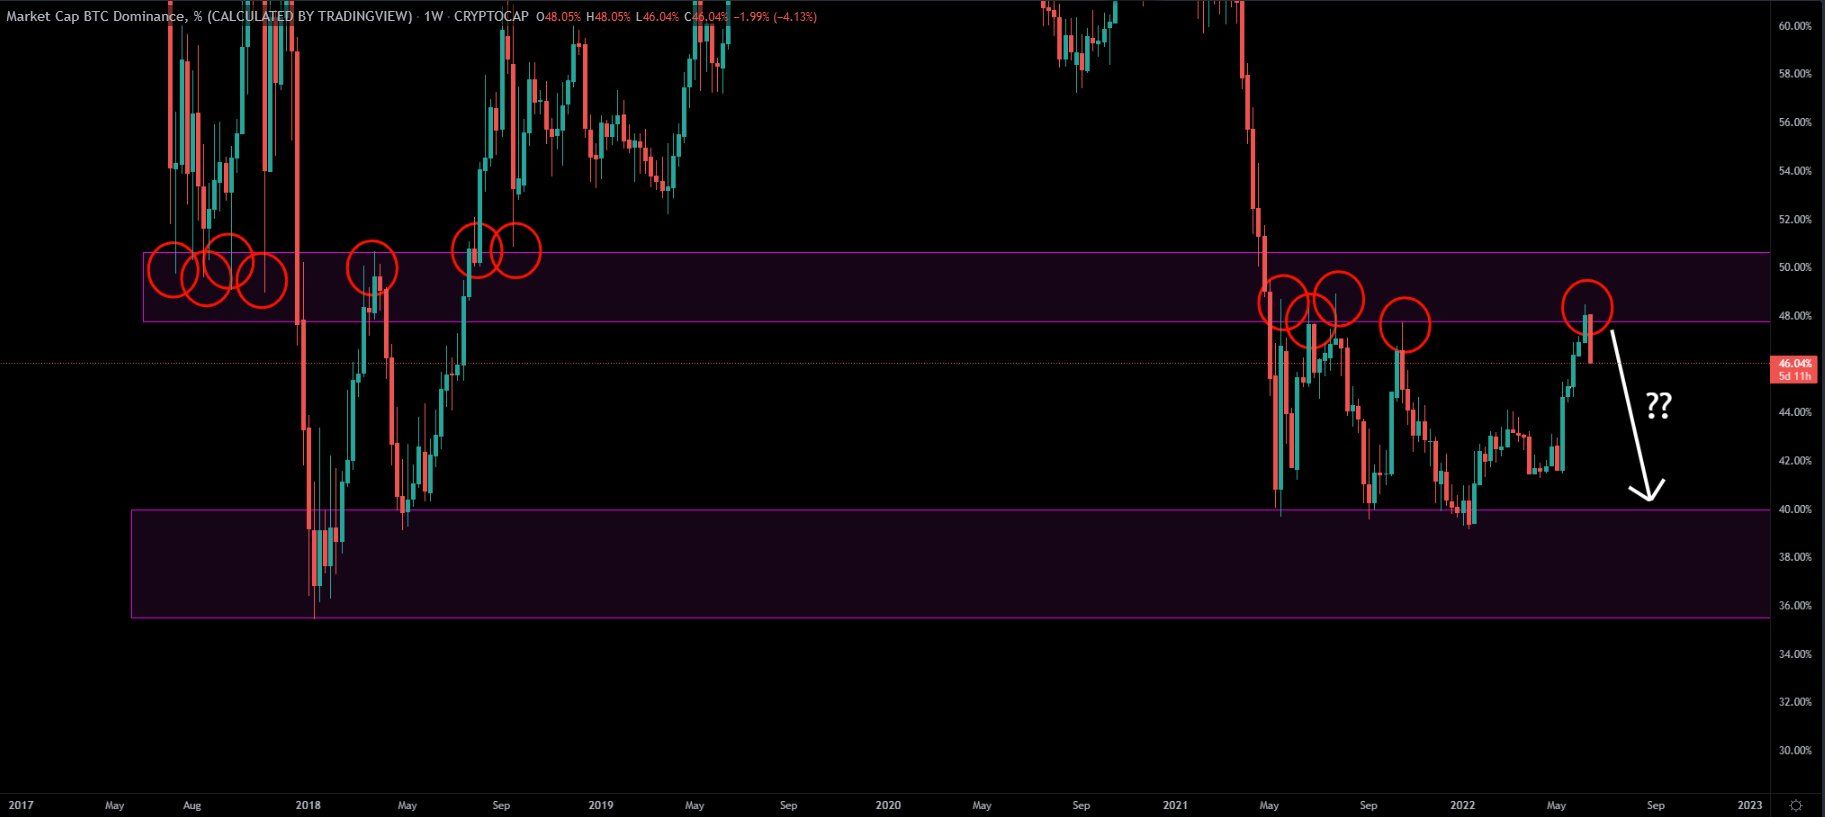
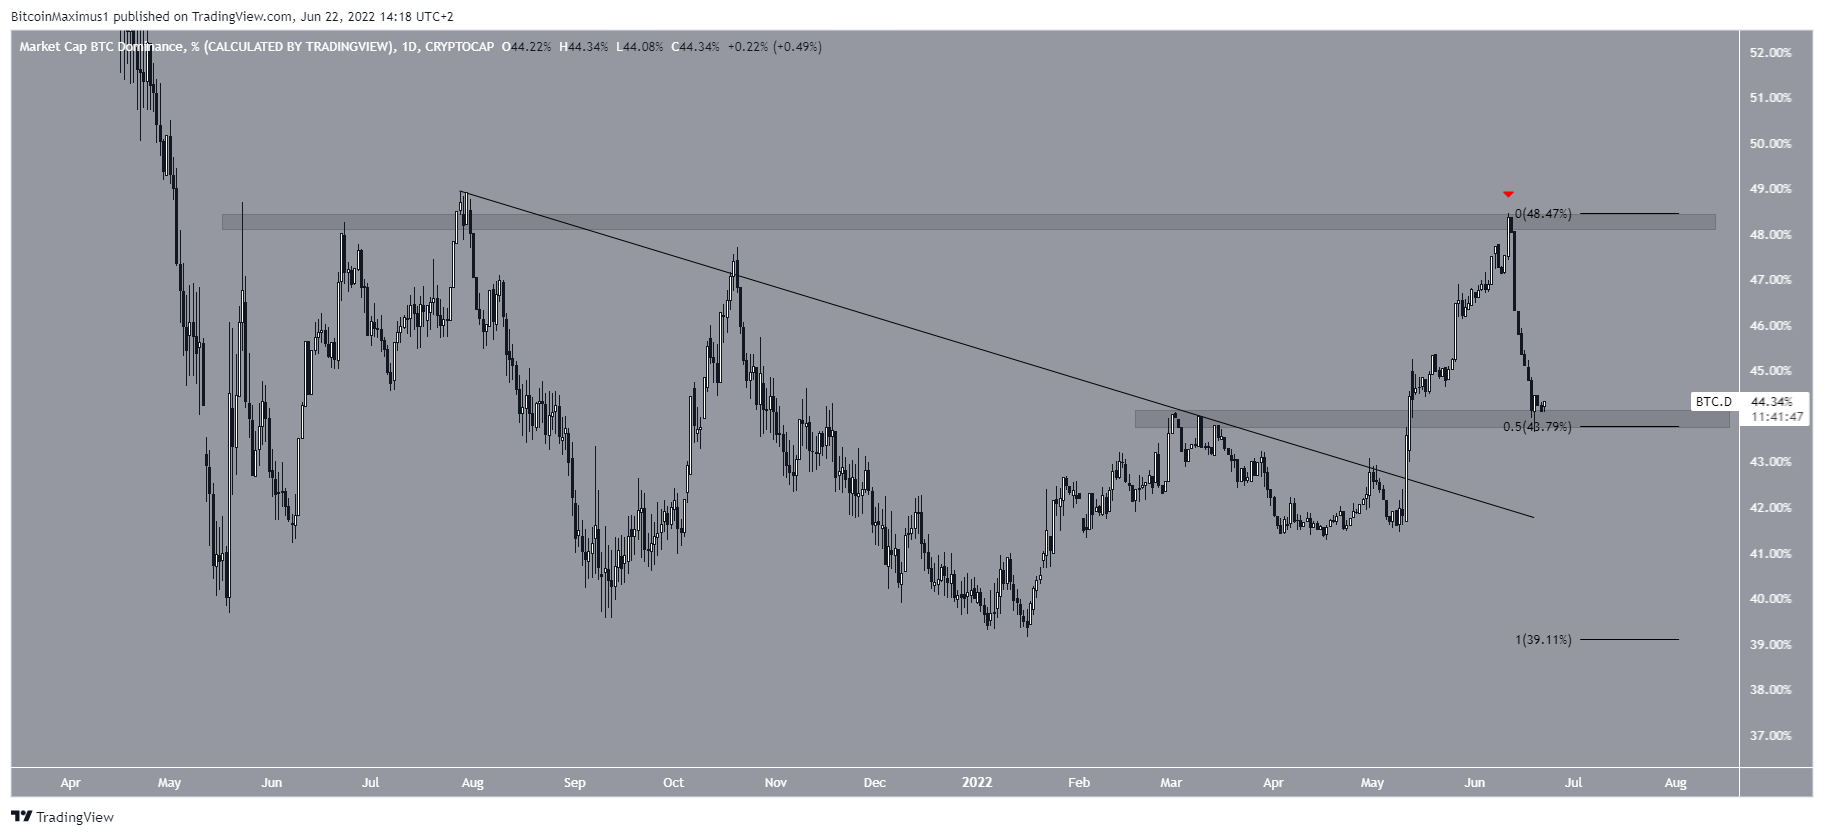
The daily chart shows that BTCD has been increasing at an accelerated rate since breaking out from a descending resistance line on May 11. It proceeded to reach a high of 48.45% on June 11. Afterward, it was rejected (red icon) and fell sharply.
It is currently trading at 43.50%, a level that is both a horizontal support area and the 0.5 Fib retracement support level when measuring the most recent increase. So, it is possible that it will initiate a reversal, at least in the short term.
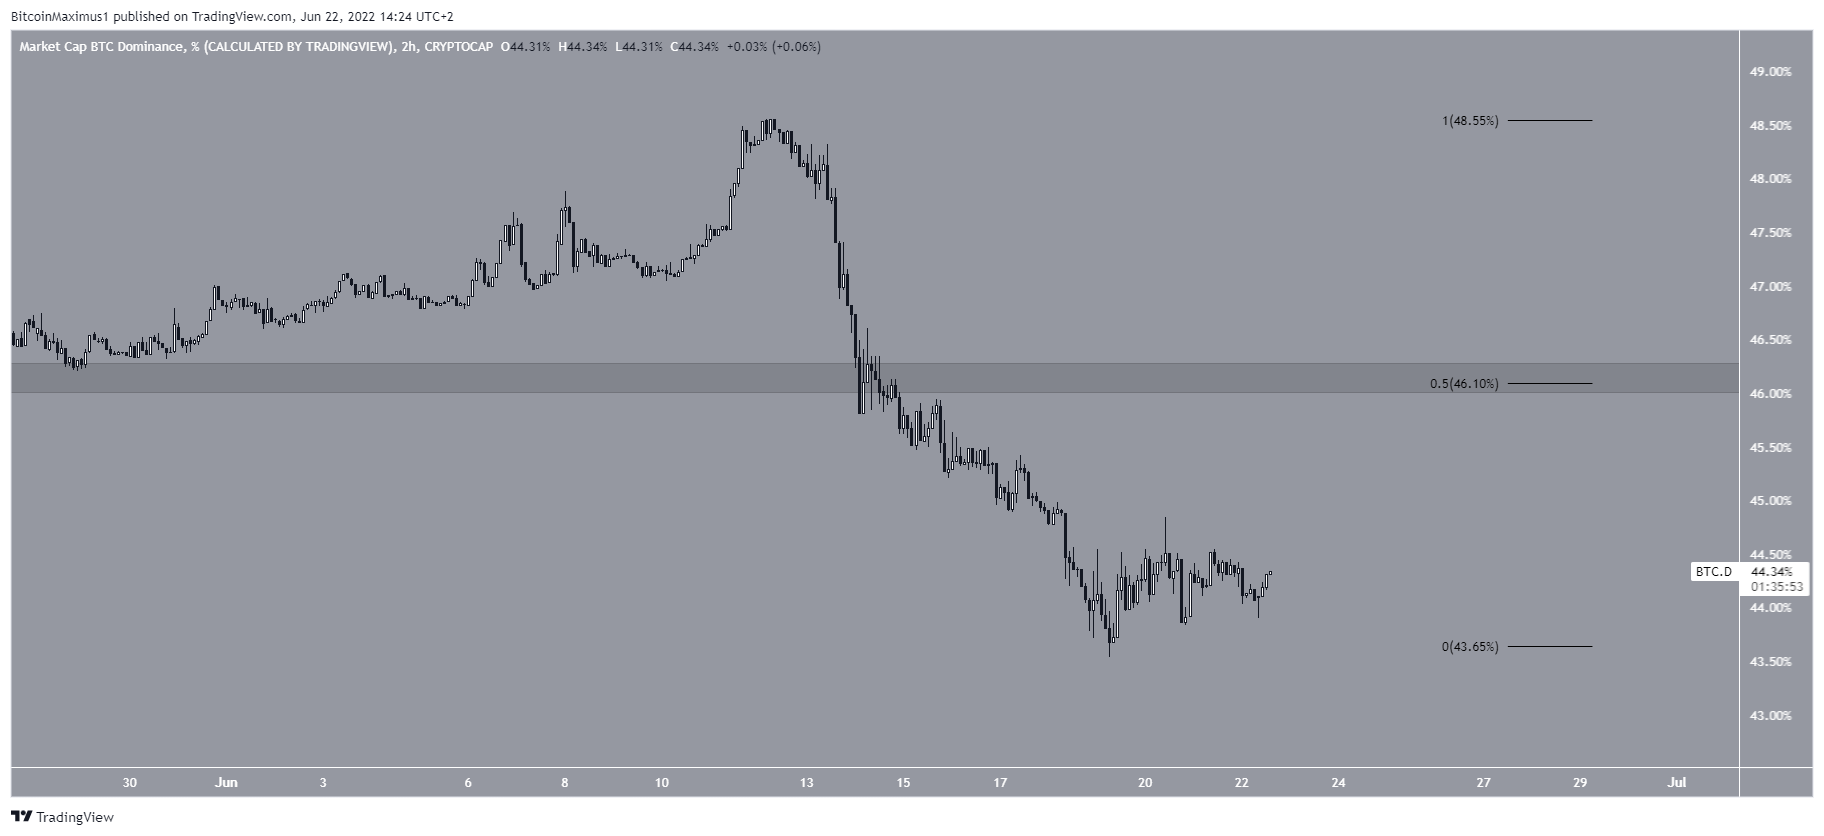
If a bounce does transpire, the two-hour chart shows that the closest resistance area is at 46%. This is the 0.5 Fib retracement resistance level and a horizontal resistance area.
Whether BTCD manages to reclaim it or gets rejected could determine the direction of the future trend.
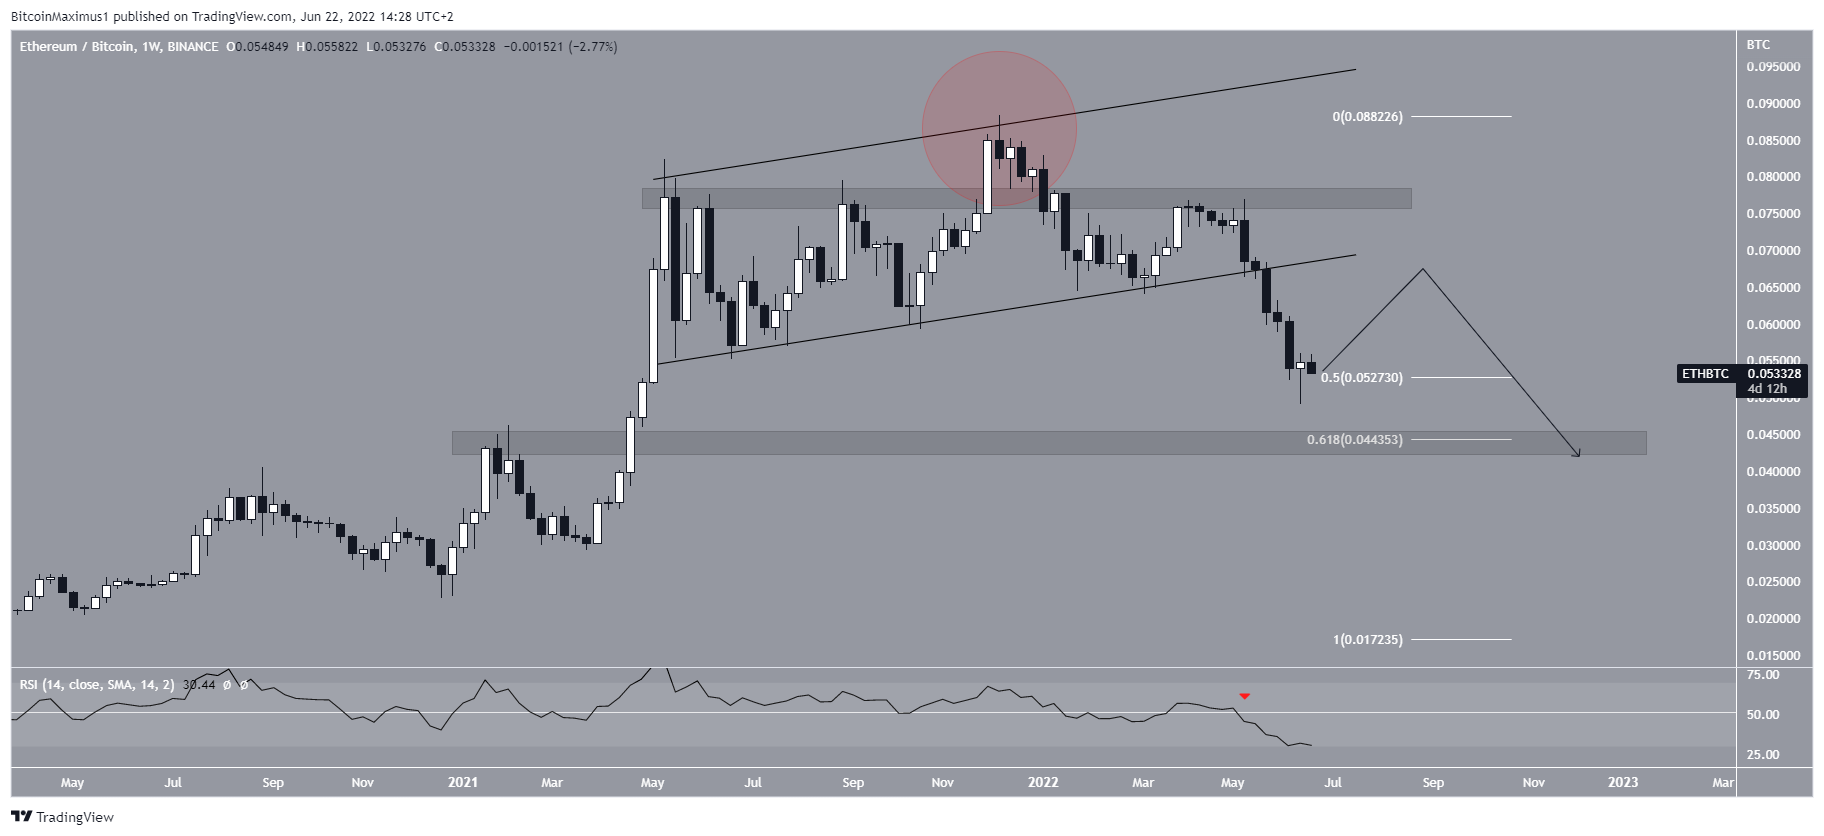
ETH/BTC
Since Ethereum (ETH) is the largest altcoin ranked by its market capitalization, its movements affect BTCD.
The weekly chart looks bearish, aligning with the fact that the weekly BTCD chart looks bullish.
ETH has been falling since deviating above the ₿0.0765 resistance area (red circle). Afterward, ETH broke down from a long-term ascending parallel channel, while the RSI dropped below 50 (red icon). These are all considered bearish signs.
ETH did bounce at the 0.5 Fib retracement support level at ₿0.052. So, while it is possible that this will initiate a bounce, possibly validating the channel as resistance, and eventual drop towards the 0.618 Fib retracement support level at ₿0.044 still seems likely.
For Be[in]Crypto’s latest bitcoin (BTC) analysis, click here


