
The Bitcoin dominance rate (BTCD) is approaching its yearly lows and could eventually reach a new all-time low.
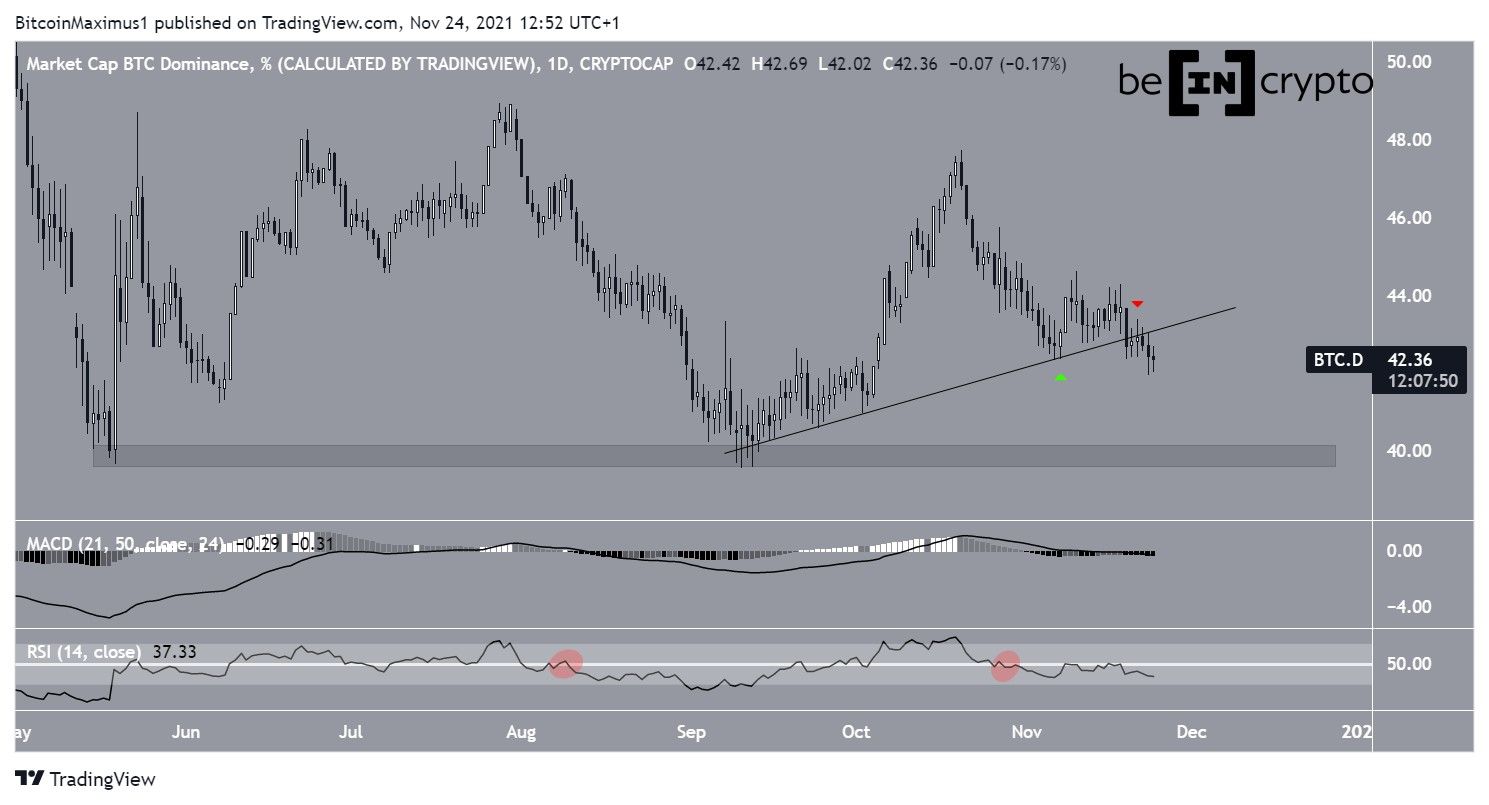
BTCD has been falling since Oct 20, when it had just reached a high of 47.72%. Initially, the decrease was halted by an ascending support line that had been in place since the beginning of Sept. BTCD bounced at this line on Nov 7 (green icon).
However, the bounce was short-lived and a breakdown from the ascending support line occurred on Nov 19. The next day, it validated the line as resistance (red icon).
The breakdown is supported by readings from the RSI and MACD.
The RSI, which is a momentum indicator, has fallen below 50 (red circle). This is a sign of bearish trends, and the previous time it occurred (red circle), a significant downward movement followed.
Similarly, the MACD is decreasing and is negative. This means that the short-term trend is slower than the long-term one.
The closest support area for BTCD is at 39.80%, created by the yearly lows.
Will BTCD reach a new all-time low?
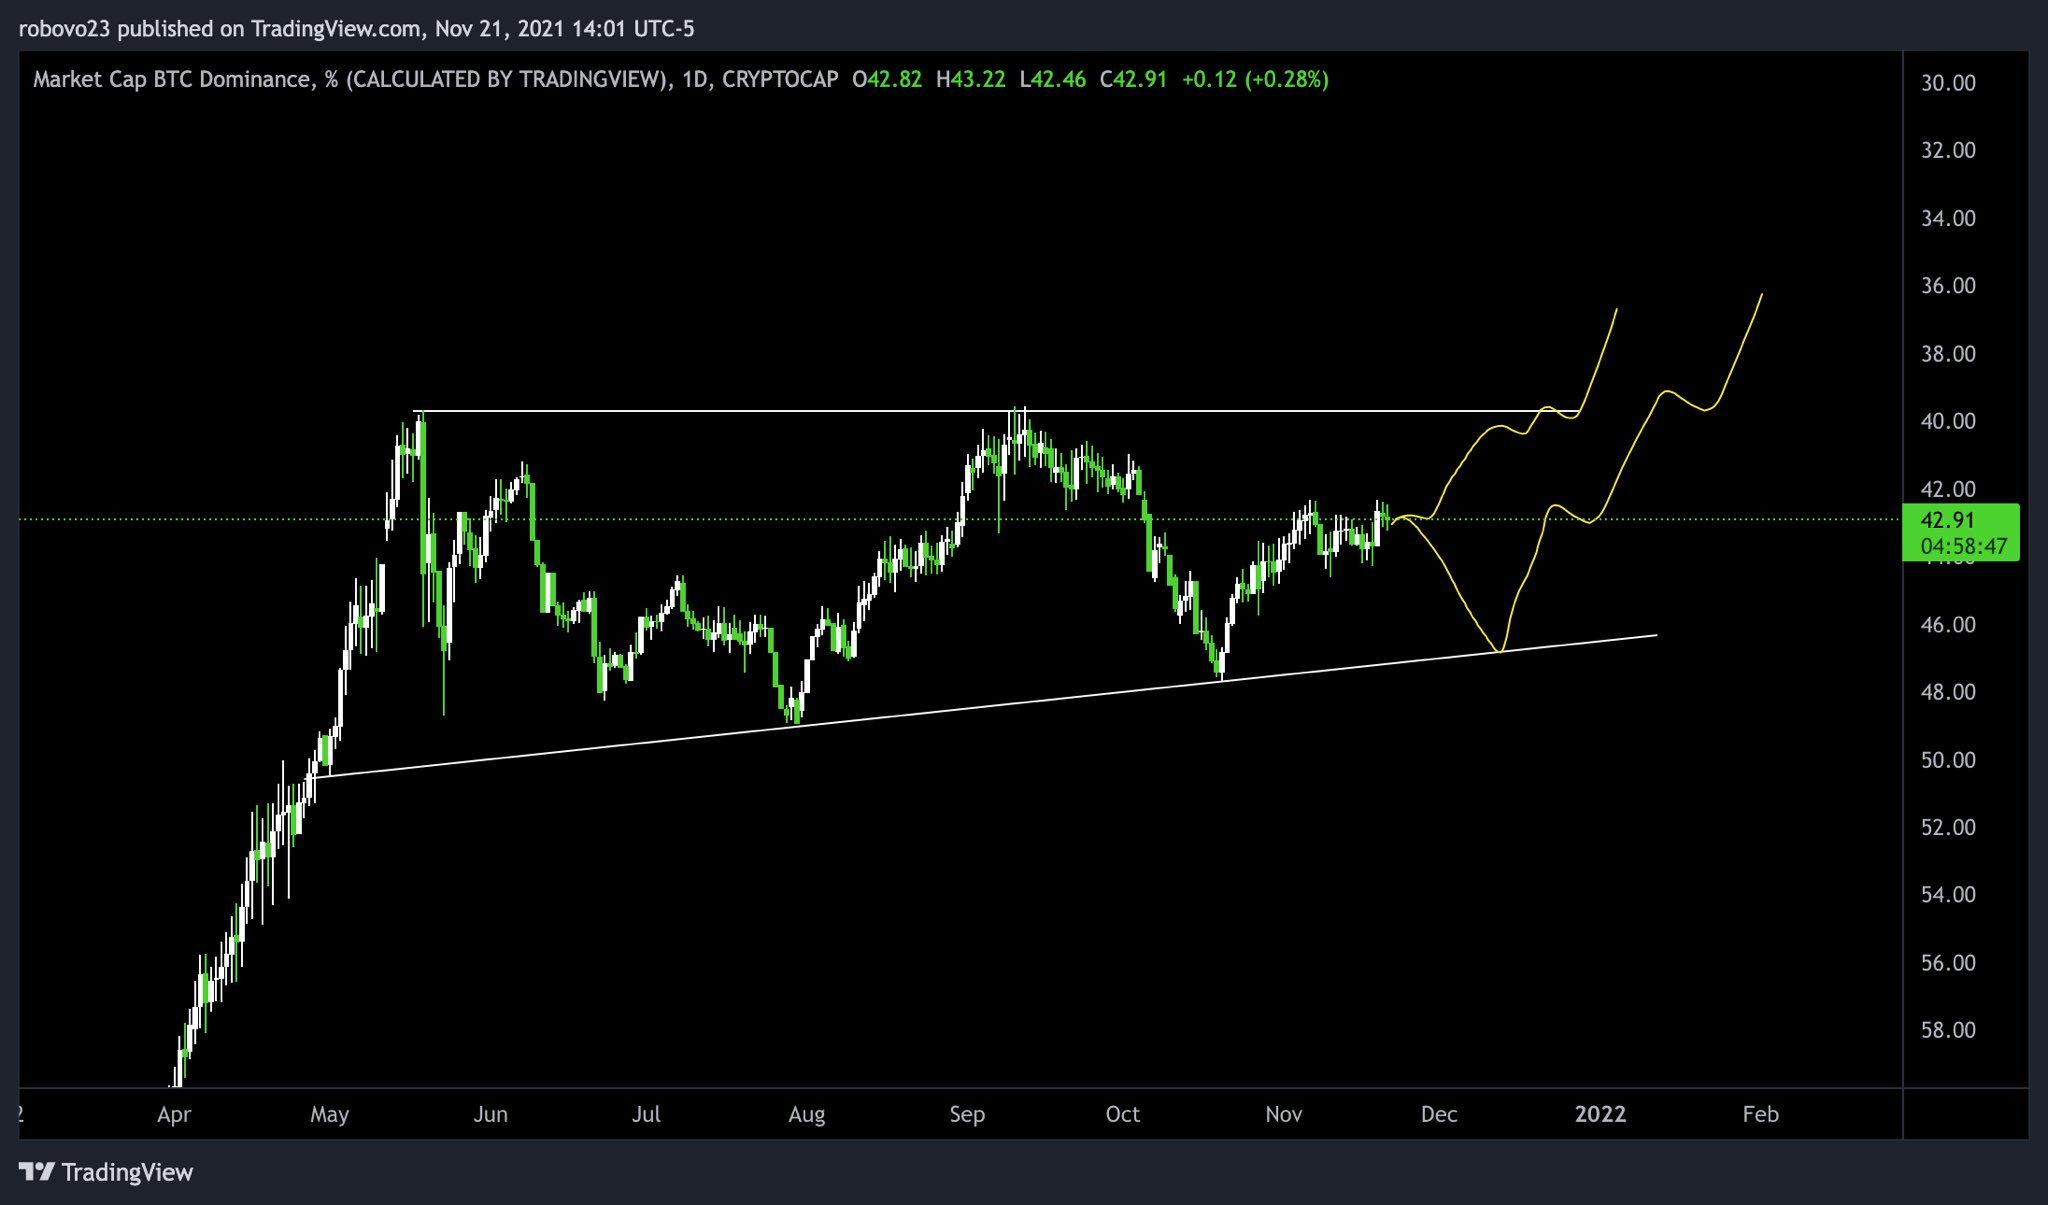
Trader @robw00ds outlined an inverted BTCD chart, which shows it falling to a new all-time low.
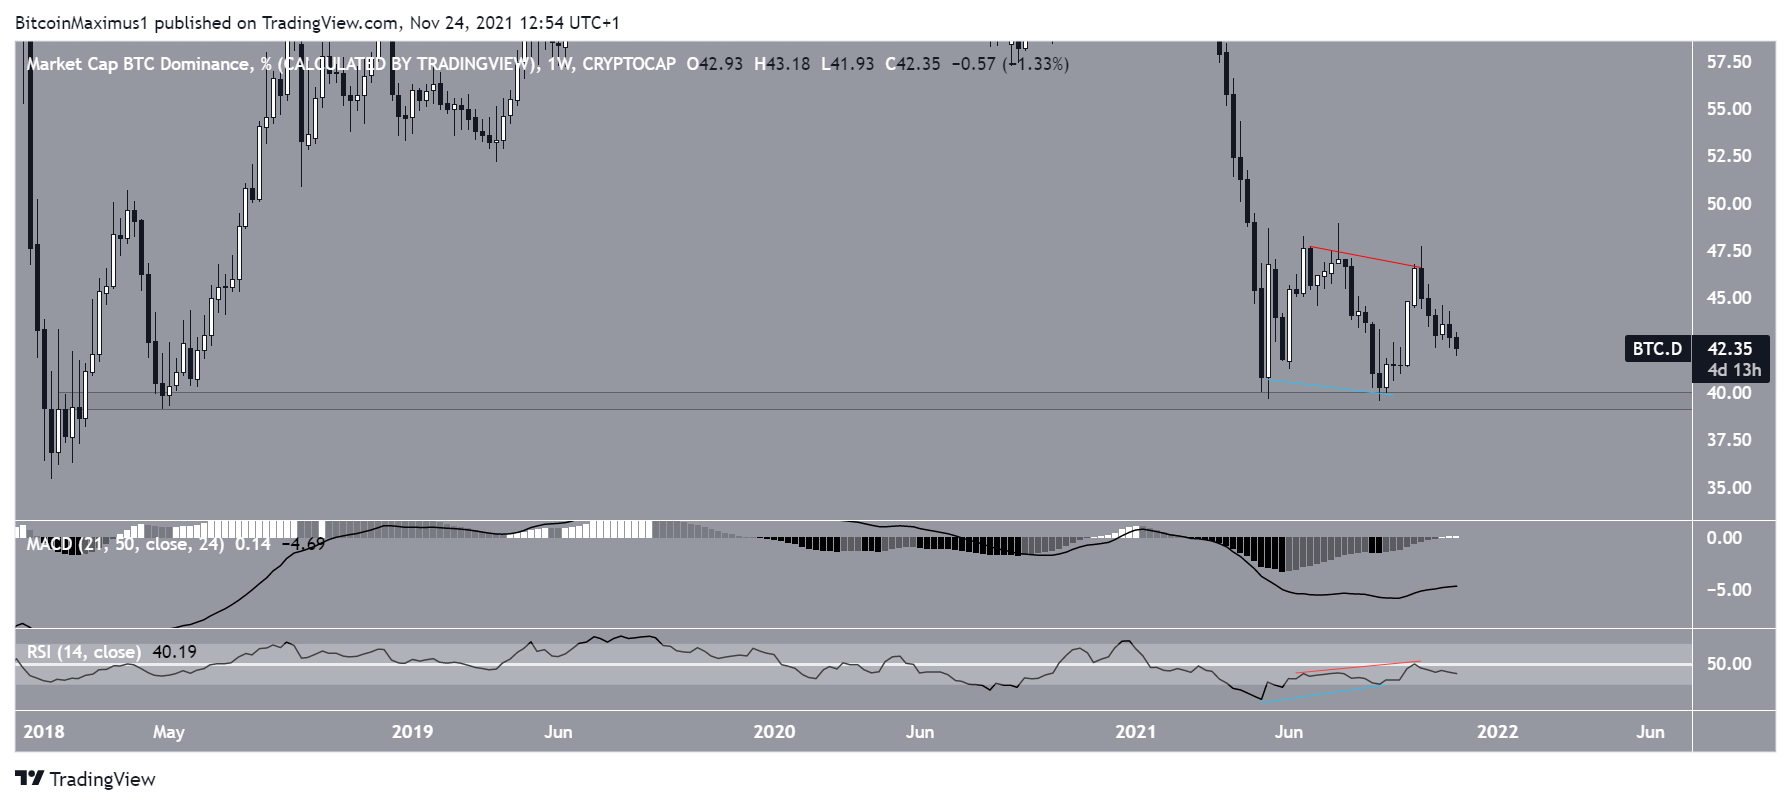
The weekly chart does suggest that BTCD will fall to a new all-time low.
The Sept – Oct bounce was preceded by bullish divergence in the RSI (blue line). This is a bullish occurrence that often precedes trend reversals. However, this was negated by a hidden bearish divergence (red line) in the same indicator.
Furthermore, the RSI is below 50, which is considered a sign of a bearish trend. Also, the MACD is negative.
Besides the previously outlined long-term support area, there is no more support for BTCD until an all-time low is reached.
For BeInCrypto’s previous Bitcoin (BTC) analysis, click here.
What do you think about this subject? Write to us and tell us!
