The Bitcoin dominance rate (BTCD) is attempting to find support after a short-term rejection from a Fib resistance level.
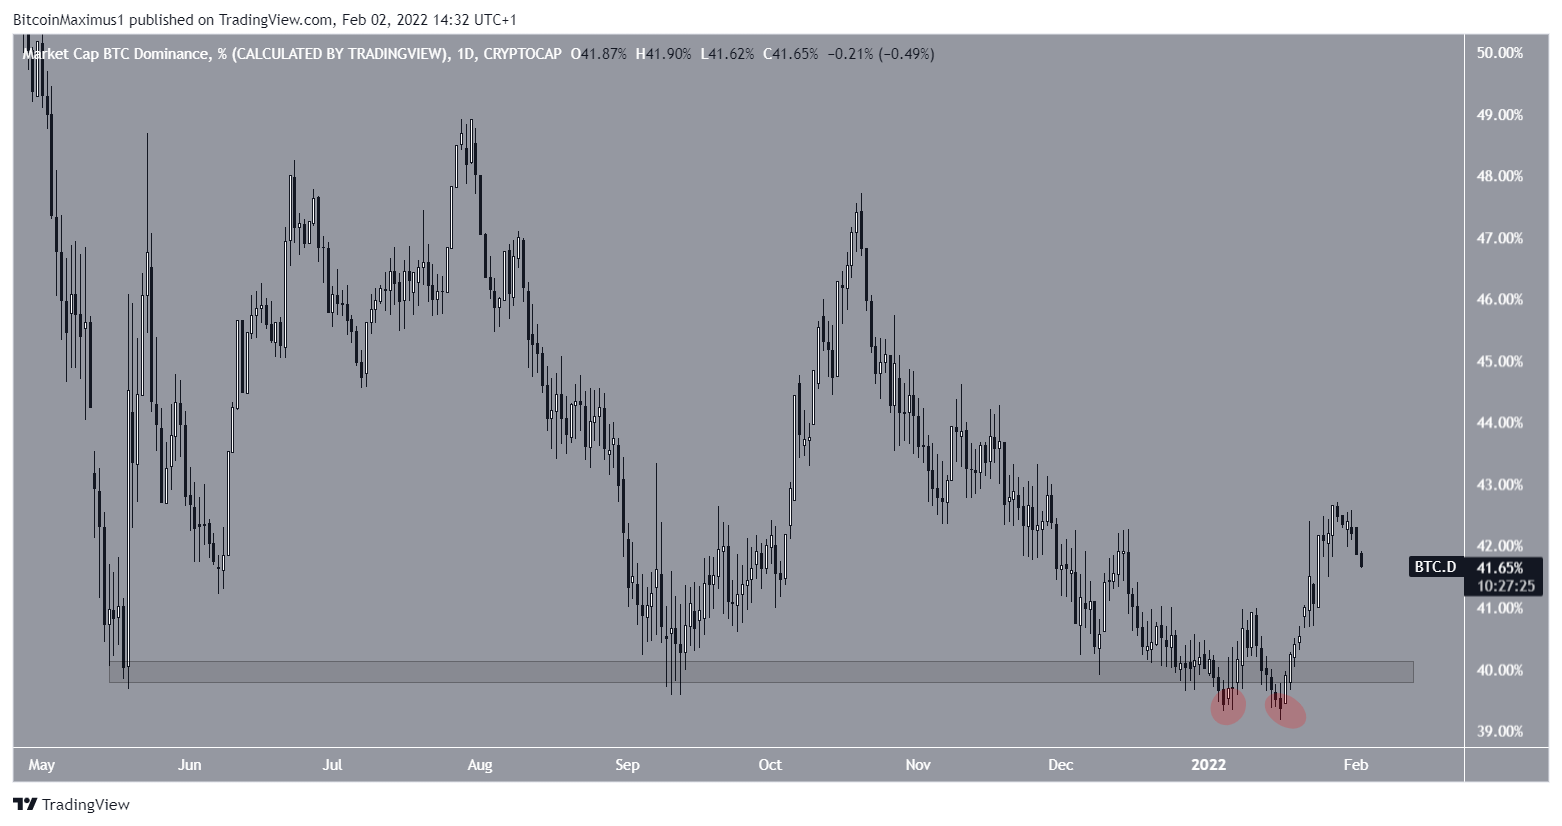
BTCD had been trading above the 40% horizontal support area since May 2021. The area was the catalyst for the initiation of several upward movements.
However, BTCD fell below it on Jan 2, 2022, apparently breaking down (red circles). Despite this decrease, it proceeded to reclaim the area shortly after and has been moving upwards since.
Such deviations are considered bullish developments and often lead to significant future increases.
Ongoing BTCD bounce
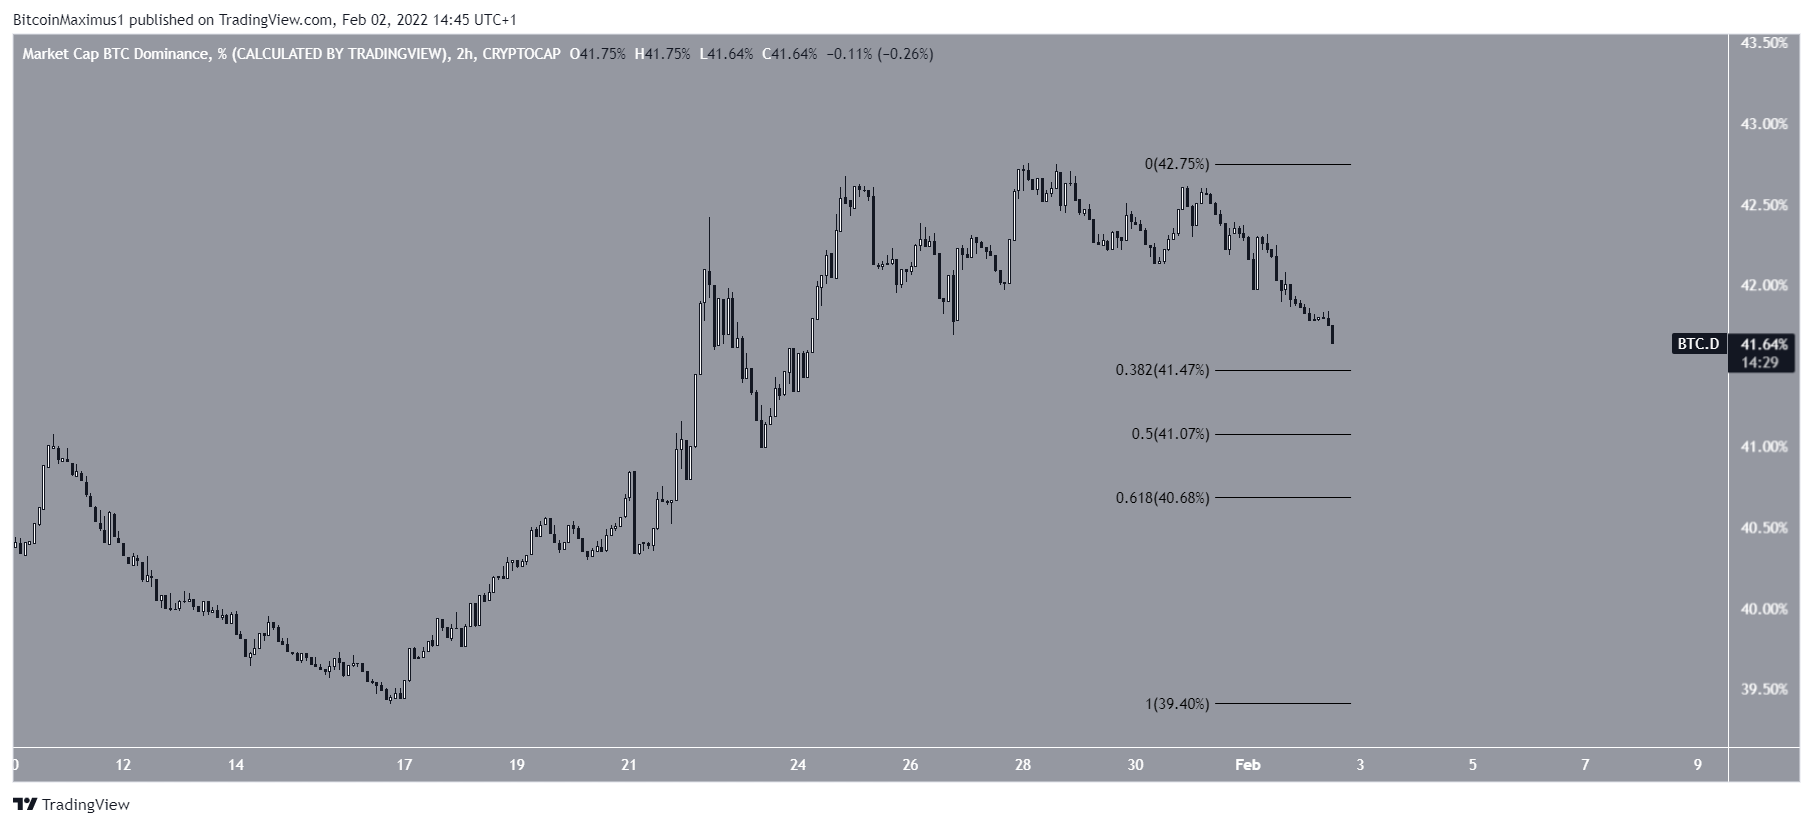
Cryptocurrency trader @Axeloncrypto tweeted a BTCD chart, stating that the current resistance area at 42.5% is expected to reject BTCD.
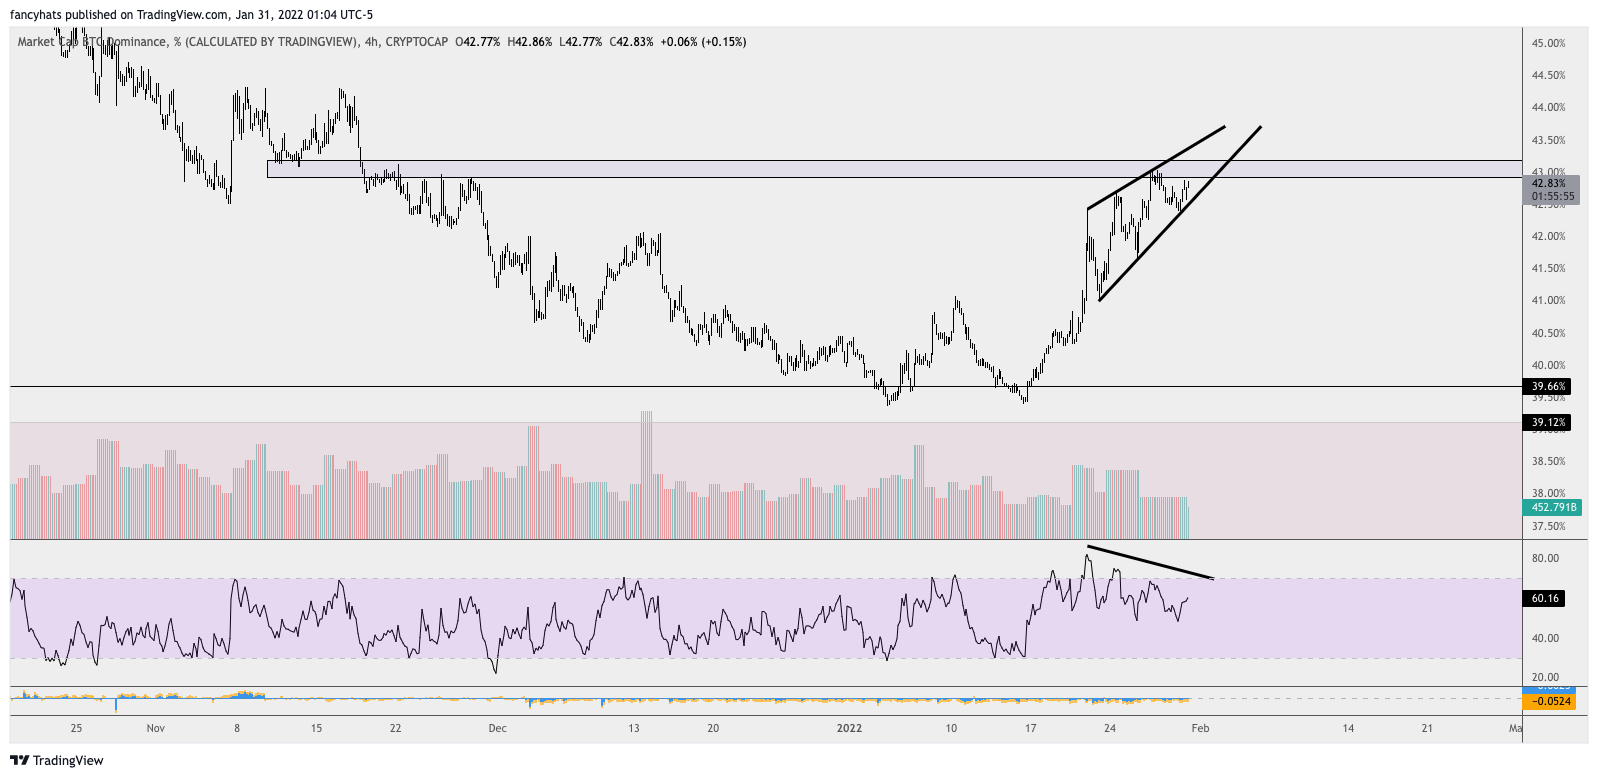
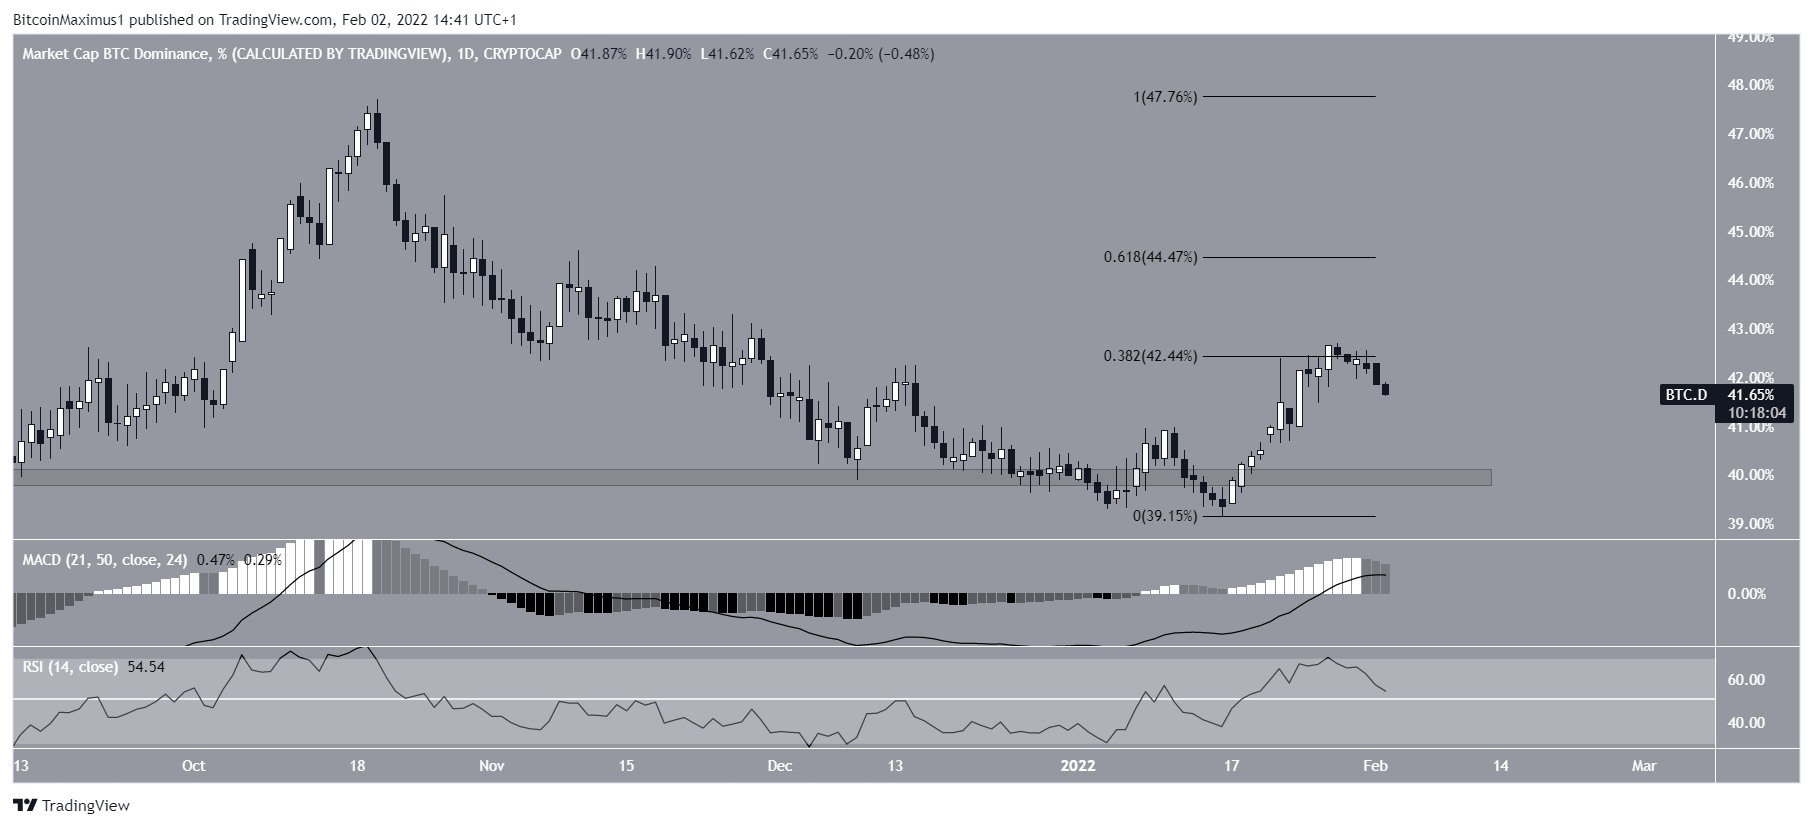
Since the tweet, BTCD has been rejected by this resistance and has been falling. The 42.5% resistance area is also the 0.382 Fib retracement resistance level, increasing its significance.
Despite the rejection, technical indicators are still bullish. This is evident by the fact that the MACD is positive and the RSI is above 50.
The two-hour chart suggests that the main support levels are at 41.5%, 41%, and 40.5%. These are the 0.382, 0.5, and 0.618 Fib retracement support levels, respectively.
If the upward movement is to continue, BTCD would have to create a higher low at one of these levels.
Long-term structure
The weekly chart provides a bullish outlook. This is visible due to the considerable bullish divergence that has developed in both the RSI and MACD (green lines). Such divergences very often precede significant upward movements. The fact that the divergence is present in the weekly time frame only serves to enhance its significance.
In this time frame, the main resistance levels are at 52.5%, 56.5%, and 60.5%.
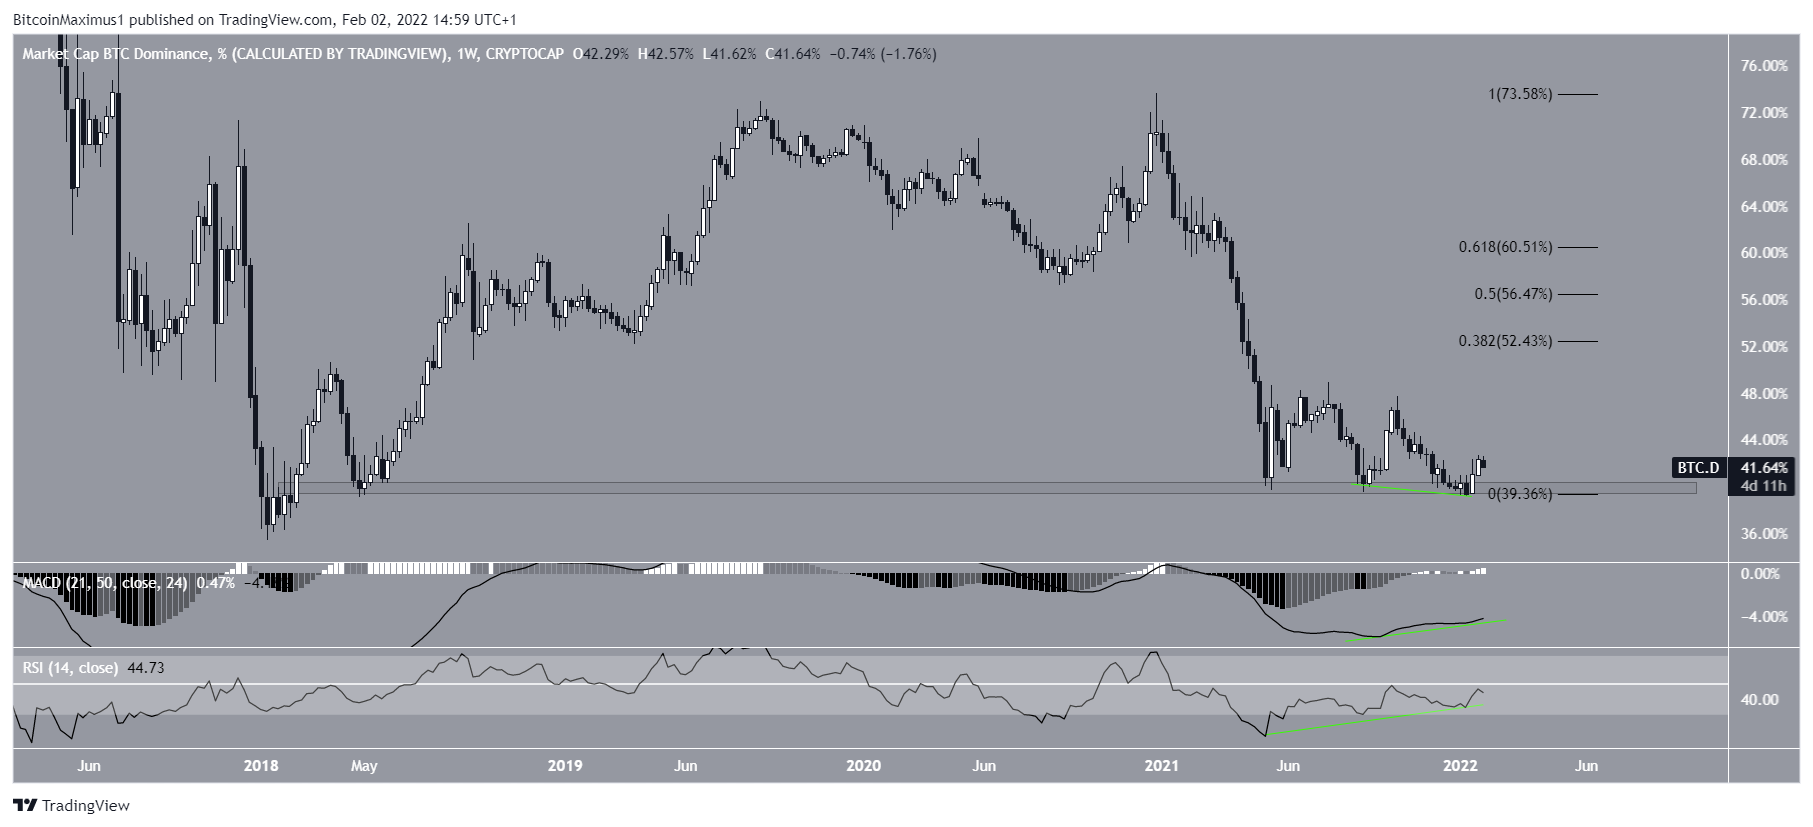
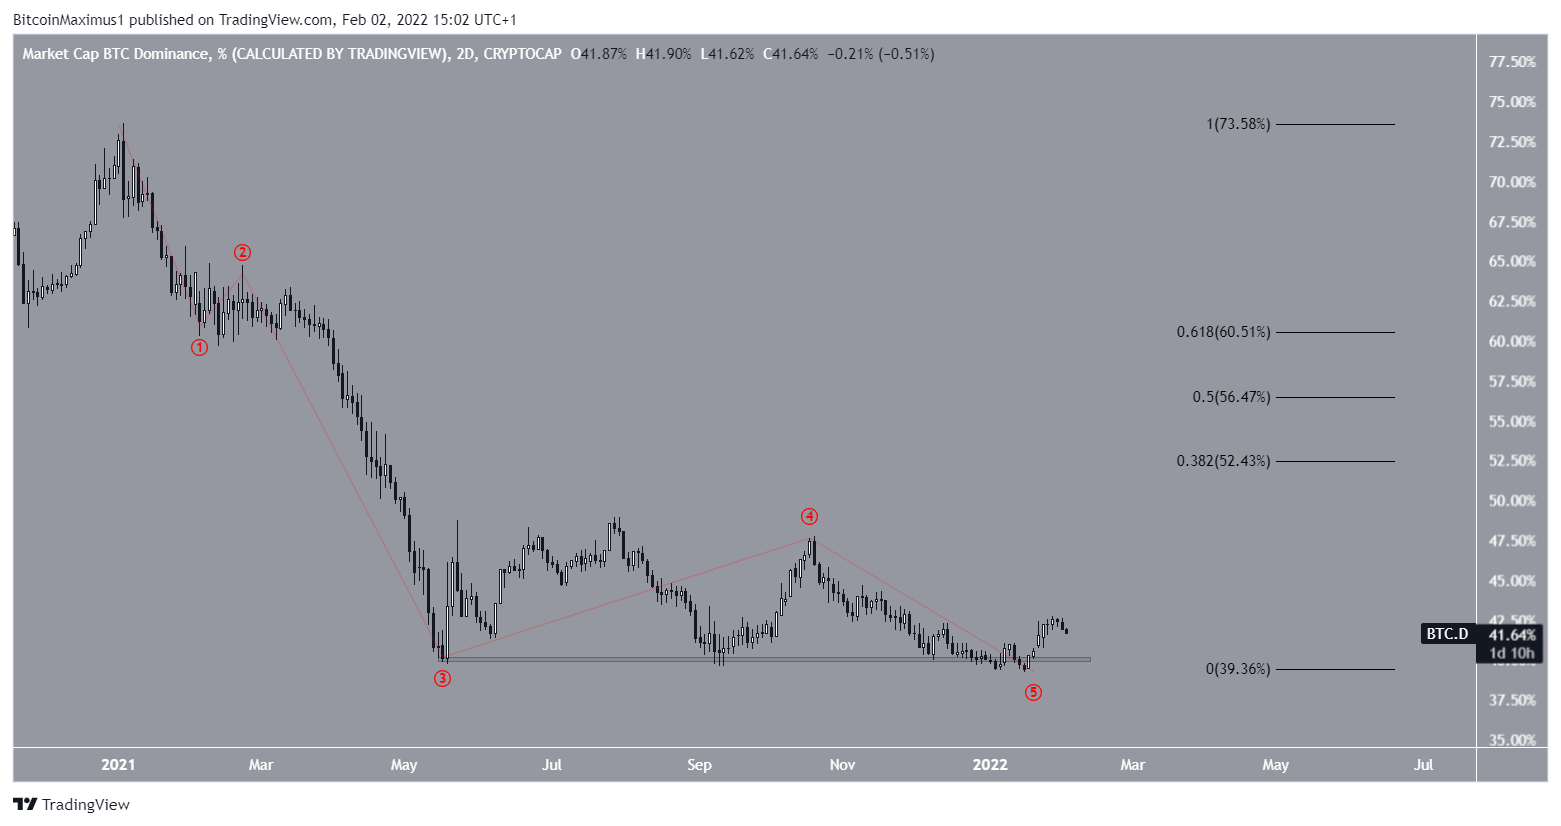
The wave count since Dec 2021 further supports this possibility, since it shows a completed five waves down.
Therefore, it is possible that BTCD has already reached a long-term bottom.