Technical indicators suggest that the Bitcoin dominance rate (BTCD) could be in the first stages of a long-term bullish reversal.
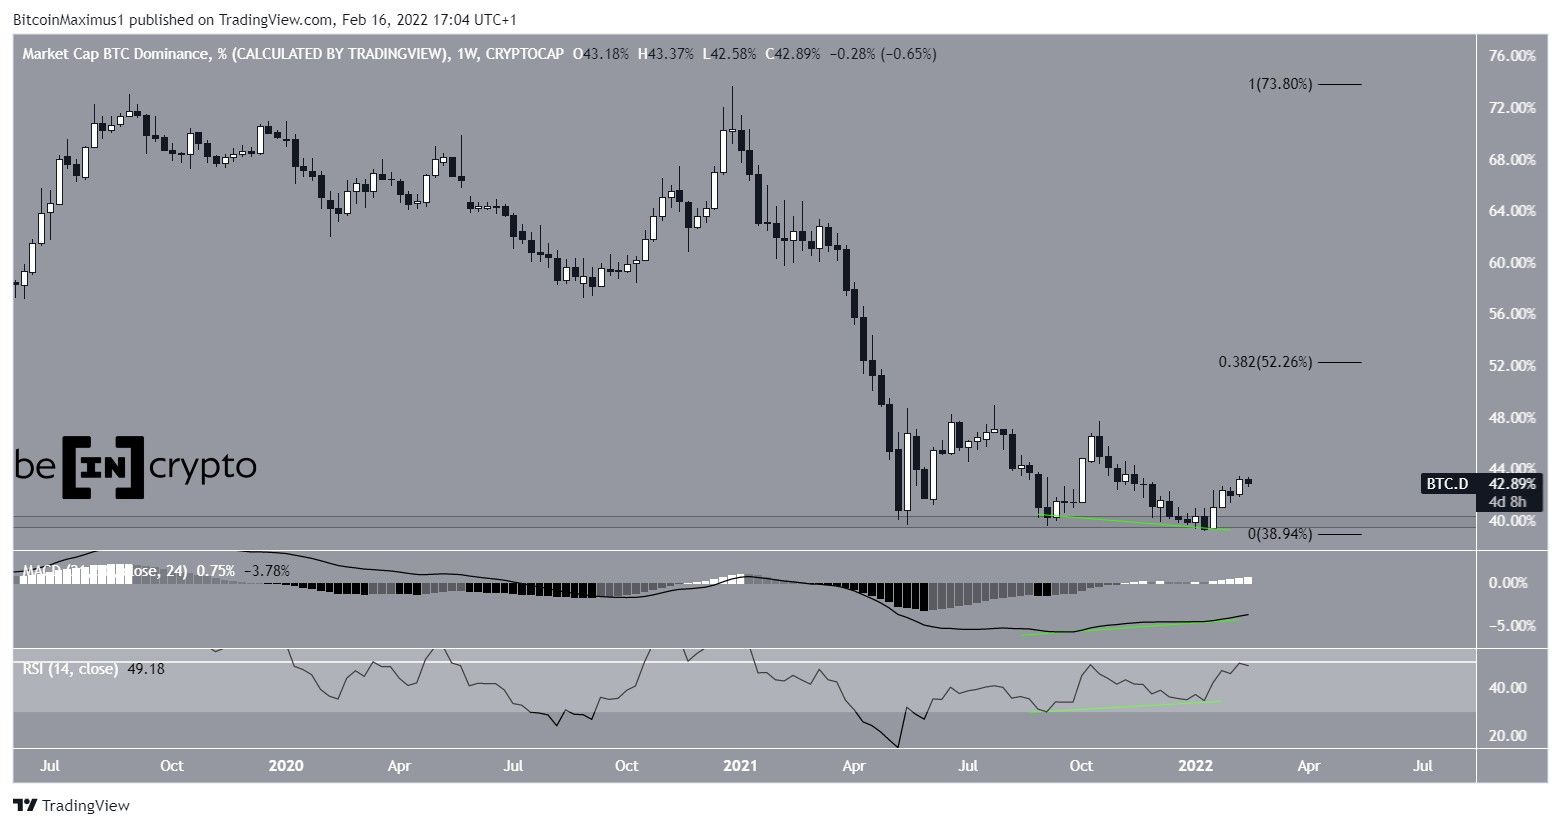
The weekly chart shows that BTCD has bounced at the 40% horizontal support area multiple times, in May and September 2021 and January 2022. Bitcoin dominance has not reached a close below this horizontal area since early 2018.
In addition to this, technical indicators support the continuation of the rebound, especially when looking at the bullish divergences that are present in both the RSI and MACD. Such divergences in the weekly time frame are somewhat uncommon.
If the upward move ensues, the first long-term resistance would be found at 52.25%, created by the 0.382 Fib retracement resistance level.
BTCD deviation and pump
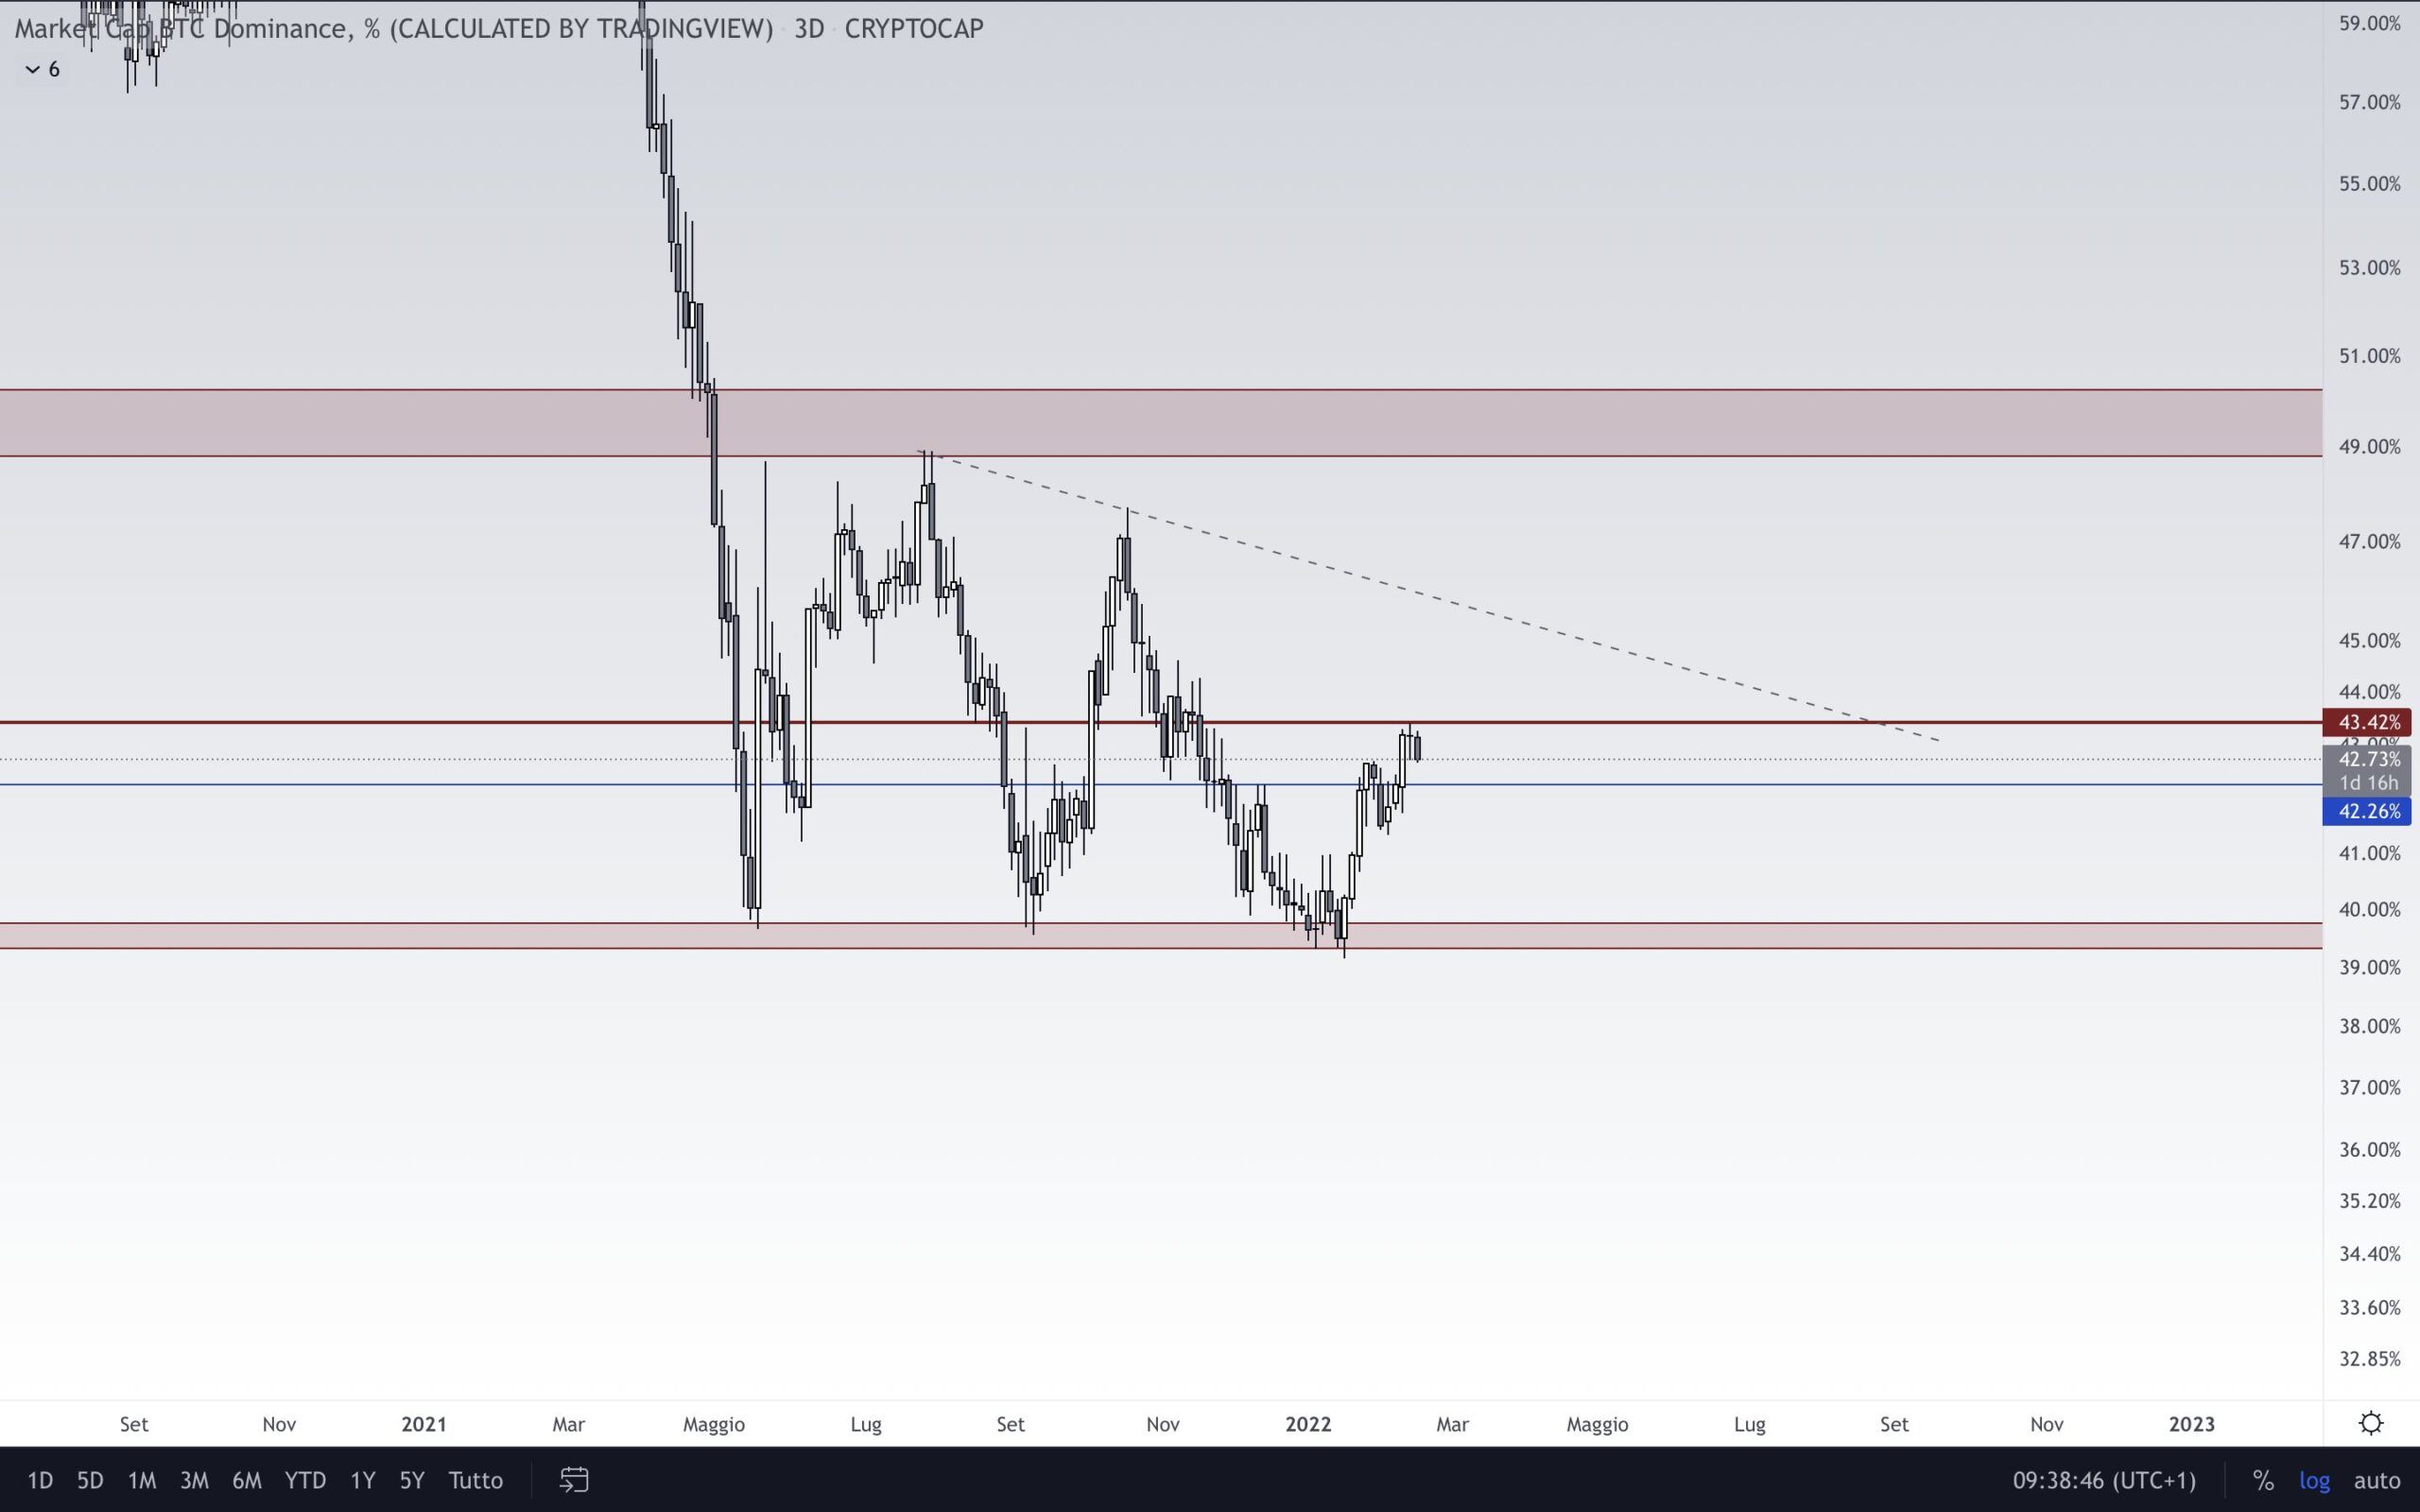
Cryptocurrency trader @eliz883 tweeted a BTCD chart and stated that it could likely increase toward a descending resistance line near 45%.
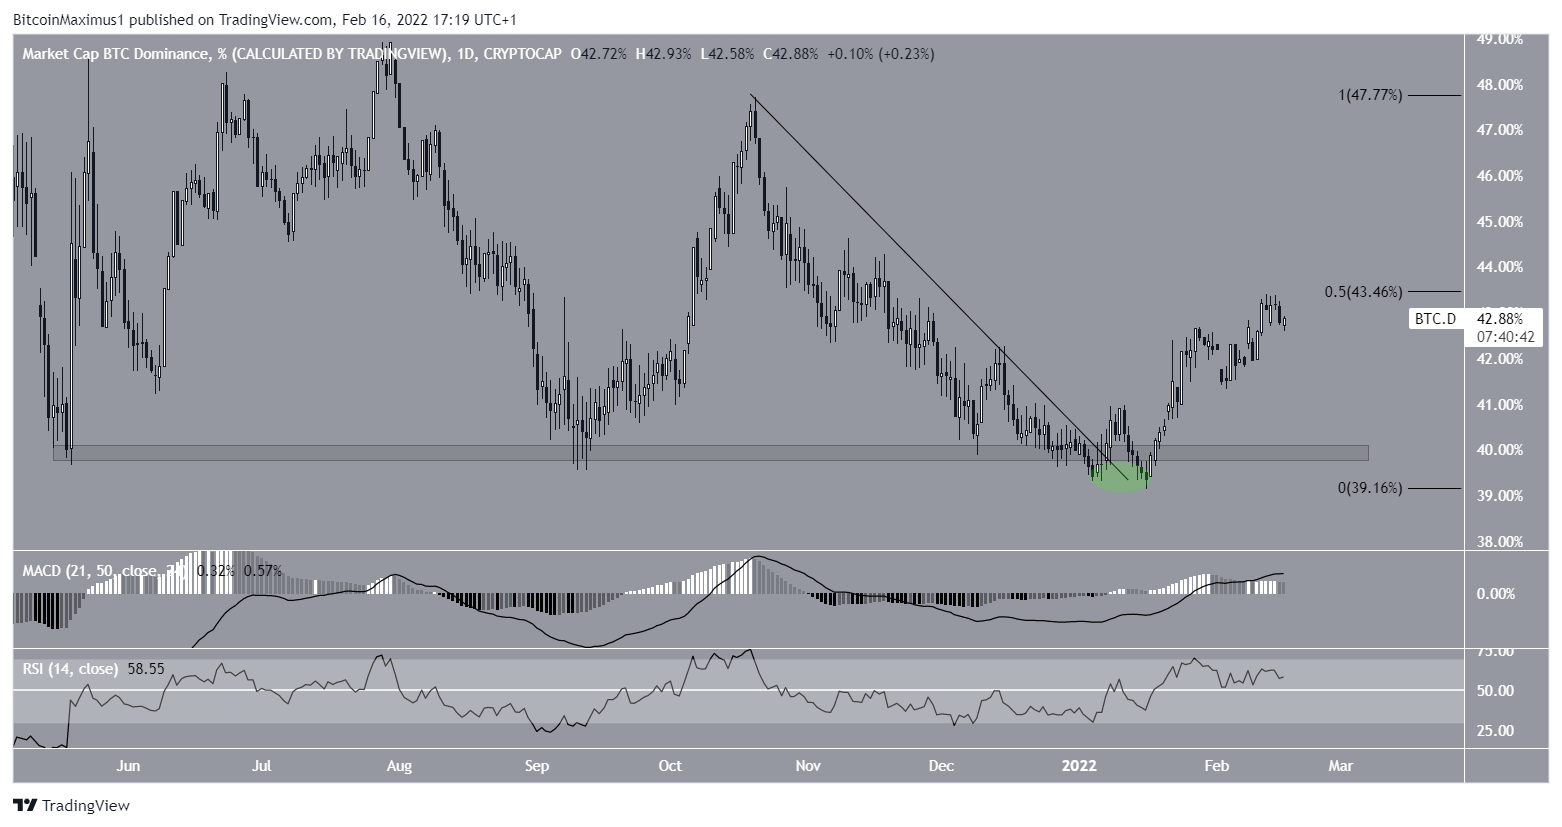
A closer look at the daily charts supports the findings from the weekly overview.
BTCD seems to have deviated (green circle) below the 40% area before reclaiming it afterwards. This is also considered a bullish development and often precedes price increases.
Furthermore, BTCD broke out from a descending resistance line shortly after.
So far, it has managed to reach a local high of 43.50%, but was rejected by the 0.5 Fib retracement resistance level.
Similar to the weekly time frame, both the MACD and RSI are increasing and bullish. However, neither has generated any bullish divergence.
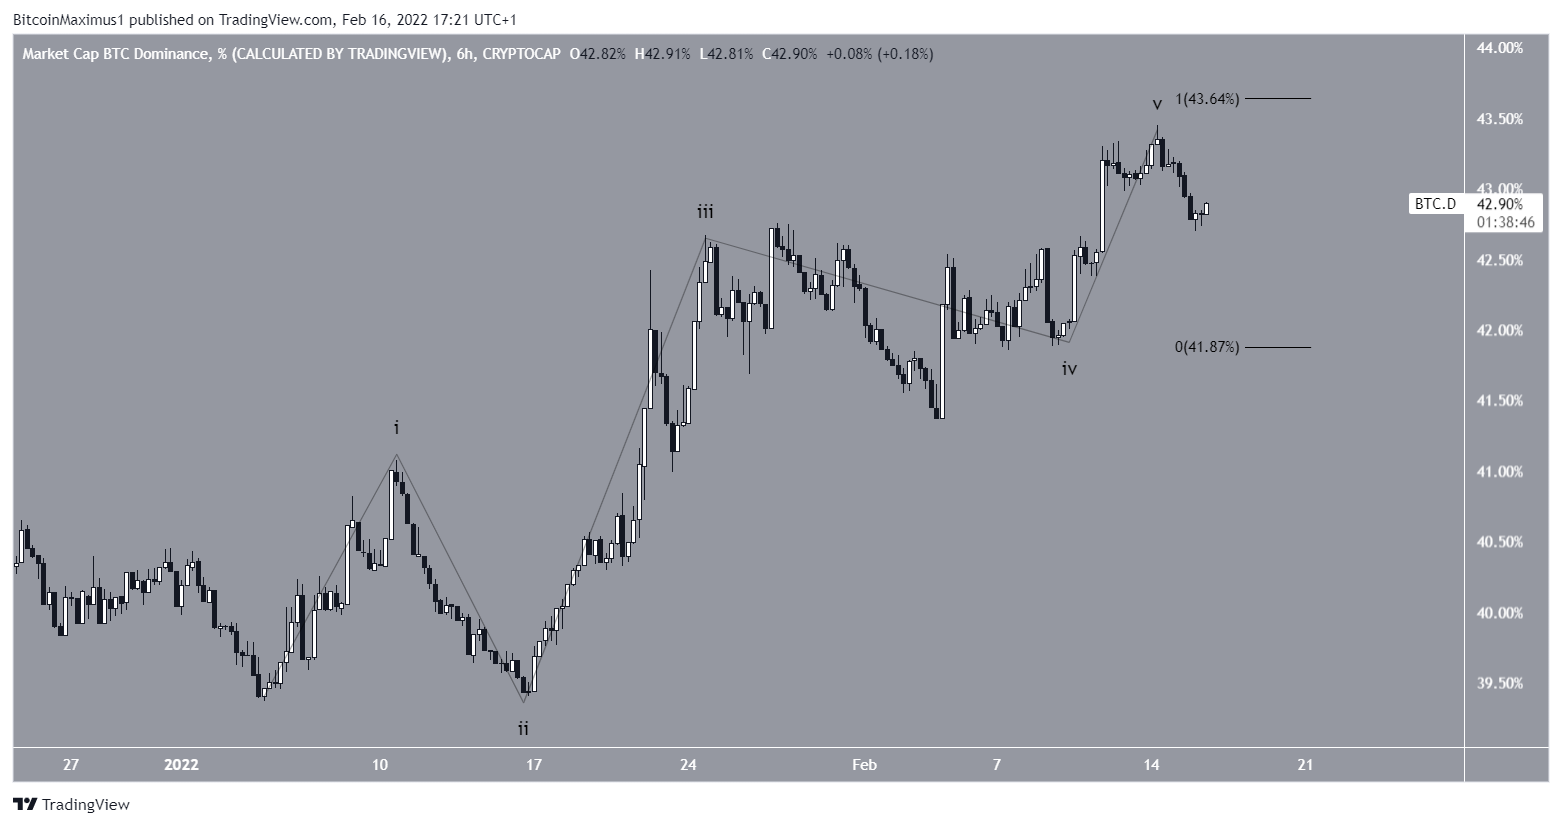
Short-term movement
The six-hour chart shows a completed five-wave upward move (black). In this pattern, waves one and five were nearly equal, while wave three extended.
What follows after a five wave increase is usually a correction.
Therefore, it’s possible that BTCD will correct in the short-term, before eventually resuming its upward movement towards the 52.30% target.