


The bitcoin dominance rate (BTCD) has fallen below numerous long-term support levels, reaching its lowest value since 2018.
The BTCD rate is expected to continue moving downwards to eventually reach the closest support level at 39.5%.
Long-term BTCD decrease
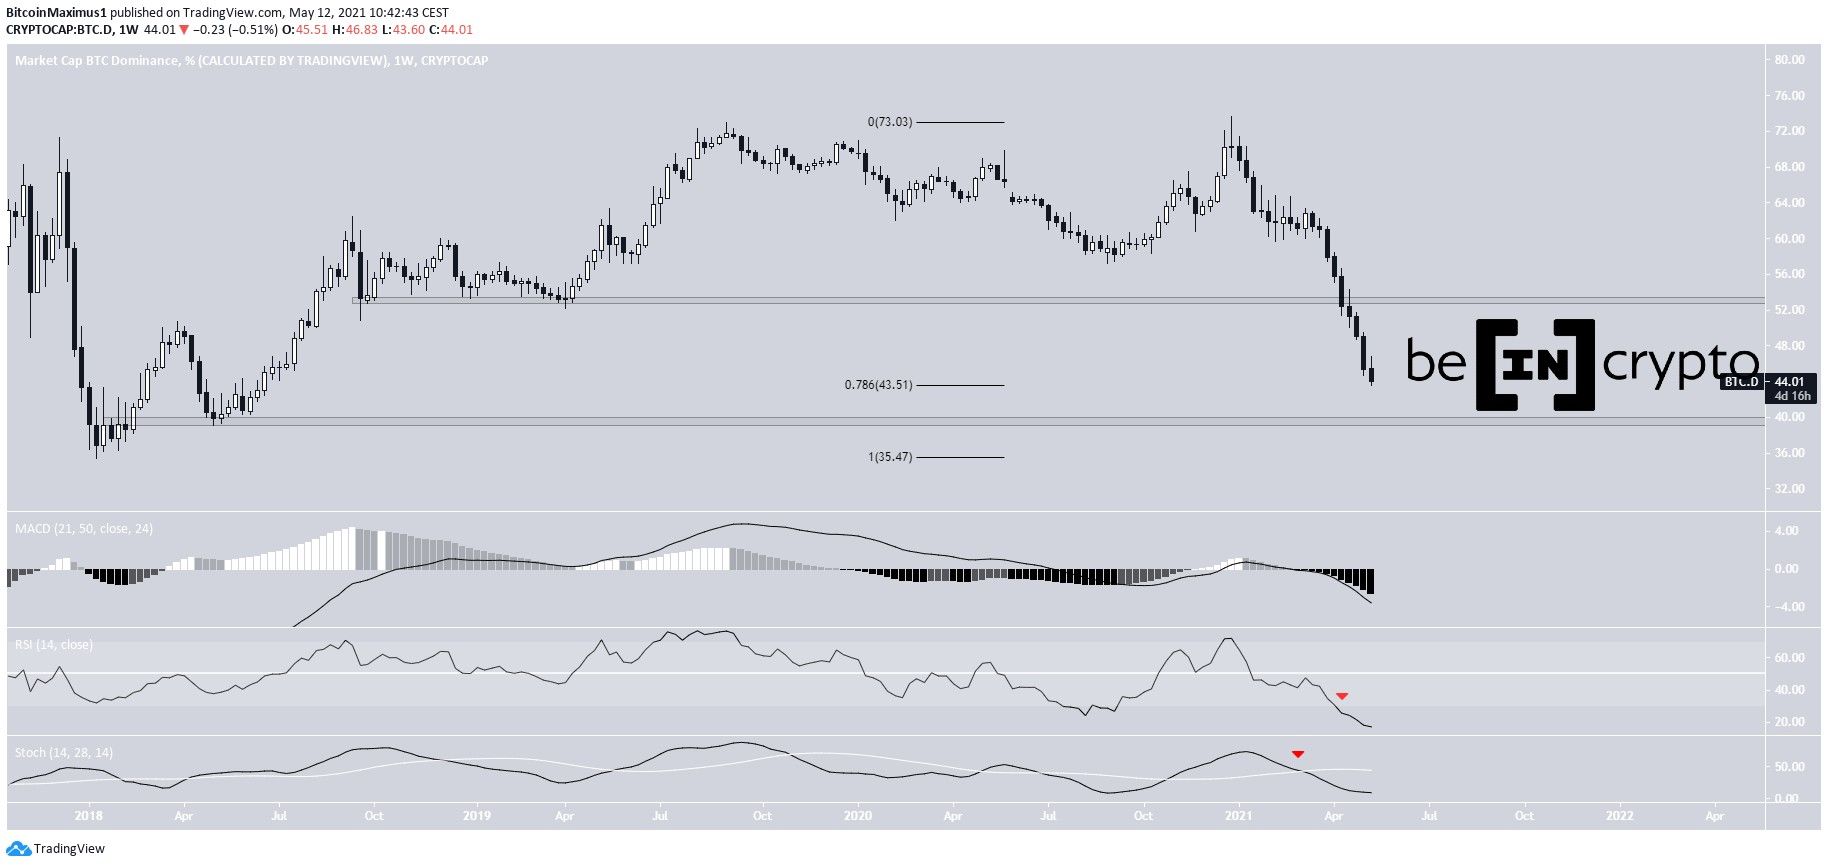
BTCD has been moving downwards since it reached a high of 73.63% in December 2020. Since then, it has decreased by a full 30%.
The rate of decrease really accelerated once a breakdown from the 53% area occurred. Previously, this level had been acting as support since August 2018.
Currently, BTCD is at the 0.786 Fib retracement support level, found at 43.51%. The next support below it is a horizontal level found at 39.5%. This area not been reached since early 2018.
Technical indicators in the weekly time frame are still bearish. The MACD is negative, the RSI has fallen below the 30-line and the Stochastic oscillator has made a bearish cross.
Therefore, the long-term trend is still considered bearish.
Failed BTCD reversal
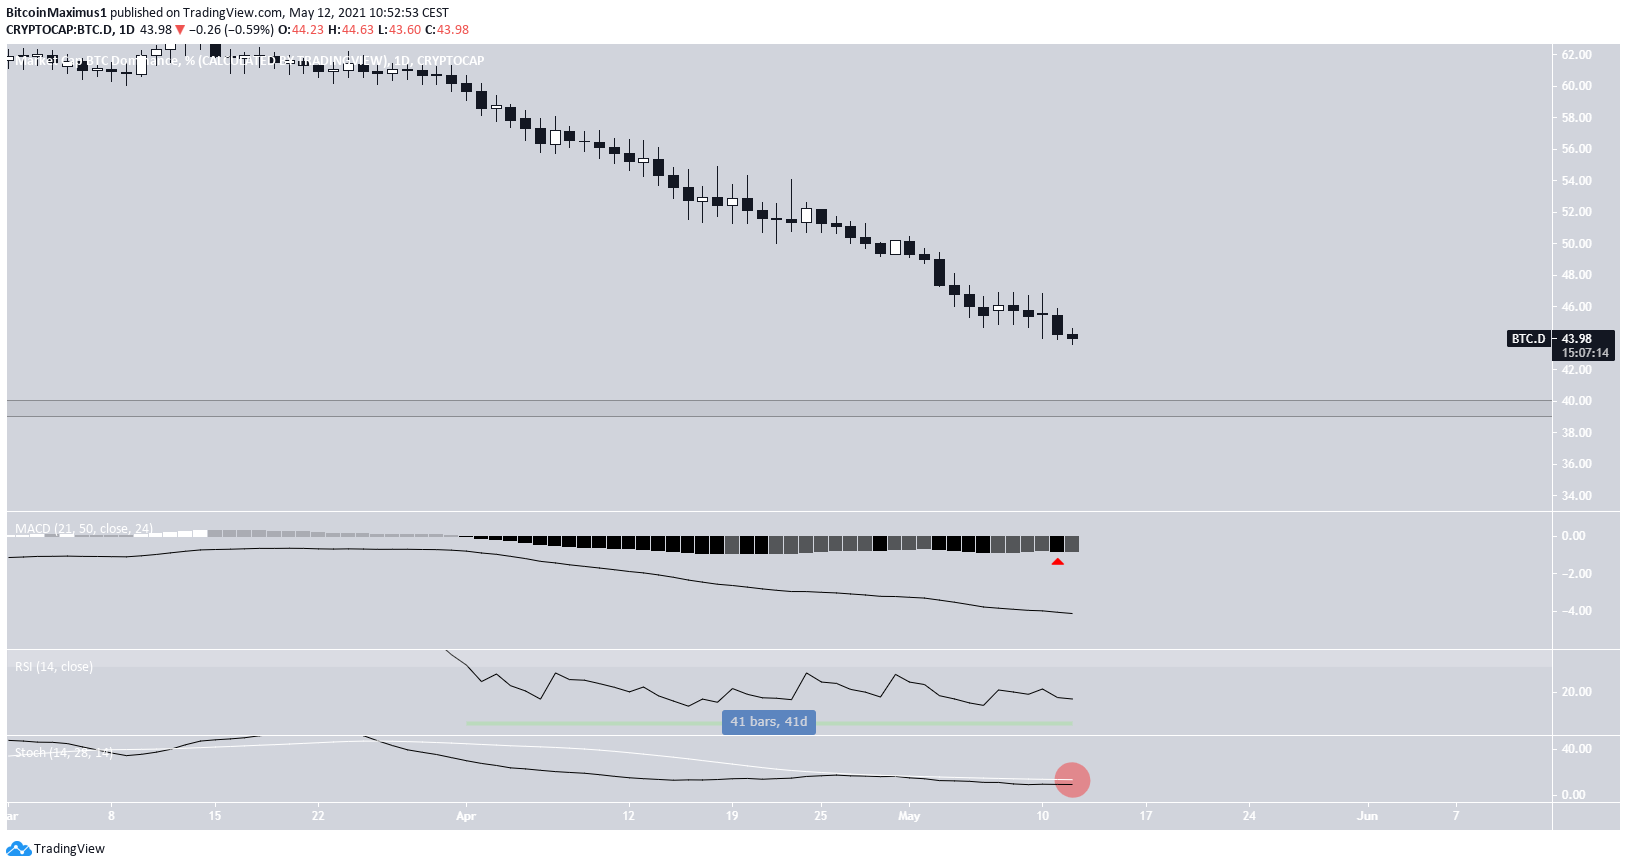
The daily chart does not provide any clear bullish reversal signs.
The MACD has invalidated a potential bullish reversal signal with a lower momentum bar. And, while the RSI has been oversold for a full 42 days, it has not generated any significant bullish divergence yet. Similarly, the Stochastic oscillator has not yet made a bullish cross.
Therefore, the daily chart readings align with those from the weekly time frame, indicating that the trend is still bearish. As a result, further decreases are expected.
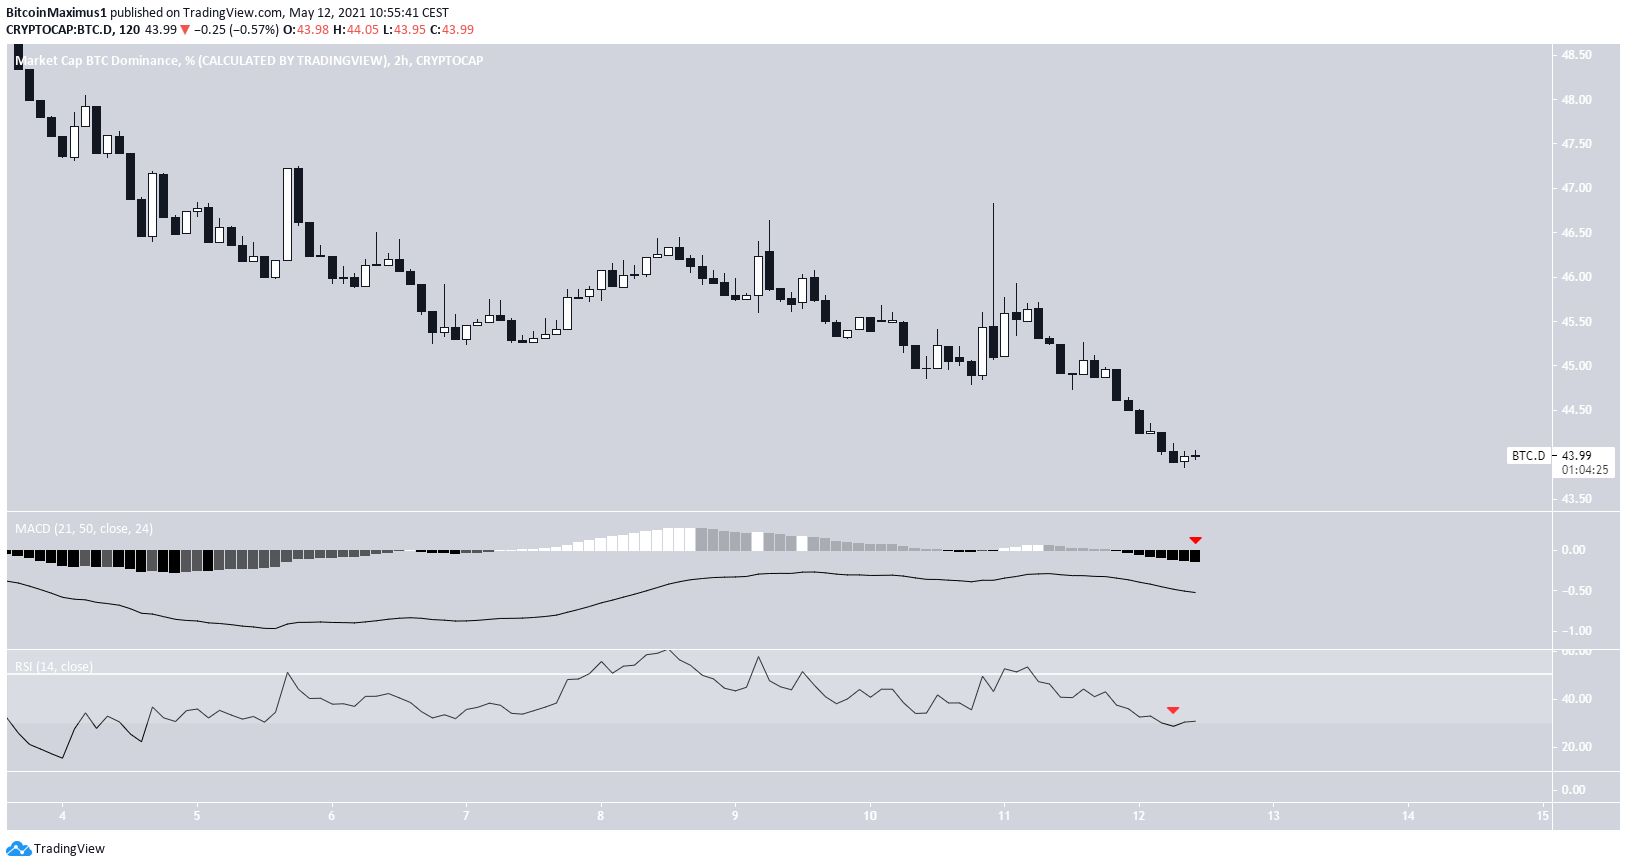
The two-hour chart also provides bearish readings. Both the MACD and RSI are decreasing. The latter is close to breaking down below 30.
Conclusion
The bitcoin dominance trend is still bearish, indicating that the rate could continue decreasing towards the next closest support level at 39.50%.
For BeInCrypto’s latest bitcoin (BTC) analysis, click here.


