
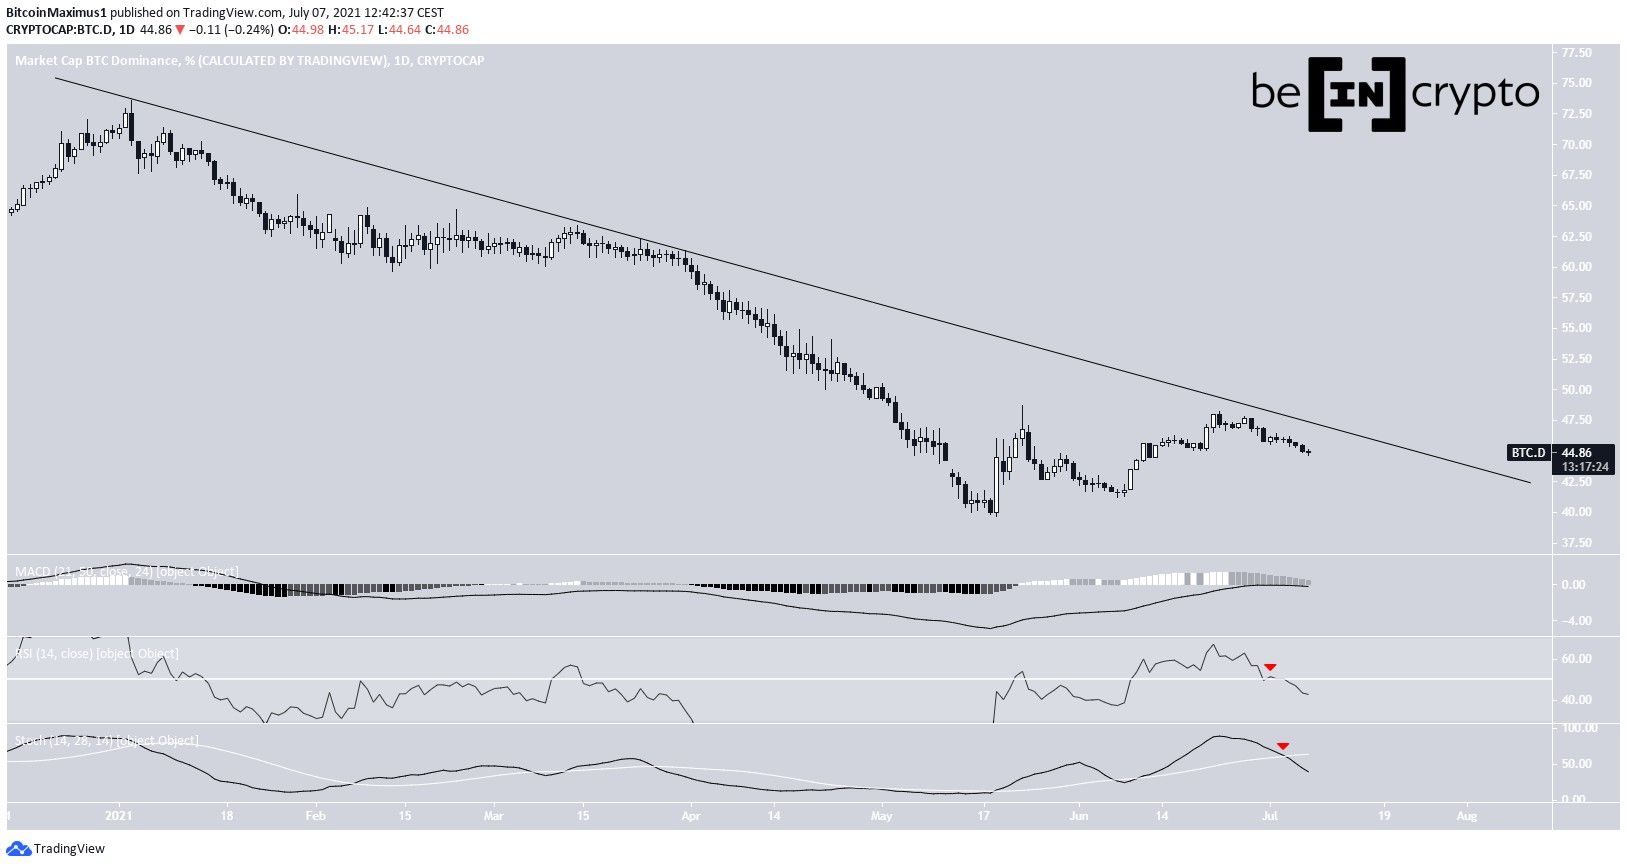
The bitcoin dominance rate (BTCD) has been following a descending resistance line since Jan. 4. Most recently, it was rejected by the line on June 30.
Technical indicators and the trend movement support a continued decrease toward new lows.
Bitcoin dominance descending resistance line
BTCD has been moving downwards since Jan. 3, when it reached a local high of 73.63%. So far, it has touched the line multiple times, most recently on June 27.
Technical indicators are bearish. The MACD histogram is almost negative, the RSI has crossed below 50, and the Stochastic oscillator has made a bearish cross (red icon).
Therefore, a breakout from this line seems unlikely.
For a longer-term outlook, click here.
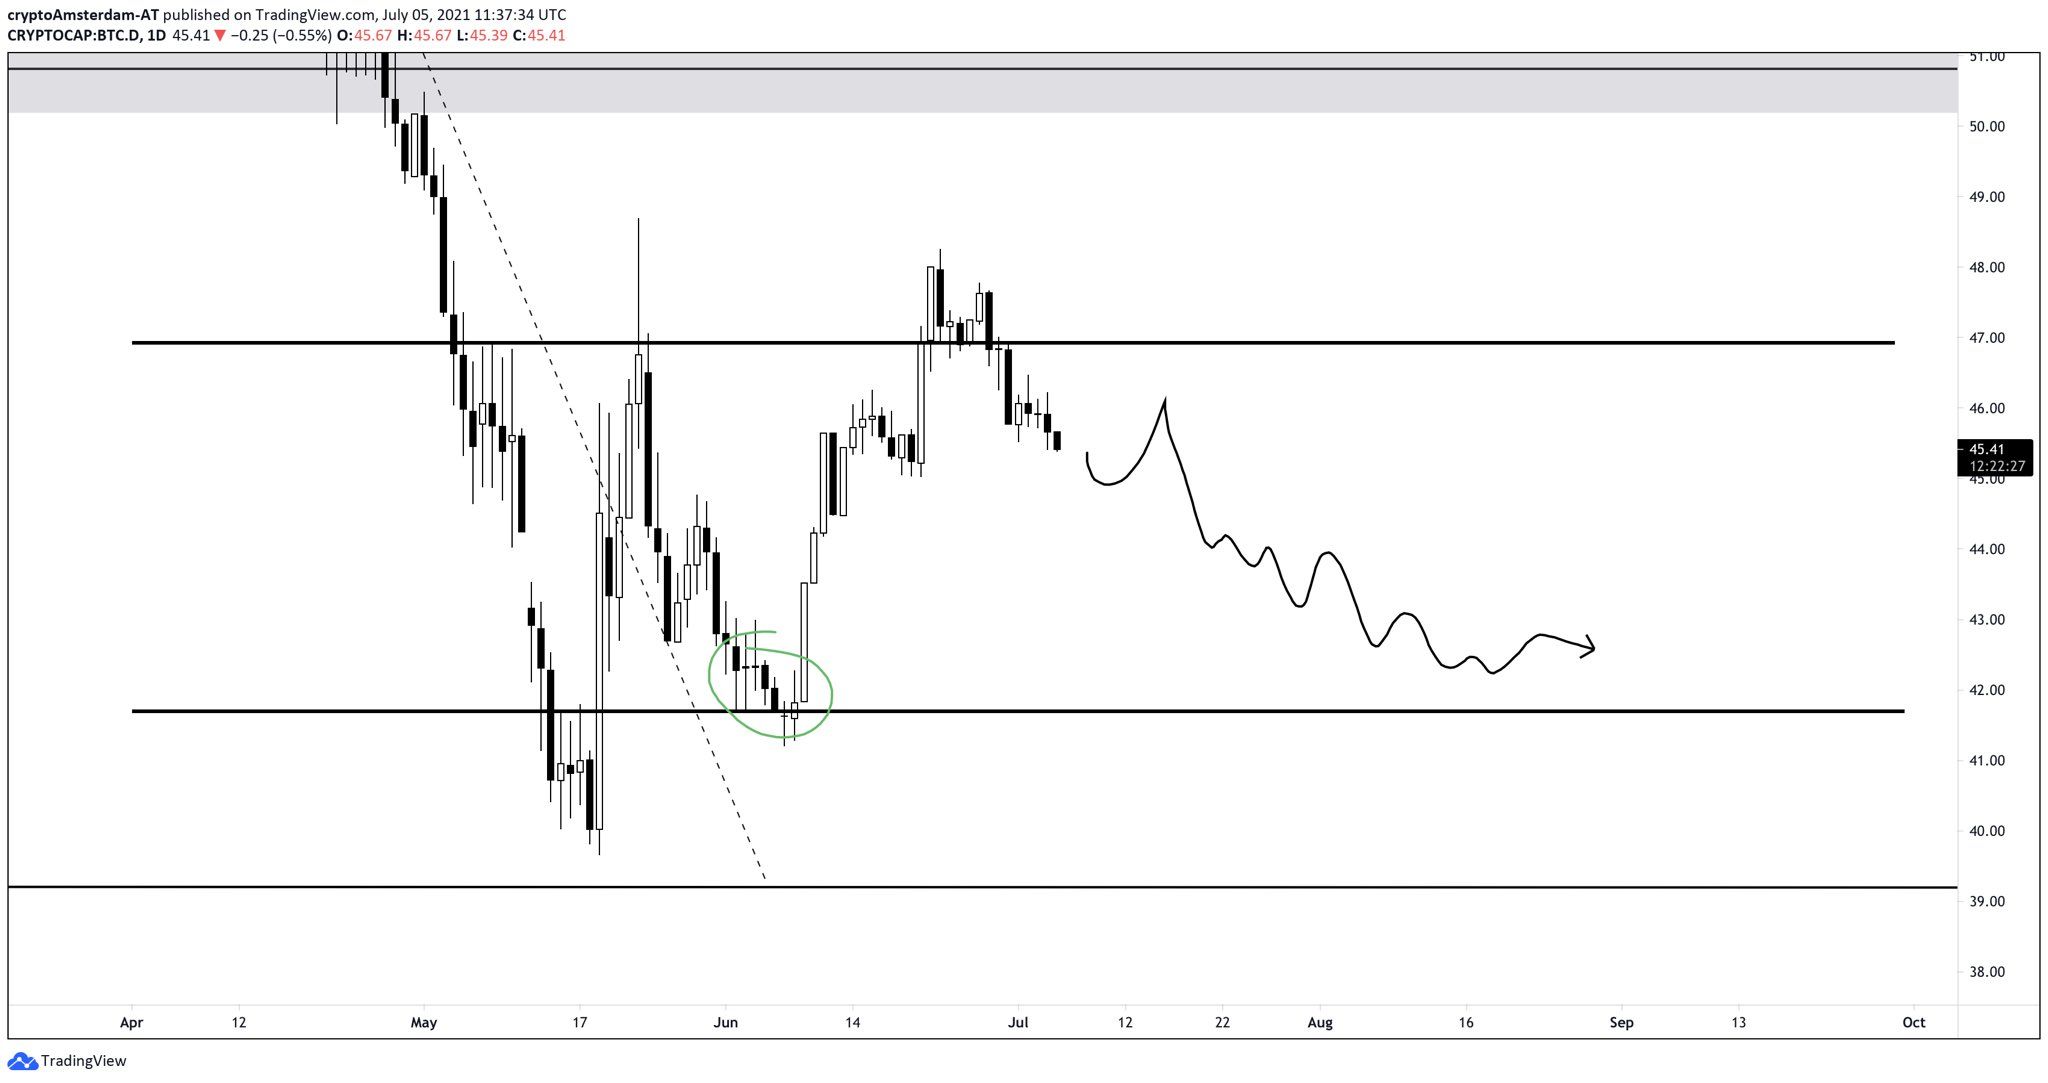
Cryptocurrency trader @Damskotrades outlined a BTCD chart, stating that a decrease towards the 42% area would be likely. This is in line with the reading from the daily time frame.
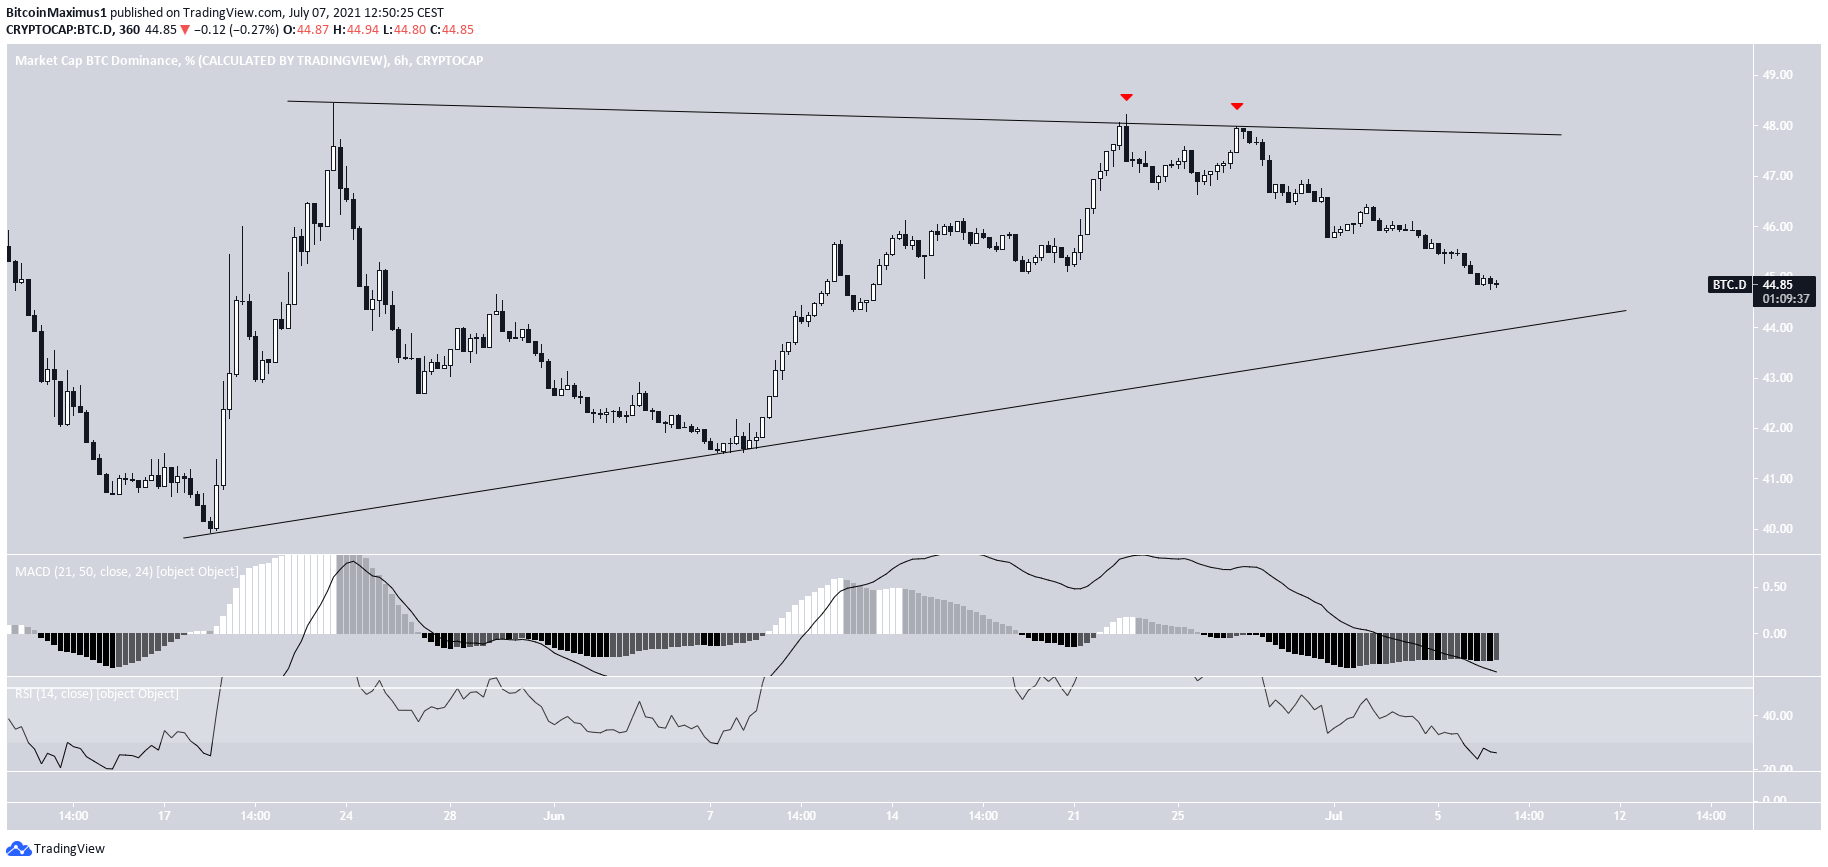
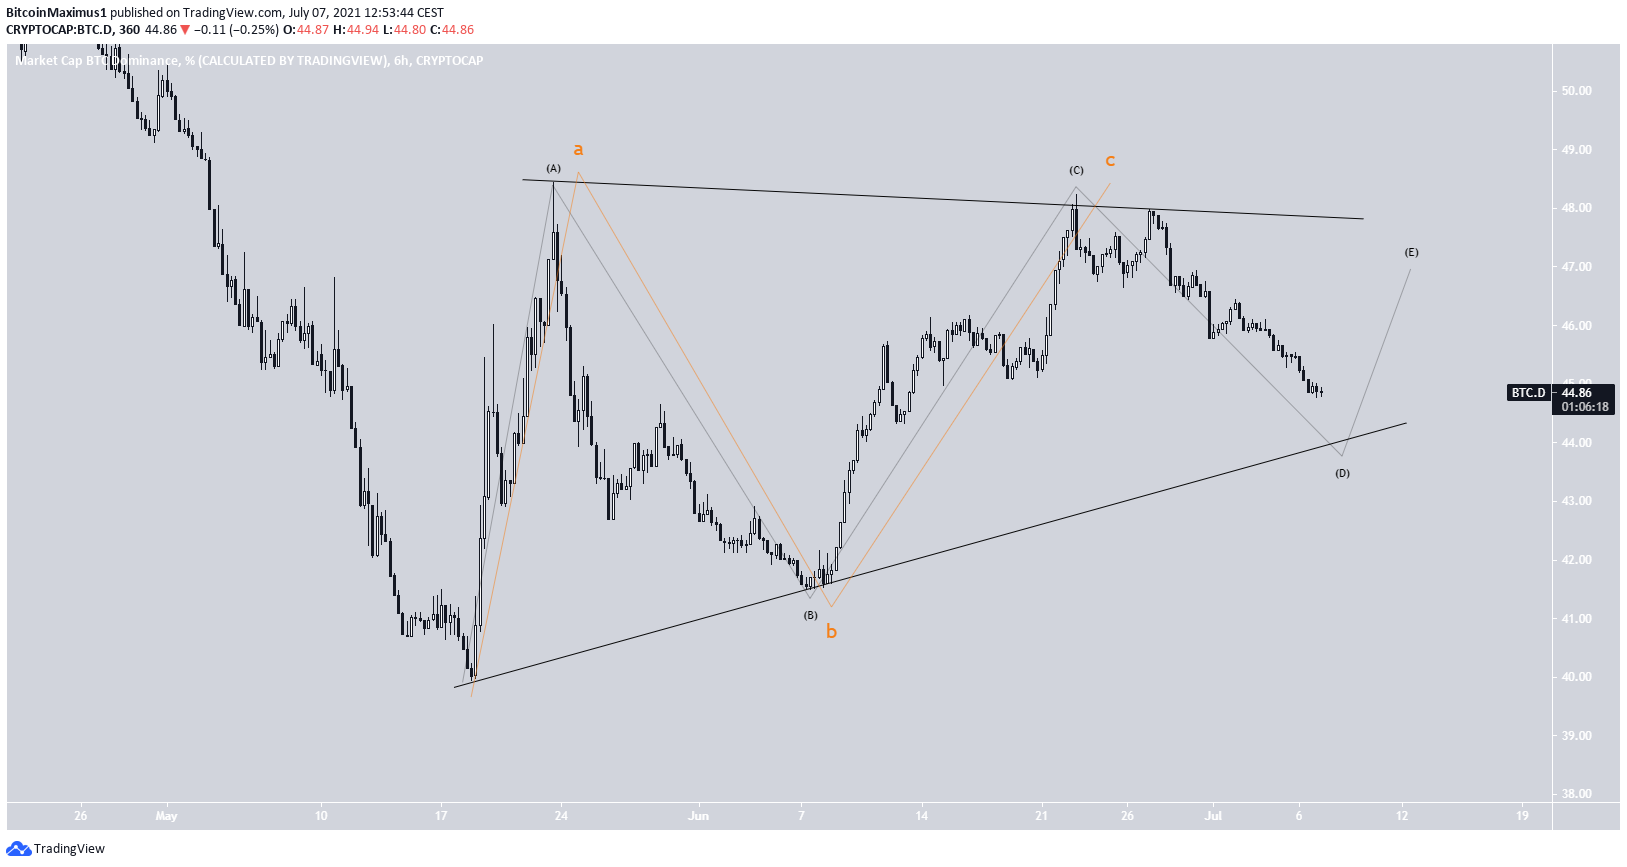
Potential triangle
The six-hour chart shows that the BTCD is potentially trading inside a symmetrical triangle. This is normally considered a neutral pattern. It was rejected by the resistance line of the triangle on June 27 and has been moving downwards since.
Technical indicators are bearish. Therefore, it’s likely that the BTCD will fall to the support line of the triangle.
Wave count
The wave count suggests that the BTCD has been in a bearish impulse since the aforementioned January high.
If this is the case, it appears to currently be in wave four (orange) of this impulse.
The most likely target for the bottom of the movement would be between 34-35%, found by using the length of wave 1 (black) and a Fib projection of waves 1-3 (orange).
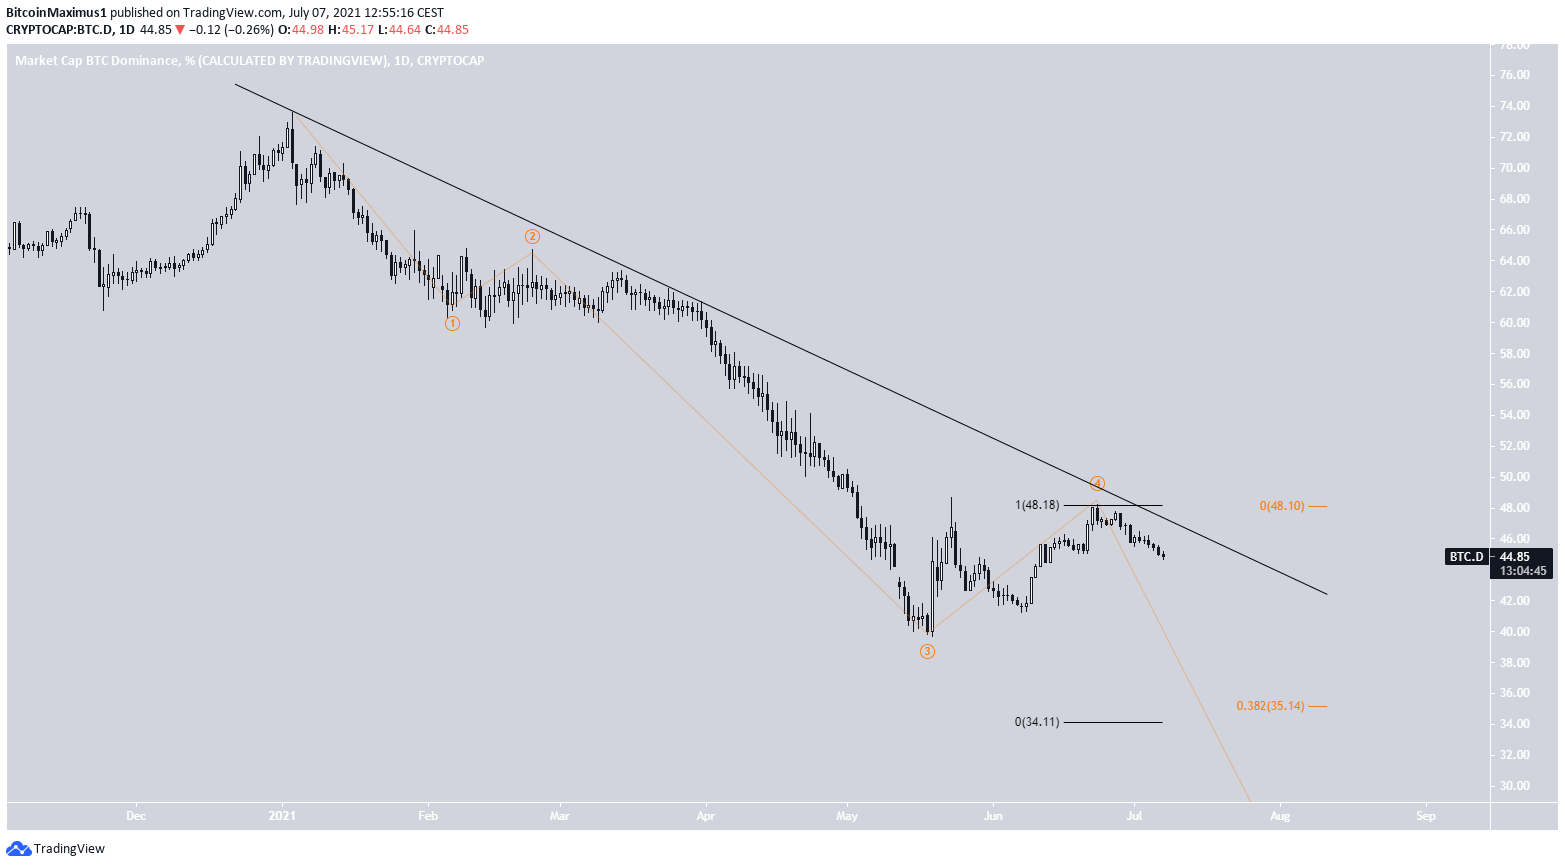
The short-term movement is either a fourth wave triangle, in which BTCD would consolidate for a bit before breaking down, or an irregular flat correction, where it could break down immediately.
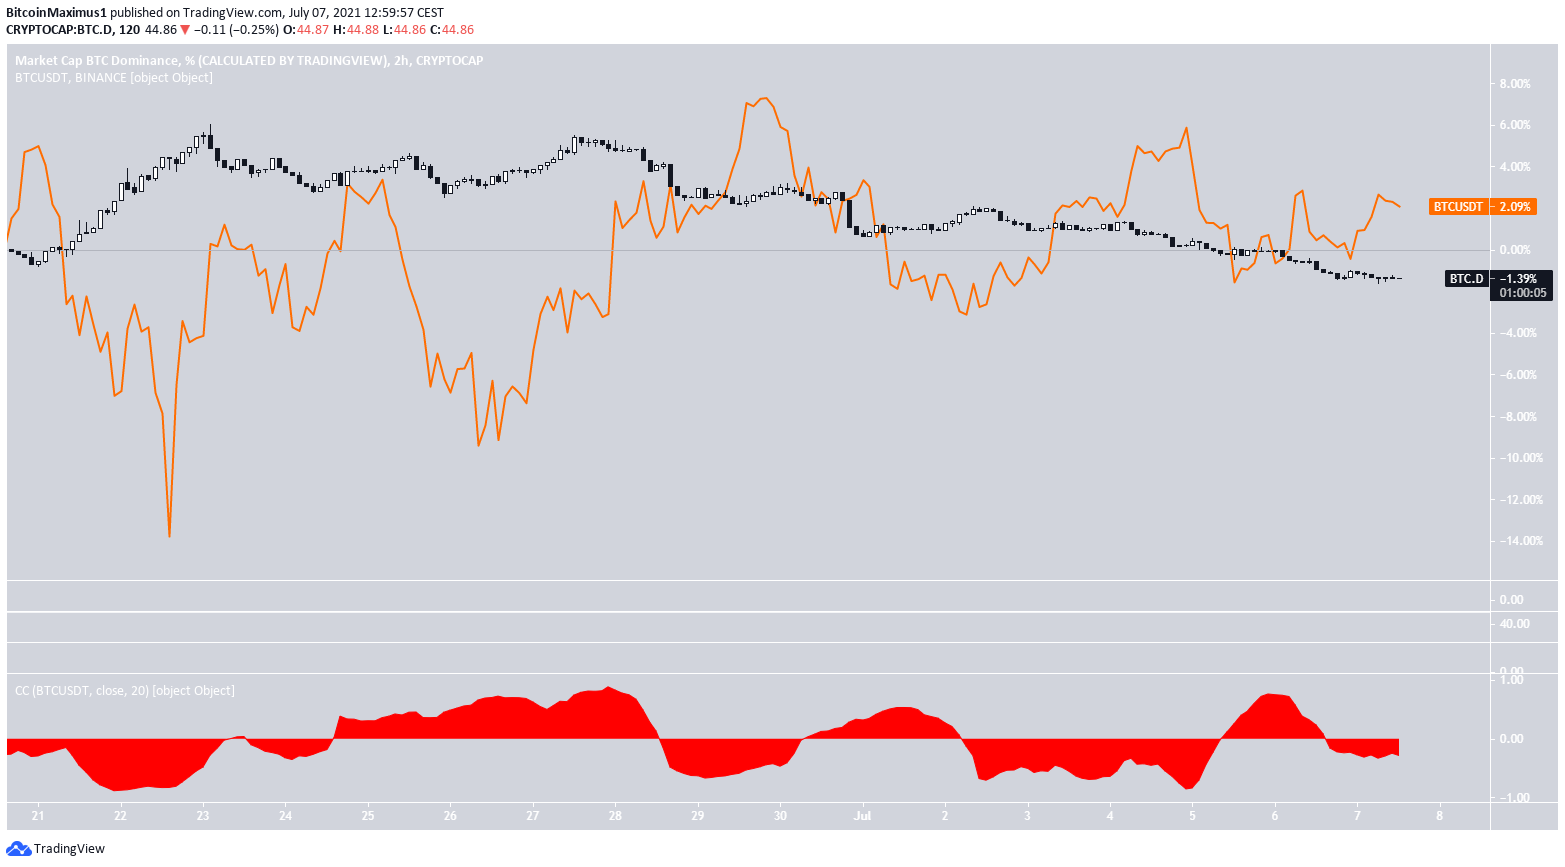
Relationship to BTC
Since June 22, there has been no clear relationship between the BTC (orange) price and the BTCD. This is especially evident by the correlation coefficient (red), which is moving above and below the 0-line.
Therefore, it has yet to be determined whether a BTC price increase could cause an upward or downward movement in the bitcoin dominance rate.
For BeInCrypto’s latest bitcoin (BTC) analysis, click here.
