


The Bitcoin (BTC) price made another all-time high breakout attempt on Dec. 23 but was rejected and has been decreasing since.
However, technical indicators are not all that bearish. Bitcoin is expected to reverse its trend at one of the support levels examined below.
Bitcoin Trend Weakens Slightly
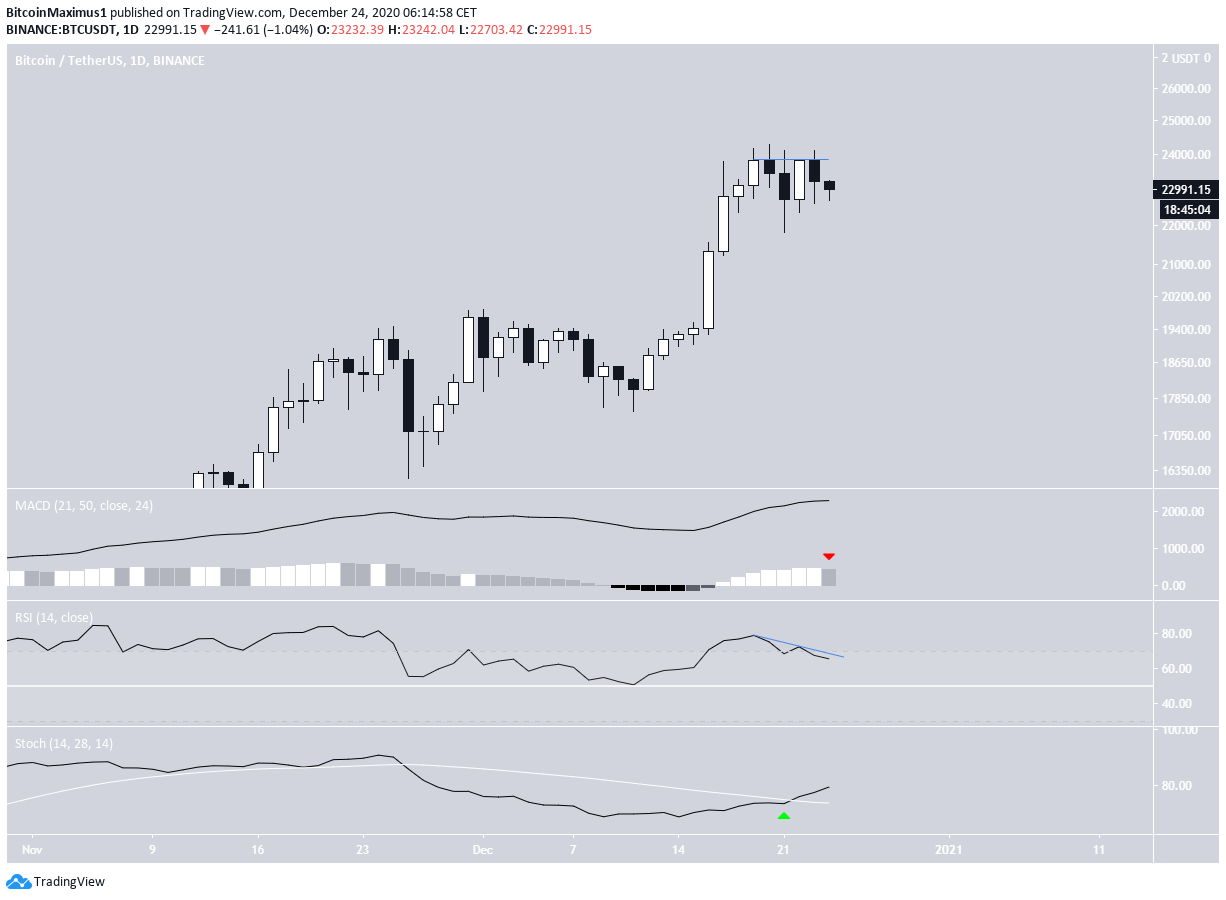
Yesterday, the BTC price reached a high of $24,100 in another attempt at reaching a new all-time high. However, the higher prices could not be sustained. BTC was swiftly rejected and proceeded to drop back to $22,600.
Technical indicators have begun to show early signs of weakness, but are not close to confirming a bearish trend.
The MACD is in the process of creating the first lower momentum bar in nine days, but the daily candle has yet to close.
The RSI has generated a bearish divergence and has begun to fall. It may end up invalidating this with a hidden bullish divergence depending on the daily close. The Stochastic oscillator is still bullish and increasing.
Short-Term Movement
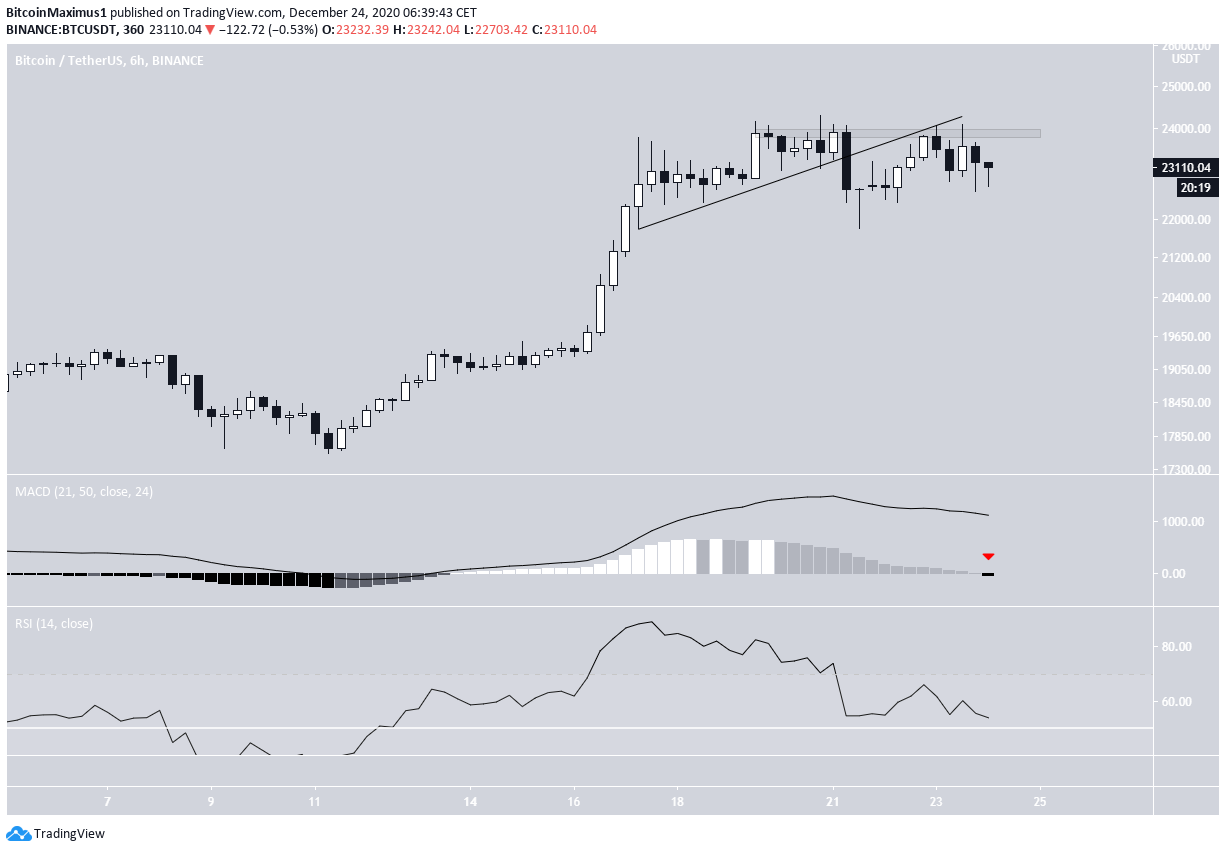
Lower time-frames show that BTC has broken down from an ascending support line and validated it as resistance after. In addition, it’s also facing resistance from the minor $23,950 area.
Technical indicators in the six-hour time-frame are turning bearish but the RSI is still above 50.
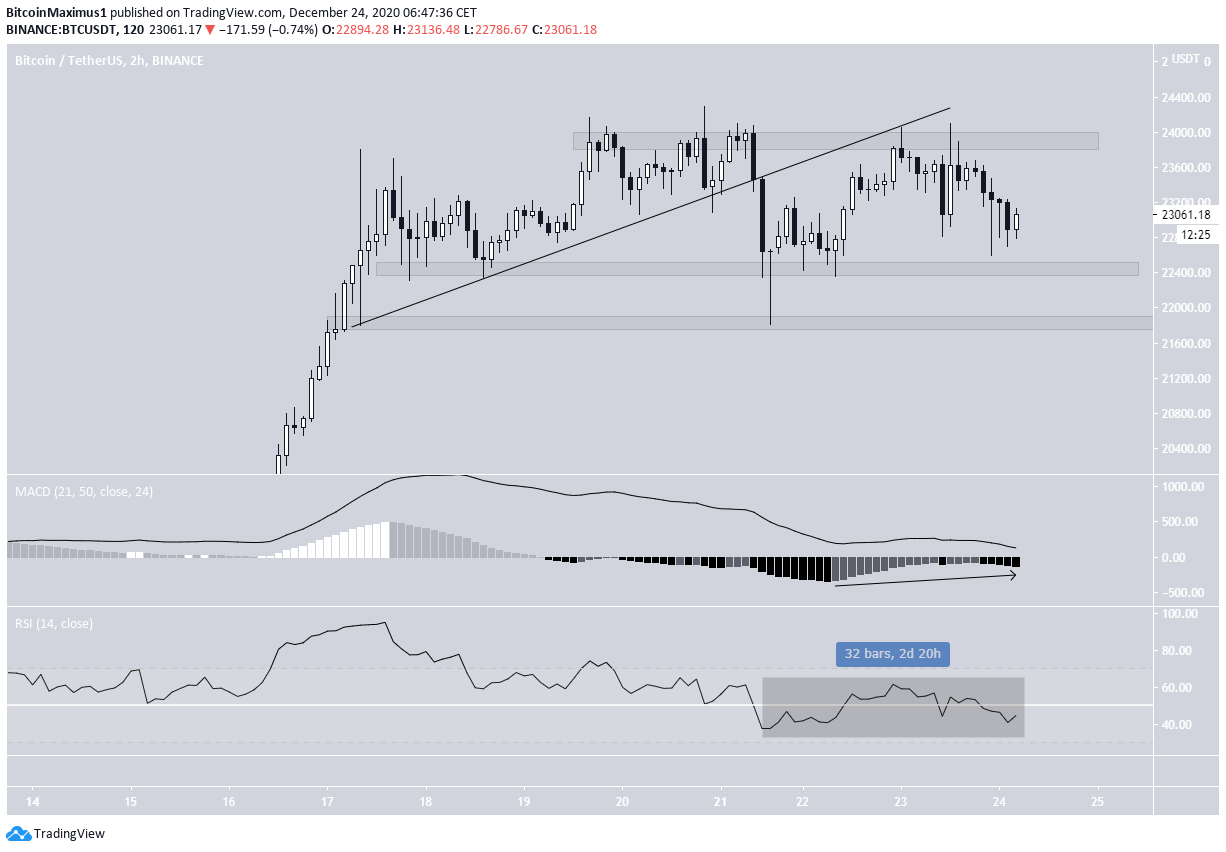
Tthe two-hour time-frame gives two support levels at $22,400 and $21,800.
Indicators show that the price movement is more akin to consolidation than it is to the beginning of a new downward trend.
Therefore, BTC is expected to find support at one of these two levels and begin to move upwards again.
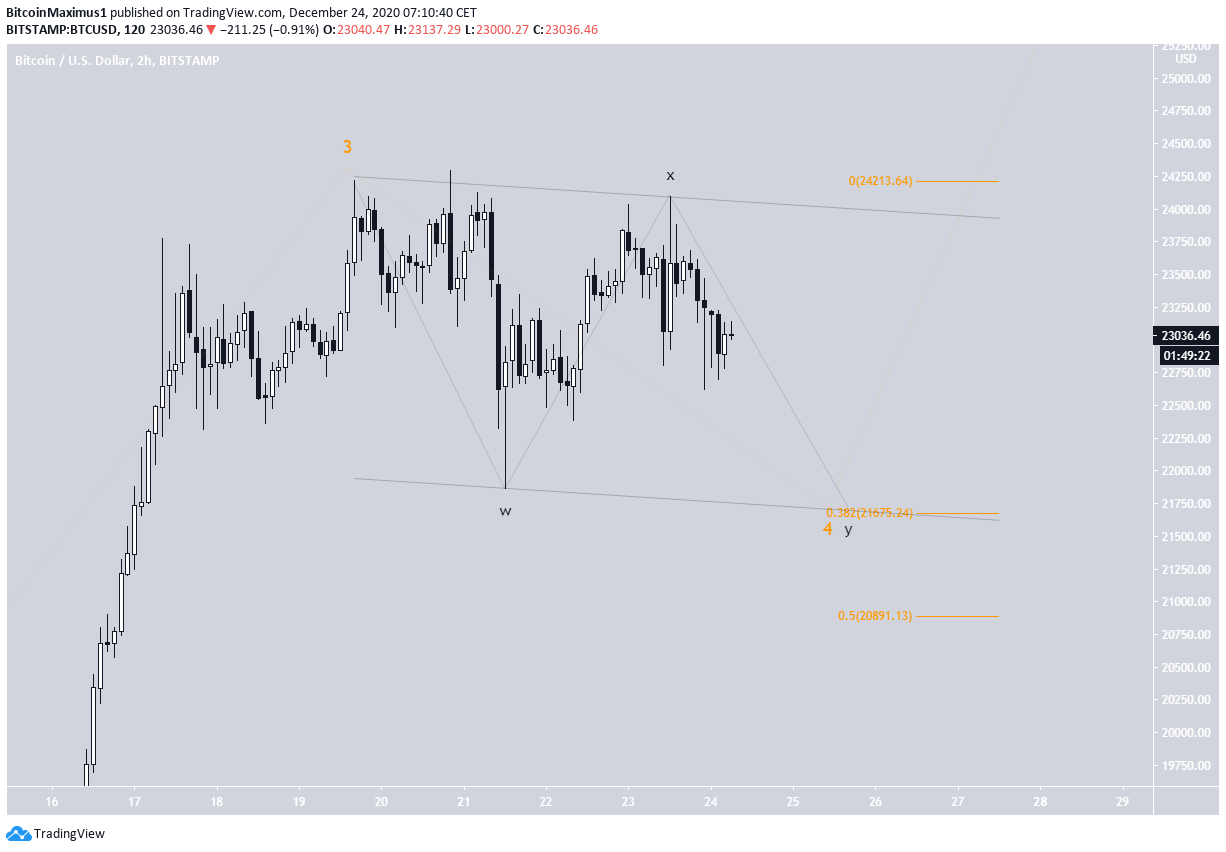
BTC Wave Count
The most likely wave count suggests that BTC is in wave 4, which is expected to end near $21,675 (0.382 Fib retracement level).
The reason for the shallow correction is the principle of alternation after the deep retracement in wave 2.
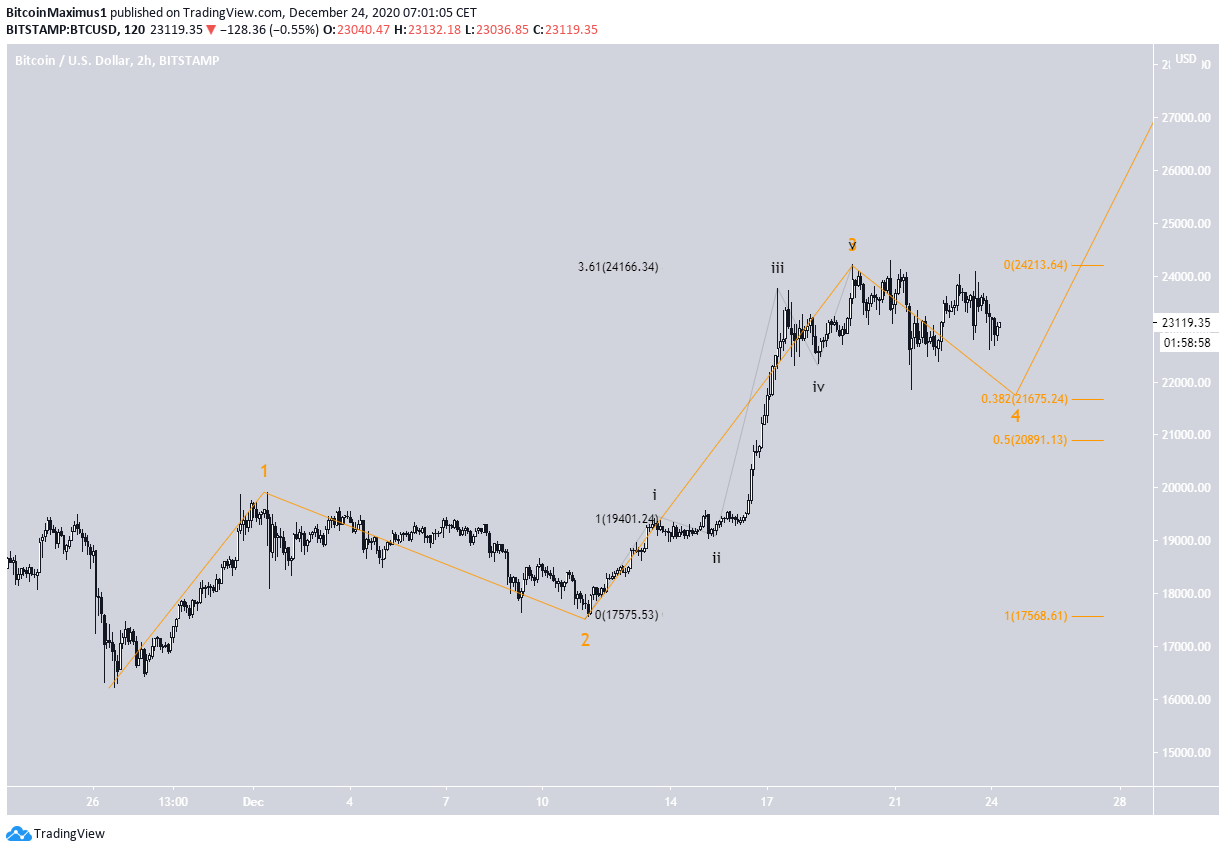
The sub-wave count for the possible wave 4 is shown in black in the chart below. A parallel channel connecting the highs and lows gives a very similar target, strengthening the possibility that BTC will reach a low near $21,675.
Conclusion
The Bitcoin (BTC) price is expected to reach a low near $21,675 and begin to move upwards after.
For BeInCrypto’s previous Bitcoin (BTC) analysis, click here!
Disclaimer: Cryptocurrency trading carries a high level of risk and may not be suitable for all investors. The views expressed in this article do not reflect those of BeInCrypto.


