


The cycles of financial markets, and the cryptocurrency market, in particular, are characterized by a peculiar asymmetry. A bull market usually ends with extreme euphoria, which leads to a short-lived parabolic surge in price. The faster the increases at the end of the bull market, the greater the chance of ending the speculative bubble. Bulls are violent and impulsive.
In contrast, the end of a bear market takes a long time, the formation of a bottom is slow, and states of psychological fear and despair can persist for months. Countless attempts to buy the absolute bottom and enter at the seemingly best possible moment regularly end in even greater losses and pain. Bears are slow and systematic.
However, both components of the complete market cycle have one thing in common – we can only determine absolute peaks and bottoms in hindsight. They never seem obvious at the time of their formation, since at the extremes most investors see only further increases or further decreases.
In today’s analysis, BeInCrypto examines the ongoing bear market and looks for early signals of its end. We ask whether the bottom may have already been in place, or whether the Bitcoin market will face more declines in Q4 2022. Finally, we try to determine how this projects into early 2023 and whether there is a chance for the bulls to take control.
Bearish sentiment and anticipation of a bottom
Well-known cryptocurrency market analyst @intocryptoverse surveyed more than 700,000 of his followers on Twitter. In the poll, he asked the question “How do you feel going into Q4 for #BTC?” and left a choice of 2 answers: bullish or bearish. 11,299 respondents expressed their sentiment, most of whom are set for further declines:
Such results come despite the fact that more and more technical and on-chain indicators suggest that the bottom is near or has already been reached. On the other hand, there are still strong arguments and indicators pointing out that the absolute bottom of this bear market is yet to come.
Regardless, another crypto Twitter analyst, @rektcapital published data on the duration of historical bear markets. According to his calculations, the period during which Bitcoin has been steadily losing value in this cycle has already reached a length comparable to previous bear markets:
- 2013-2014: 413 days from peak to bottom – down 86% from ATH
- 2017-2018: 364 days from peak to bottom – down 84% from ATH
- 2021-2022: 333 days from peak so far – down 74% from ATH so far
“These figures suggest a BTC bottom should take place in the next 1-3 months,” he says.
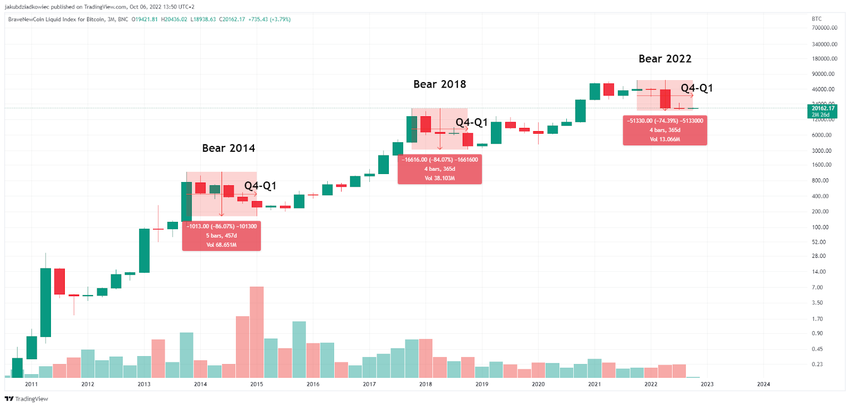
A closer look at the 3-month logarithmic chart of Bitcoin confirms the analyst’s observations. We see that after each BTC historical peak, the bear market persisted for several quarters. Moreover, it usually reached an absolute bottom about a year after the peak, at the turn of Q4 and Q1.
It is also worth mentioning that the bull market never started right after the bottom was reached, but the accumulation continued for another 2-3 quarters. This means that even as the bottom of this bear market has already been in place or is about to be reached, one should still not expect huge increases in the first months of 2023.
Outflows from exchanges – Coinbase case study
Currently, there are many signals that indicate that the Bitcoin market is in the process of bottom formation and accumulation. Many of them relate to activity on exchanges, among which Coinbase is leading the way. Based on the data released this week, we can see that increasing BTC outflows are taking place. In their perspective, the price of Bitcoin has reached a key support level that has historically marked absolute lows.
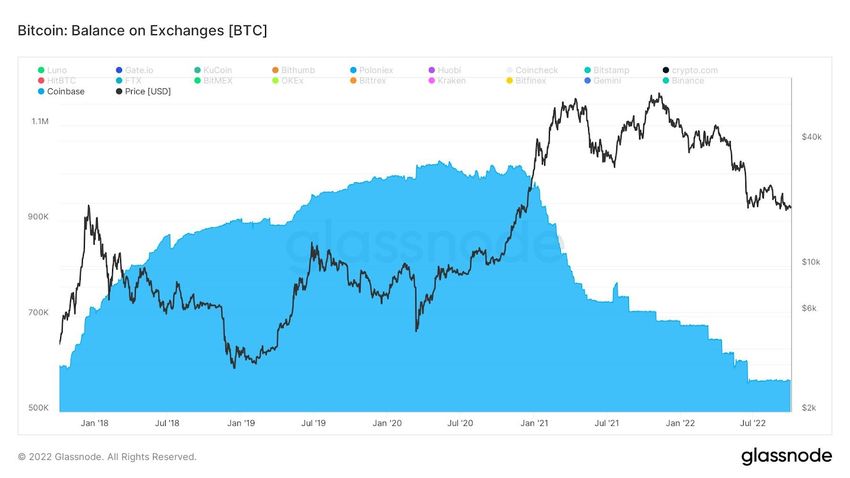
The first chart published by @IIICapital shows how the volume of Bitcoin on Coinbase has been steadily dropping since the beginning of the bull market initiated in Q4 2020. Interestingly, the reversal of the trend in the price of BTC and its declines in 2022 has not stopped the outflow of coins from the exchange at all. Only the period from June to now shows a clear stagnation in the blue chart and relative stabilization of BTC supply on Coinbase.
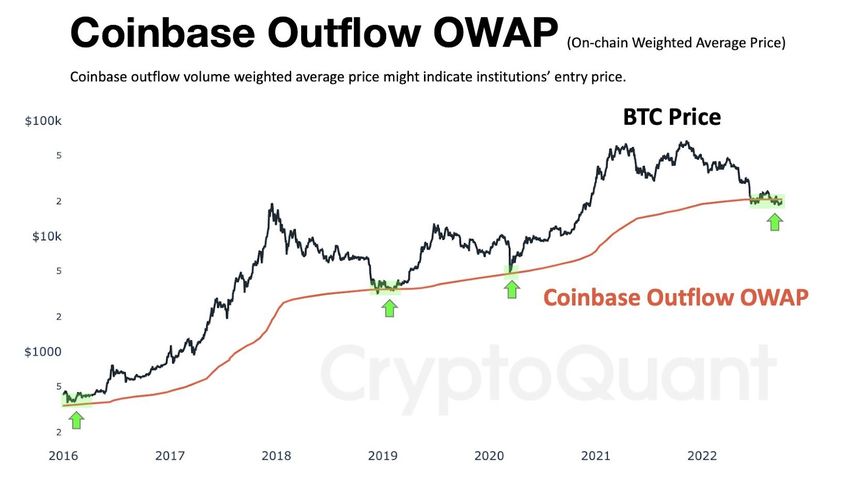
Meanwhile, the second chart, posted on Twitter by analyst @ki_young_ju, makes an argument for a bear market ending. Based on the so-called outflow OWAP (on-chain weighted average price) for Coibase, we can see that the BTC price is today in an area of long-term support.
The orange line captures the approximate entry price of institutional investors who purchased via Coinbase. If it is true that institutions play a key role in the cryptocurrency market, then reaching the light green accumulation area could be a bottom signal.
Bitcoin cycle dynamics and similarities to 2019
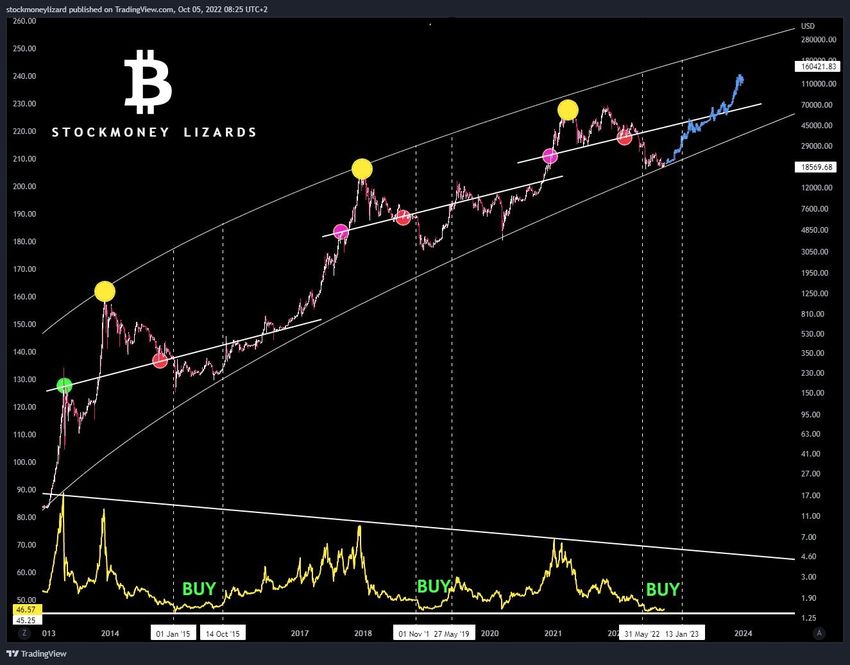
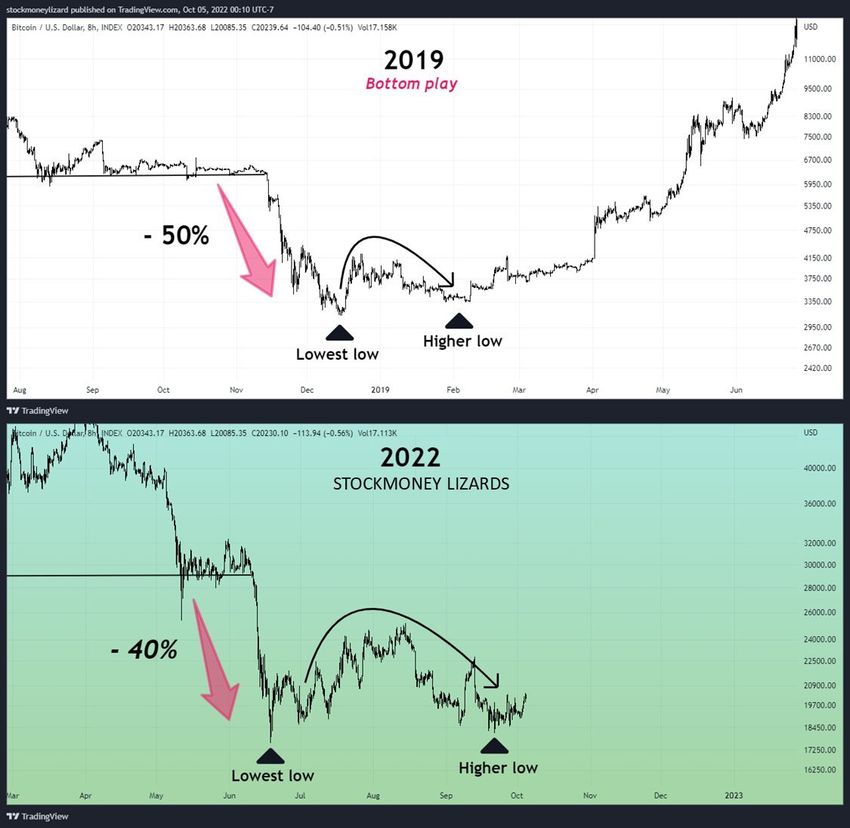
Another strategy for determining the phase of the current bear market is to try to find fractal similarities between the current price action and the 2018-2019 bull market. An interesting analysis in this regard was recently provided by @StockmoneyL, who found parallels in the dynamics of the last 3 cycles.
In his opinion, Bitcoin is currently in a roughly six-month BUY phase. Historically, it has proven to be the period with the least risk and the greatest opportunity for future increases. The optimistic prediction of this analysis is that the $19,000 level will hold as support, and the bottom has already been reached.
The same analyst, in another tweet, juxtaposed a fractal of the BTC price chart from late 2018-2019 and today’s price action. Among the many similarities, noticeable is the sharp drop from the support area of 40-50% and the way the bottom was generated.
In both cases, it can be noted that the initial – and absolute, as it later turned out – low was followed by a higher low in the chart. This was followed by a several-month consolidation phase, and then more dynamic increases. If this scenario were to repeat now, Q4 2022 would be a period of consolidation and accumulation. Only in Q1 2023 could the bull market begin.
Early bottoming signals
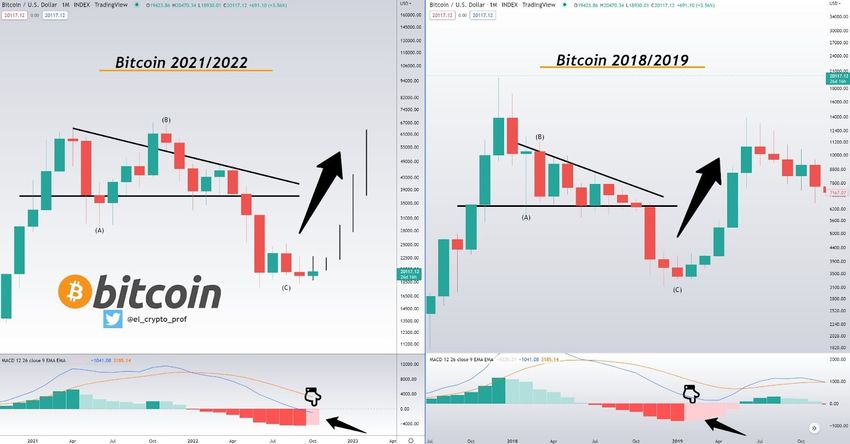
The last way to find signs of the end of a bear market and trend reversal on Bitcoin’s chart is long-term technical indicators. One of them is the monthly MACD, which provided a very clear trend reversal signal in the previous 2018-2019 bear market.
This was pointed out by @el_crypto_prof, who in yesterday’s tweet compared MACD readings from February 2019 and October 2022. According to him, the change of the negative bar on the MACD histogram from dark red to light was a signal of the end of a bear market. A similar signal could be generated this month if Bitcoin at least maintains its current level near $20,000. However, we won’t find out until the end of this month.
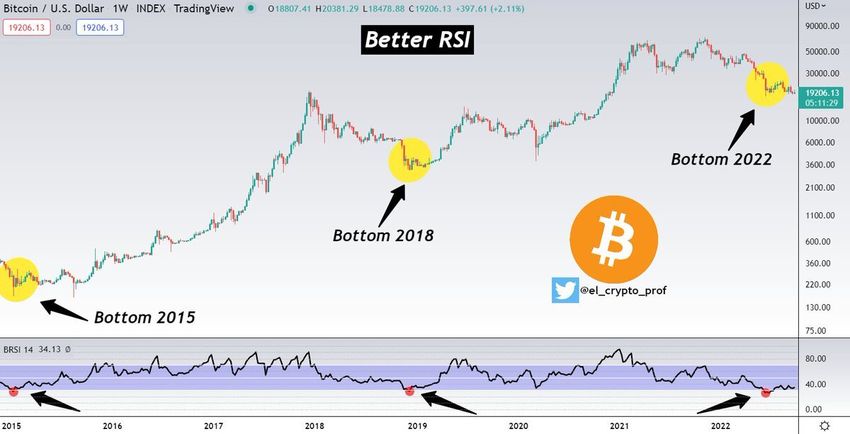
Another signal is provided by the weekly RSI indicator, the interpretation of which was tweeted by the same analyst. According to him, the visit of the weekly RSI to the overbought area below 30 was a signal of a market bottom.
This happened in the areas marked below (yellow and red). It is worth noting that, of all three cases, the lowest RSI value occurred in June 2022. However, the always-slowly rising indicator was accompanied by a sideways action of the Bitcoin price and several months of consolidation. This also reinforces the thesis of a resumption of the bull market in Q1 2023 at the earliest.
For Be[In]Crypto’s previous Bitcoin (BTC) analysis, click here.


