
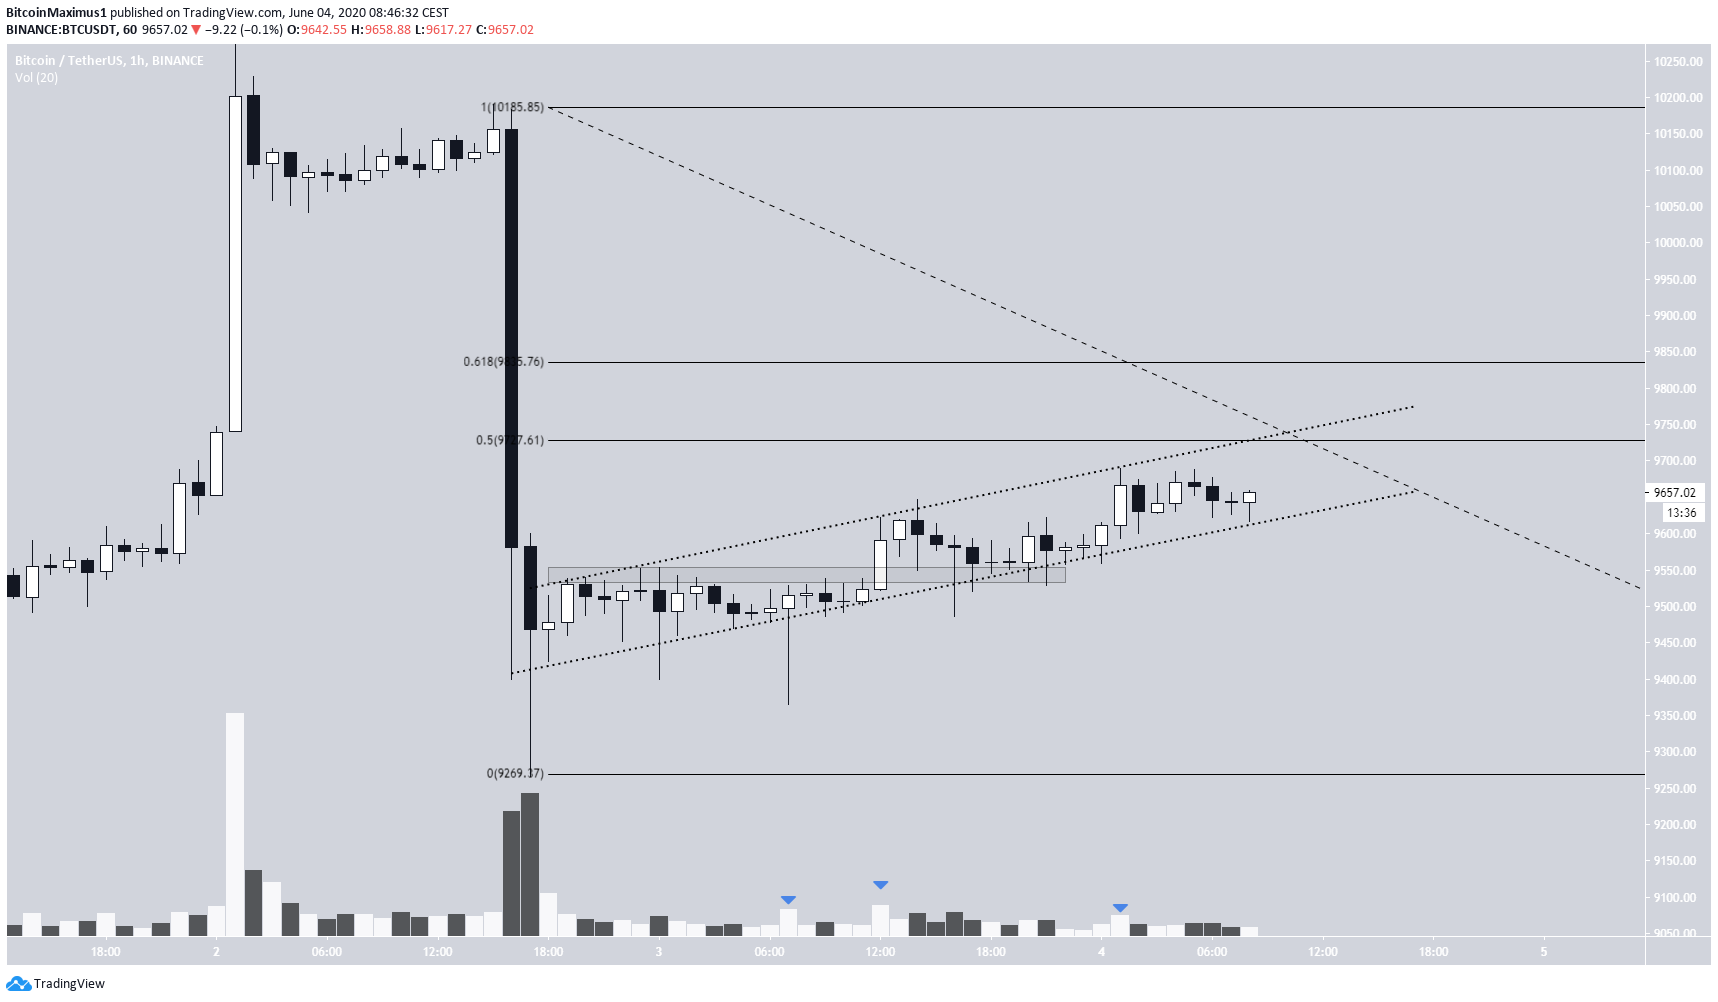
The Bitcoin price has been gradually increasing inside an ascending channel since the rapid decrease on June 2. The price is expected to reach the closest resistance area, found between $9,700-$9,800.
Bitcoin has been increasing since heavy losses on June 2, when the price reached a low of $9,266. Yesterday, the price broke out from the $9,550 minor resistance area and has been moving upwards since, taking the shape of an ascending channel.
Bitcoin’s Ascending Channel
While volume has been quite low, it has been slightly higher during bullish candlestick than their bearish counterparts.
The closest resistance area is found between $9,700-$9,800, more specifically the 0.5-0.618 Fibonacci levels of the entire downward move.
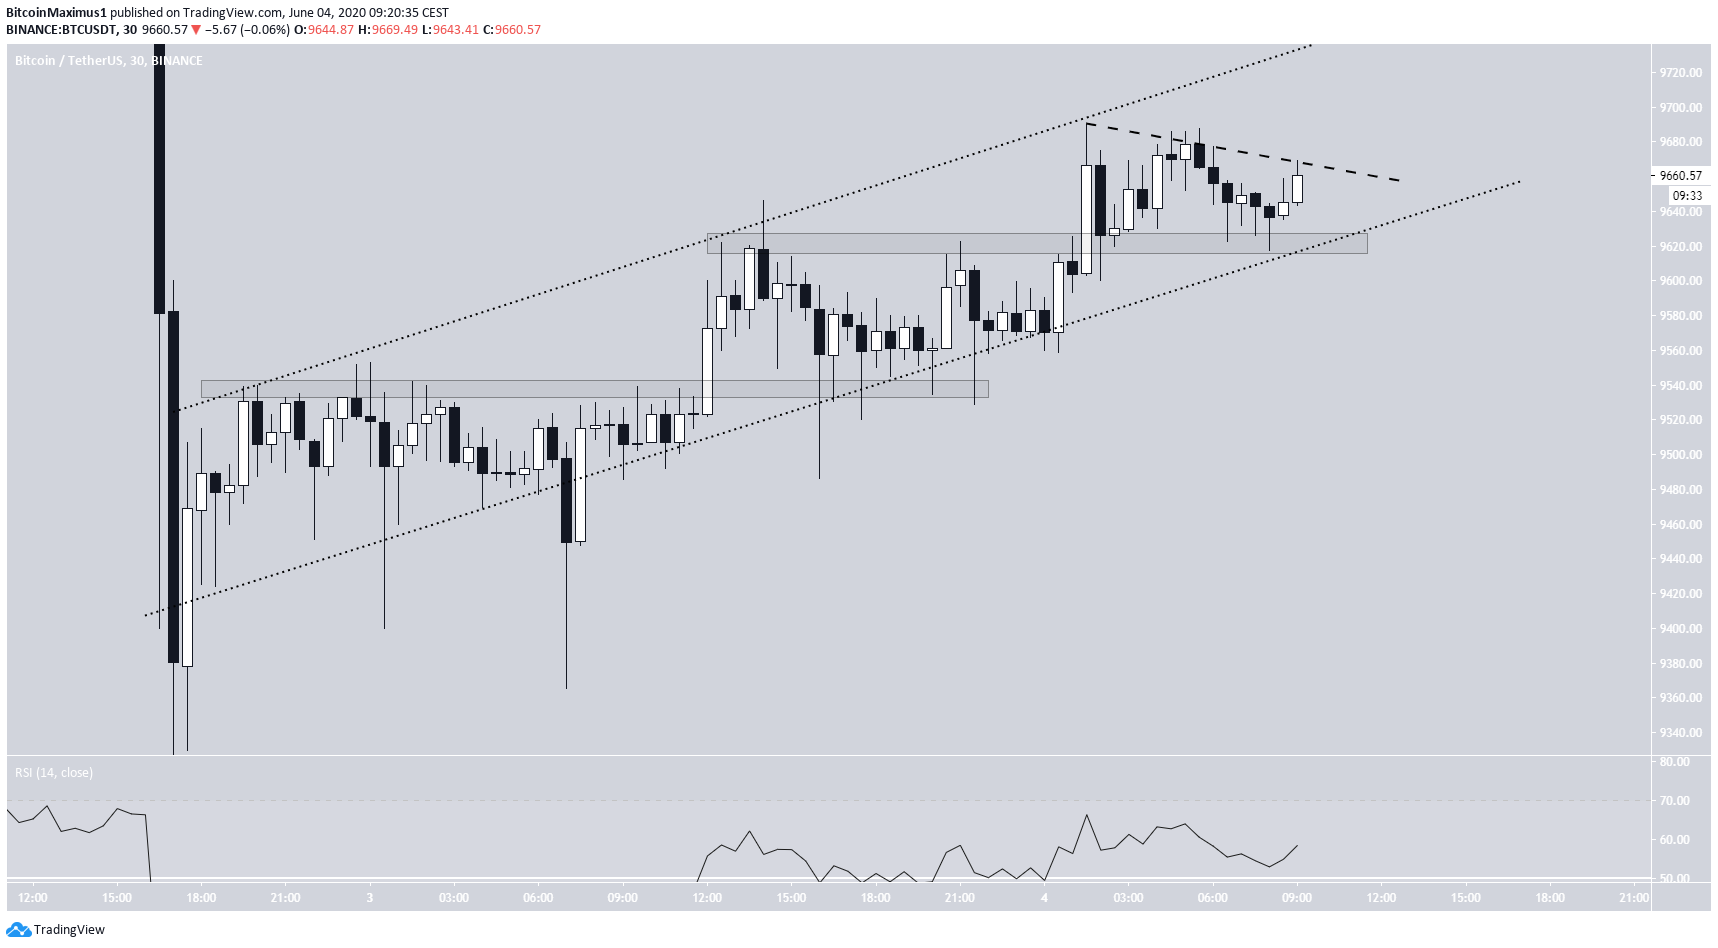
A closer look at the price movement reveals two support/resistance flips, a sign that the bullish trend is strong. In addition, there is no bearish divergence in the RSI yet.
The price is also following a very short-term descending resistance line. I the price breaks out above this line, the rate of increase is likely to accelerate.
At the time of press, it is difficult to confidently state whether the price will move higher than the $9,700-$9,800 area.
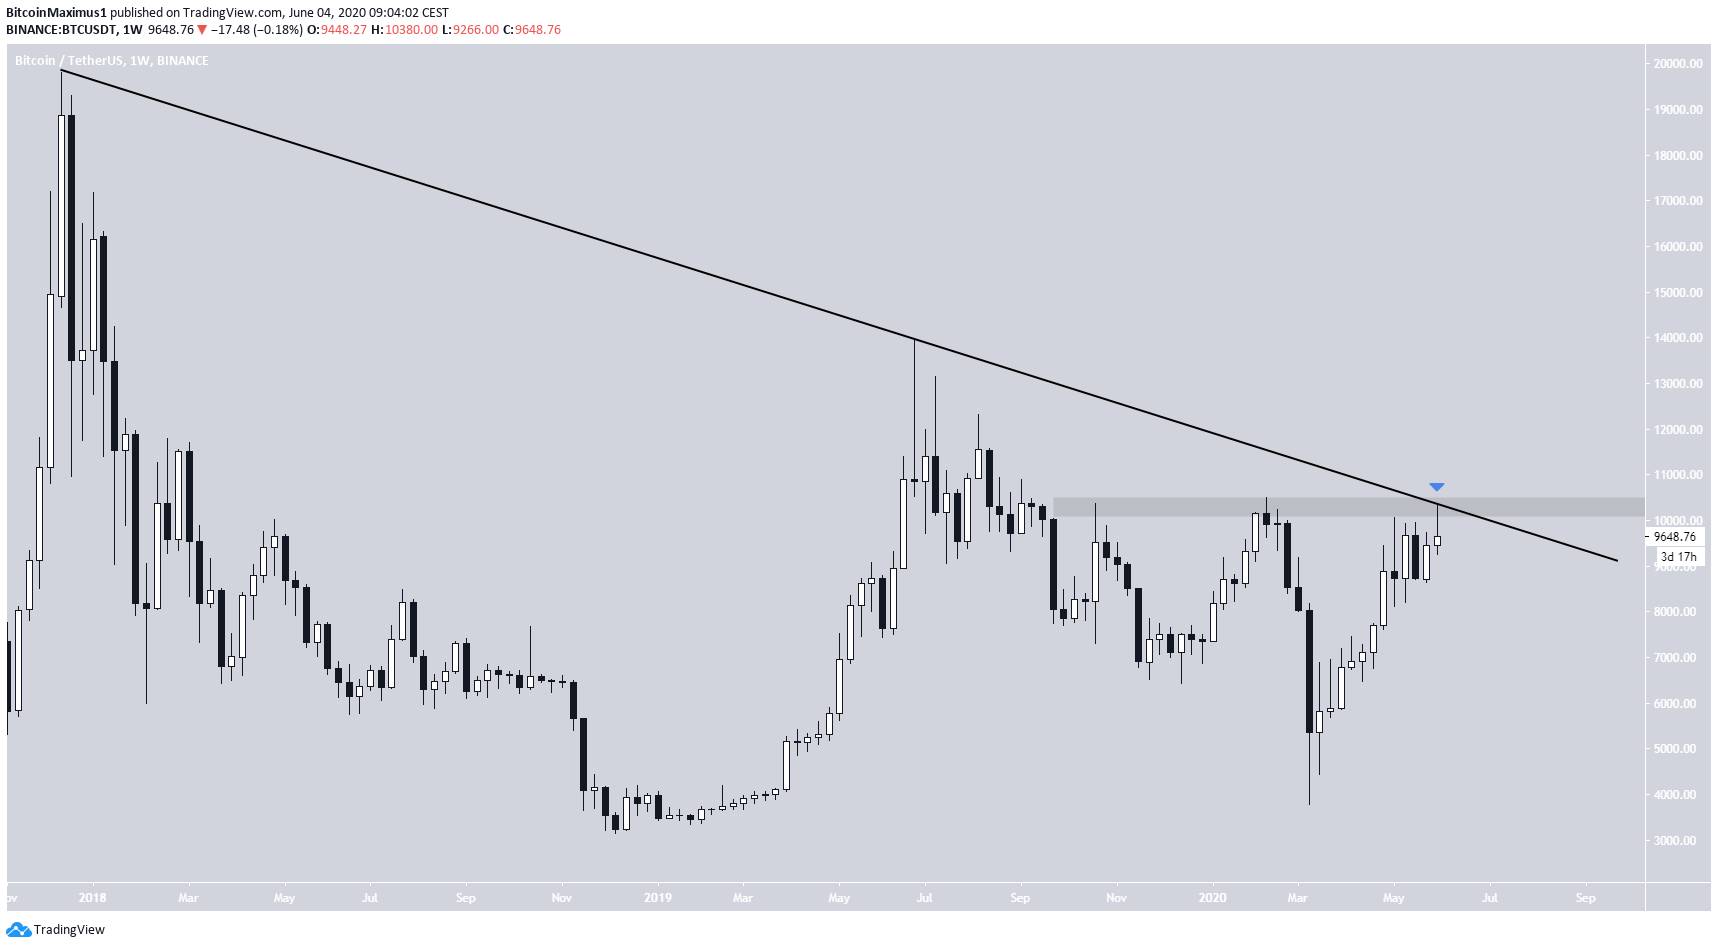
Long-Term Resistance
The weekly chart provides a more bearish picture. The price has been rejected by the $10,400 resistance area and the long-term descending resistance line, which has been in place since the all-time high price reached in December 2017.
At the time of writing, BTC was in the process of creating either a Doji or shooting star in the weekly time-frame, both of which can be read as signs of a reversal.
Therefore, the weekly close is extremely important, since it could be crucial in determining the direction of the future trend. While a close above $10,400 would be extremely bullish, possibly signaling a long-term upward trend, a close below the weekly opening price at $9,441 would possibly indicate that the upward trend beginning in March has ended.
For our previous analysis, click here.
