


On March 13, Bitcoin increased significantly and reached a close of $6,467, roughly a 14% increase measuring from the daily low. This created a bullish engulfing candlestick that closed well inside the previous wick resistance.
Bitcoin Daily Levels
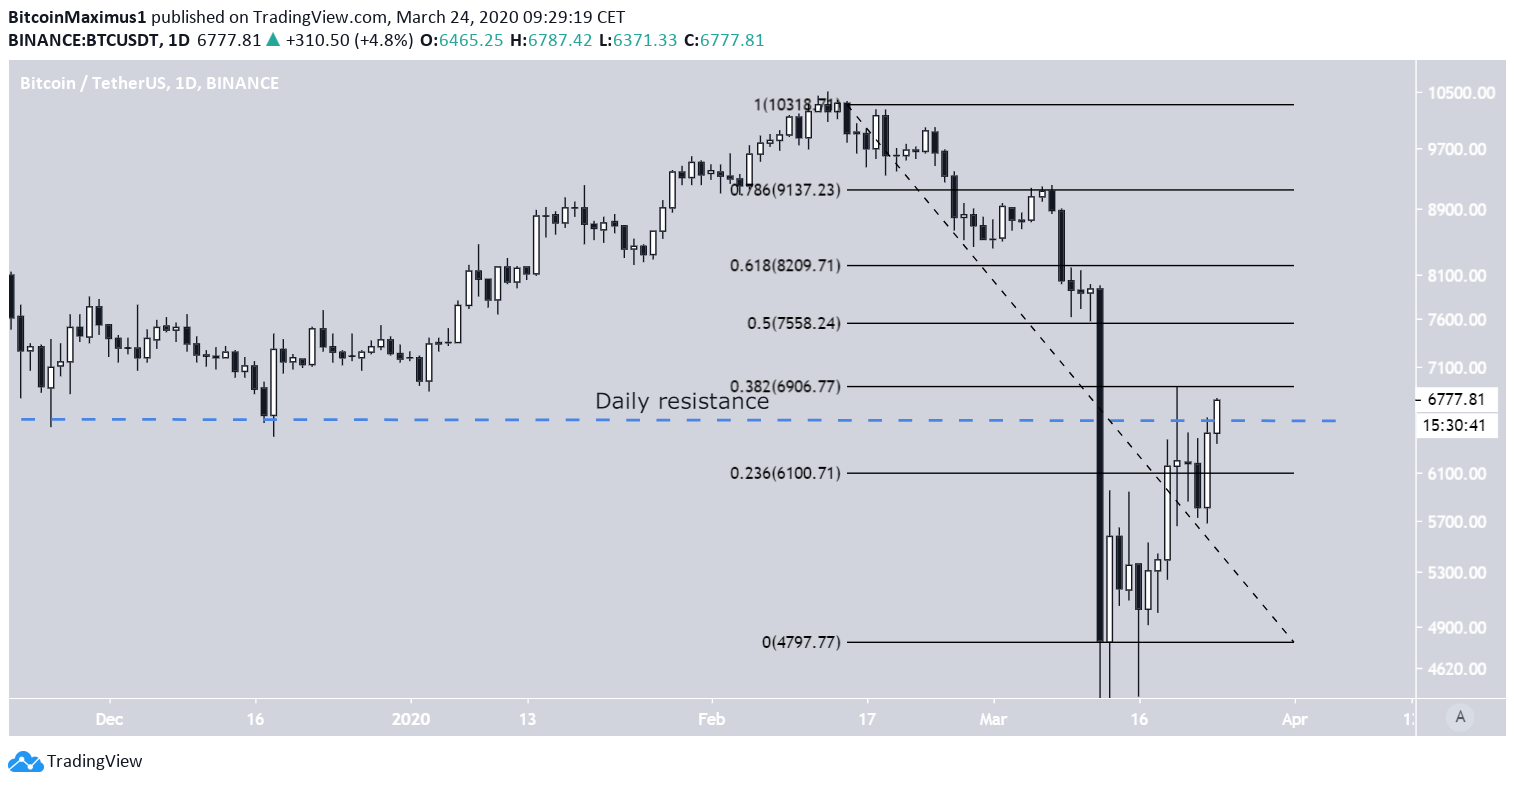
The Bitcoin price created a bullish engulfing candlestick on March 23. It was the highest daily close since the rapid decrease on March 23. In addition, the price has closed well into the resistance of the previous wick on March 20. Currently, it is increasing above the daily resistance level. This has changed the daily directional bias to bullish.
The closest resistance is found at the 0.382 fib level of the entire decrease, which coincides with the wick-high of March 20. The next significant resistance area is found at the 0.5 Fib level around $7,550. If BTC manages to break out above $6,900, it could trigger a rapid price increase towards $7,550.
Short-Term Movement
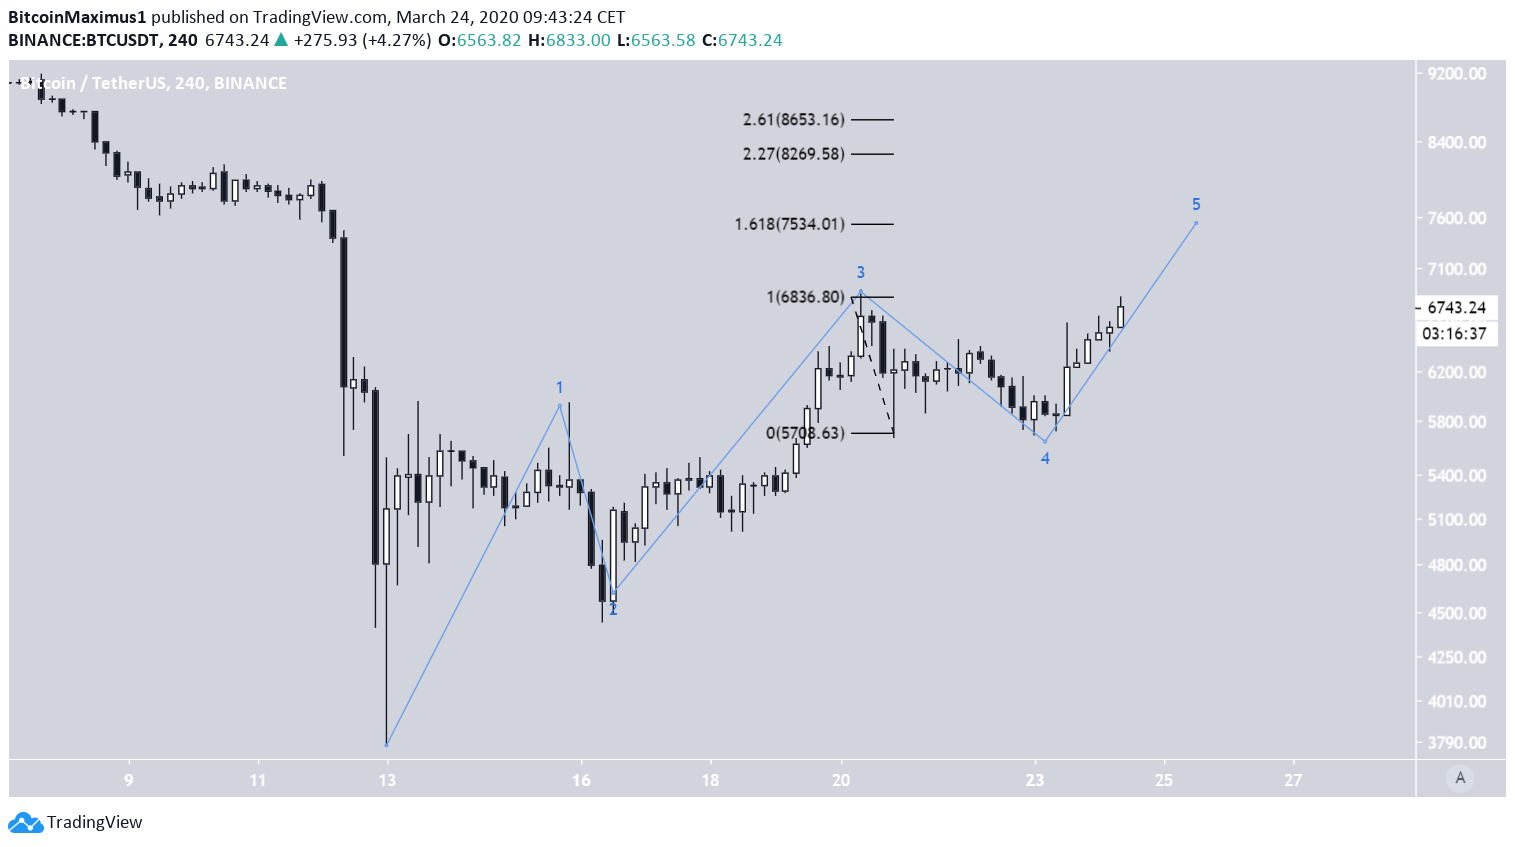
In the shorter-term, it is possible that the price is in the process of creating the fifth wave of an Elliott formation, which began with the $3,782 low on March 13. The target for the fifth wave would be around $7,500, making this a likely level for the top to be reached, as it also coincides with the resistance from the previous section.
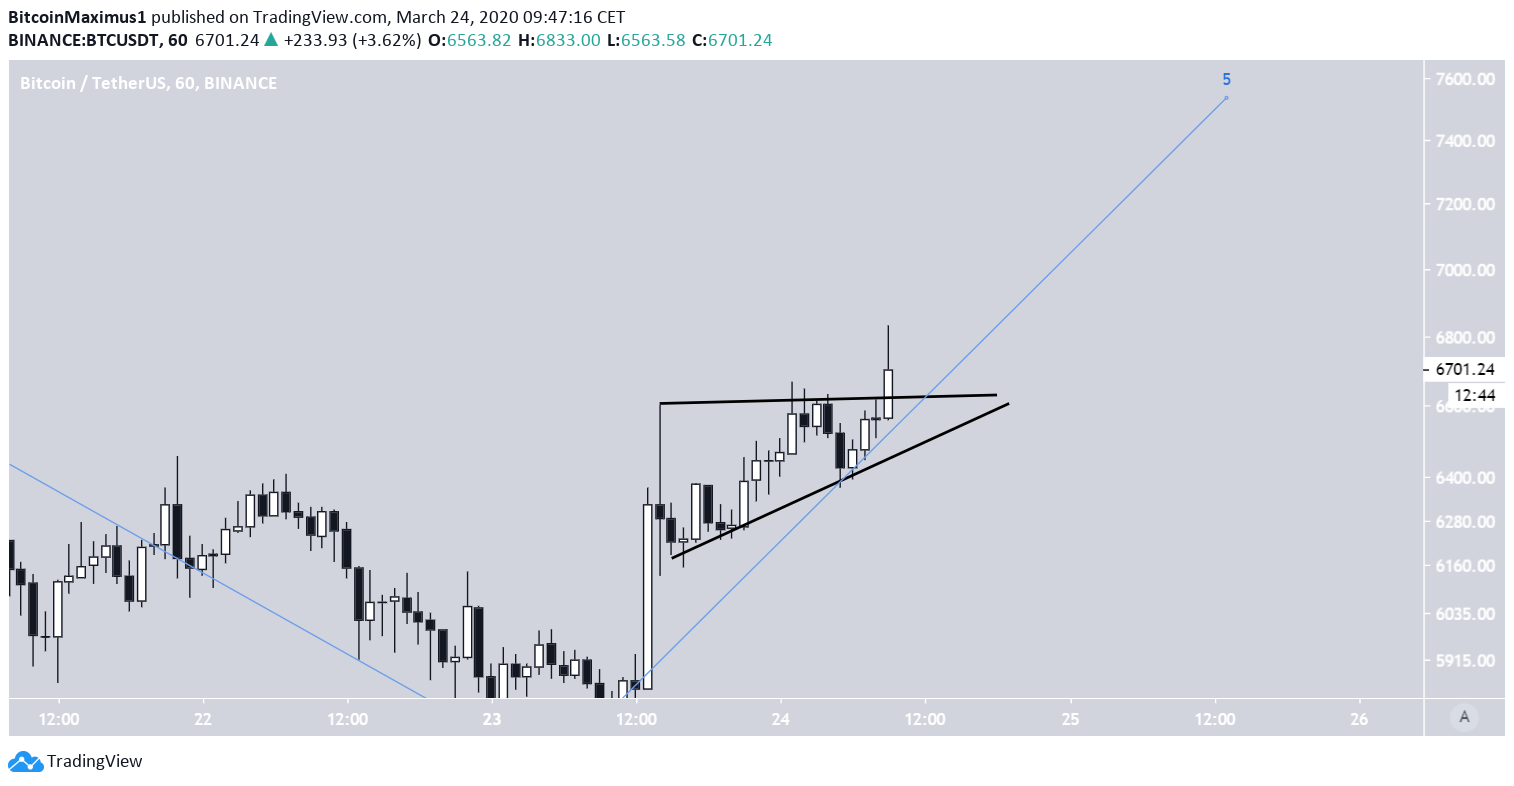
On the hourly chart, BTC has created what seems like an ascending triangle, out of which it is in the process of breaking out from. If the breakout is sustained, this could be the movement that takes the price to the $7,500 target.
To conclude, the BTC price reached a strong daily close inside the previous resistance, creating a bullish engulfing candlestick. This makes it likely that the price will continue to head higher towards the next resistance area around $7,500.
For those interested in BeInCrypto’s previous Bitcoin analysis, click here.


