


The Bitcoin (BTC) price has been increasing at an accelerated rate since breaking out above the $15,800 area and a short-term descending resistance line.
While a short-term decrease could occur, BTC has likely not reached a top yet.
Bitcoin Boosts After Breakout Level Retest
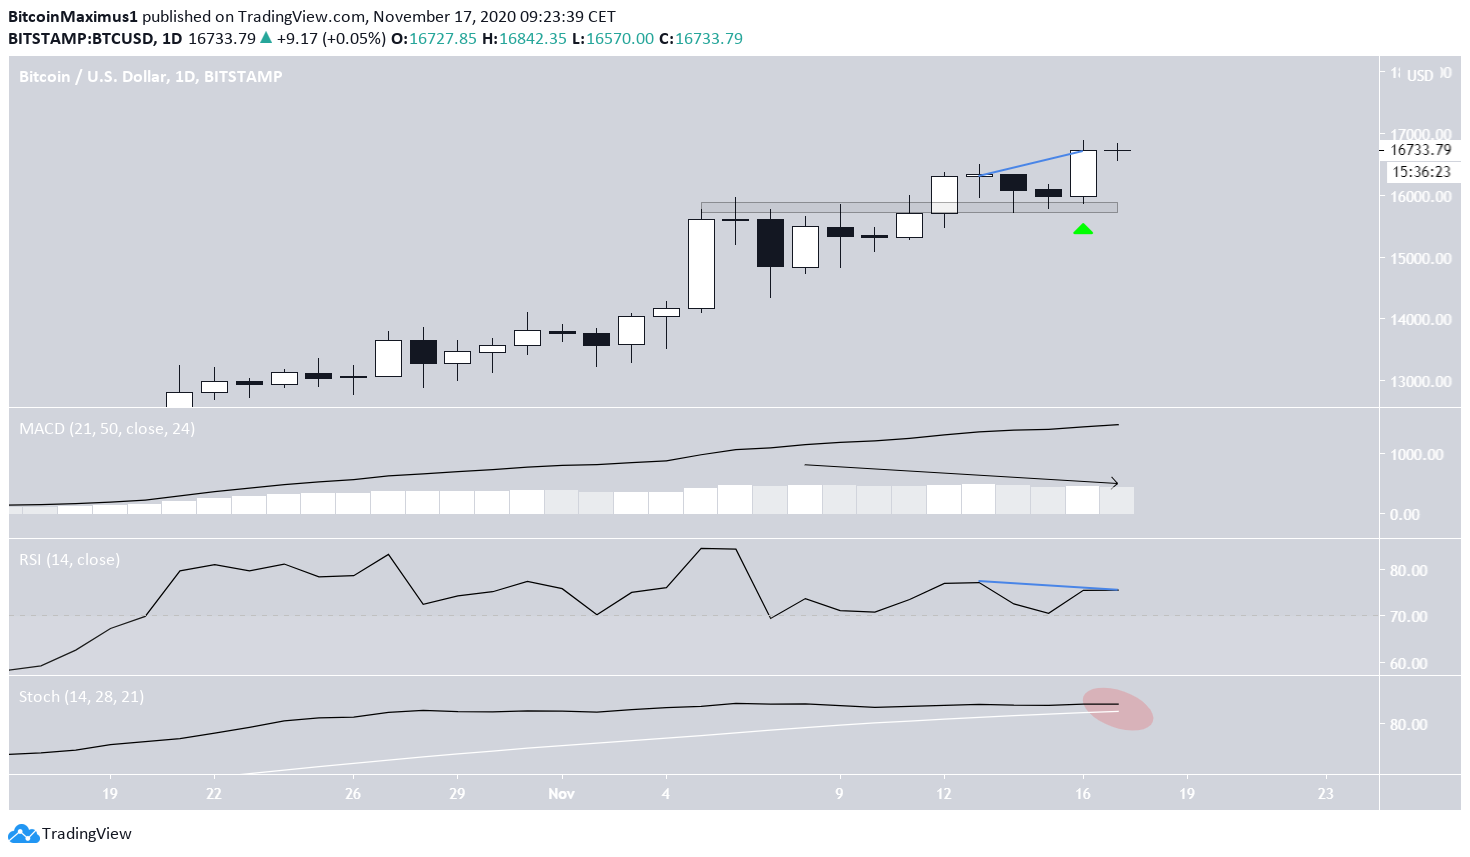
On Nov 16, the BTC price retested the breakout level at $15,800 and created a bullish engulfing candlestick, reaching a high of $16,895 before decreasing slightly.
Despite the bullish candlestick and validation of the $15,800 area, technical indicators in the daily time-frame have begun to show weakness.
There is a bearish divergence developing in the RSI, the MACD has begun to decrease, and the Stochastic oscillator is close to making a bearish cross. This indicates that the price could be nearing a top.
The closest long-term resistance level is found near $17,300.
Short-Term Breakout
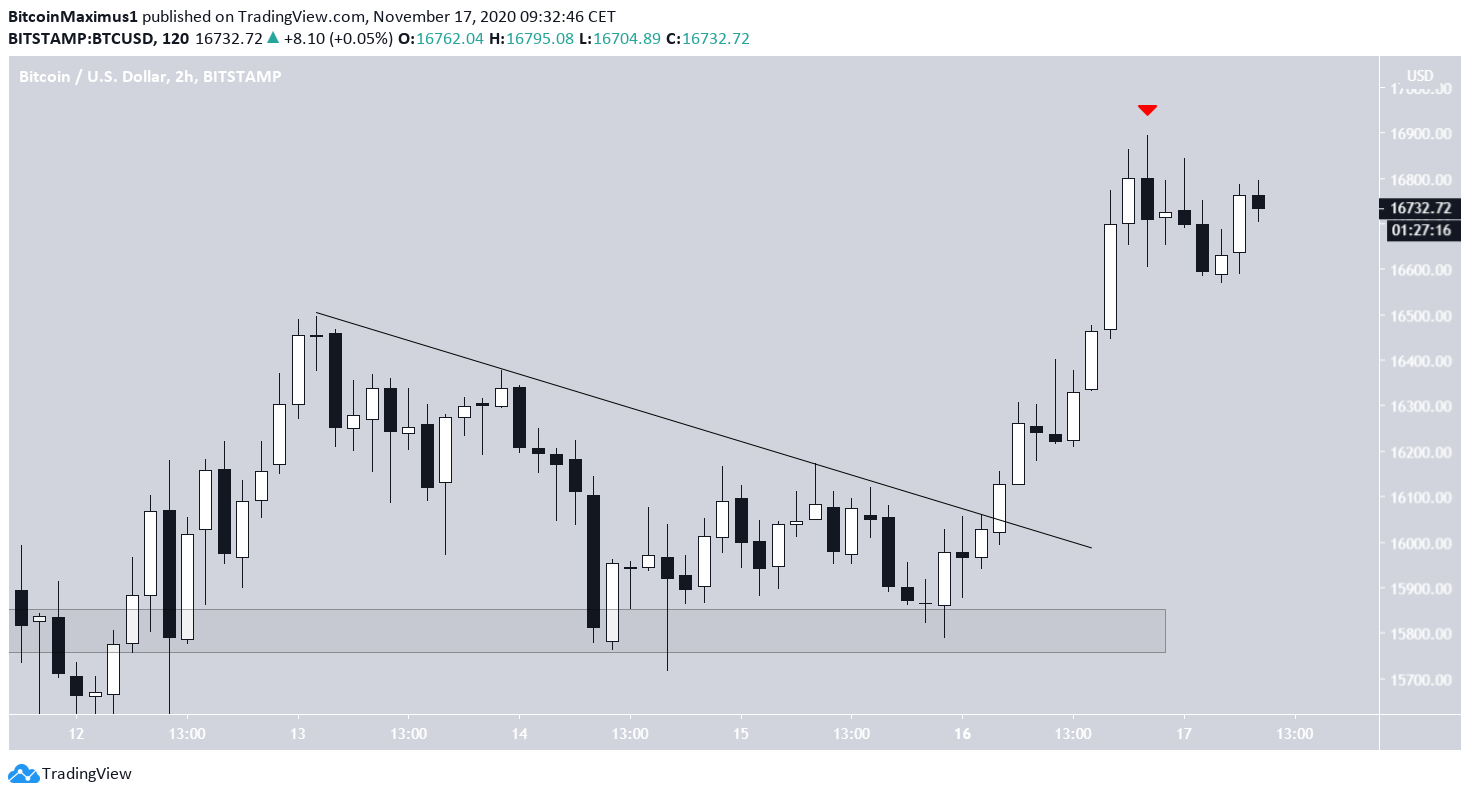
The shorter-term two-hour chart shows that the price has broken out from a descending resistance line and accelerated afterward.
While the price has been rejected near $16,800, creating two long upper wicks, there are no clear signs of weakness in the two-hour time-frame.
Wave Count
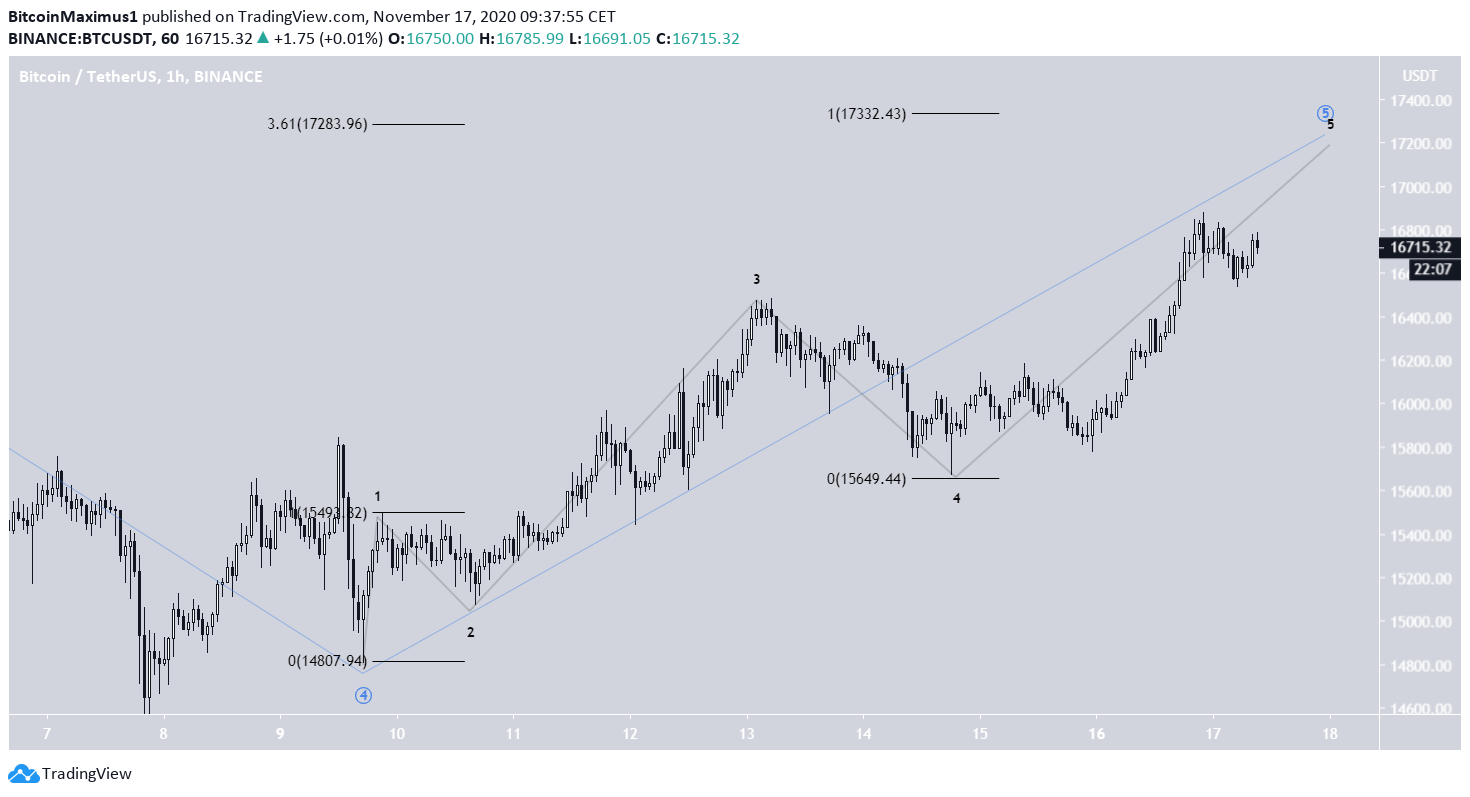
Bitcoin is likely in the fifth-and-final wave of a long-term upward move that is expected to take the price near $17,300.
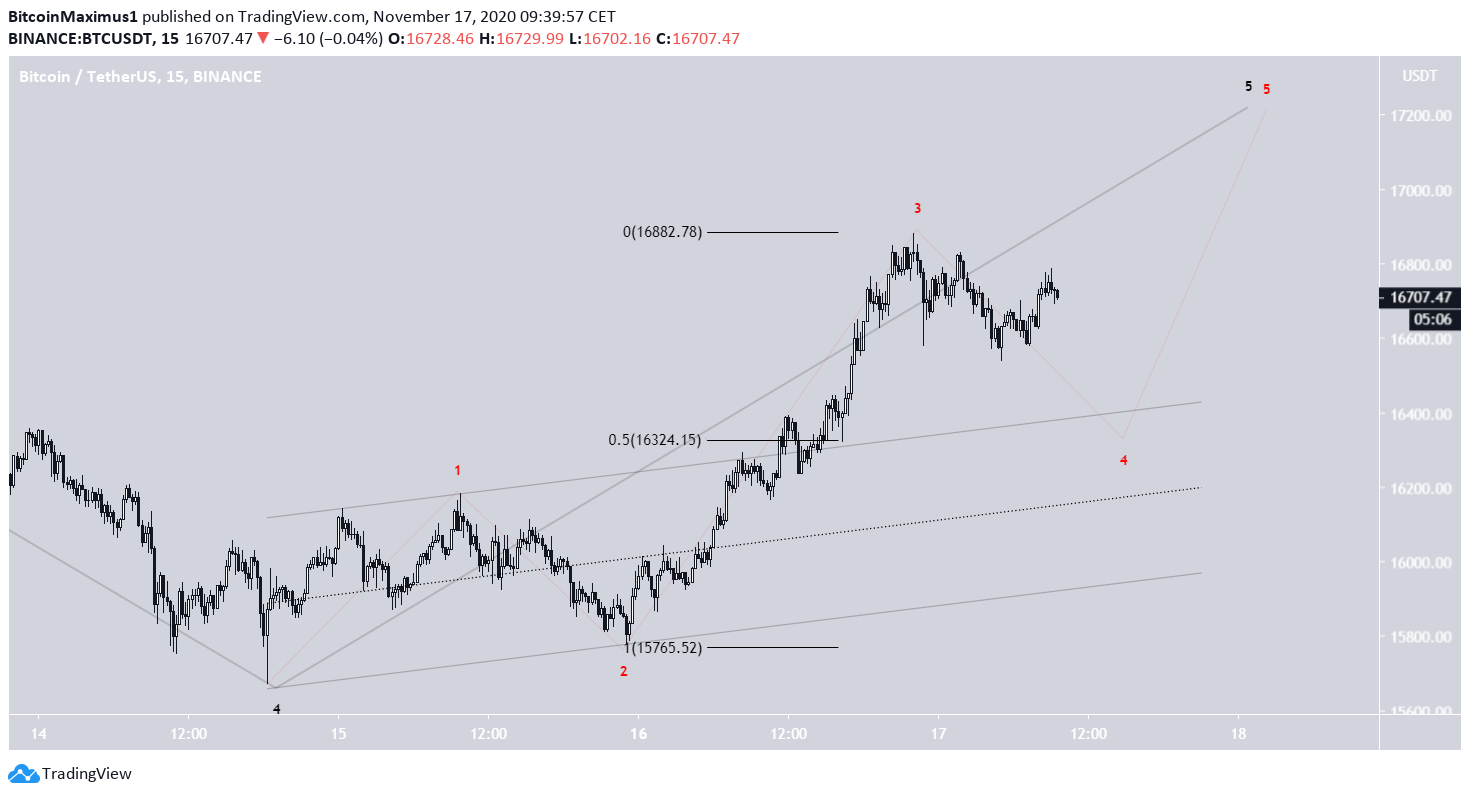
The minor count for the final wave shows that the price is also in the final sub-wave (shown in black below).
Two separate Fib extensions give a target between $17,283-$17,332, coinciding with the long-term resistance area.
If the price completes the formation as expected, BTC could see one final decrease towards $16,300 before completing its final upward move towards the top.
Conclusion
After a possible short-term decrease, BTC is expected to continue its upward move towards $17,300.
For BeInCrypto’s previous Bitcoin analysis, click here!
Disclaimer: Cryptocurrency trading carries a high level of risk and may not be suitable for all investors. The views expressed in this article do not reflect those of BeInCrypto


