
Bitcoin (BTC) is still trading above the $57,800 support area but has failed to reach a daily close above it.
While the direction of the Bitcoin trend is not entirely clear, it is likely that is bullish. This would be confirmed by a breakout above the current short-term descending resistance line.
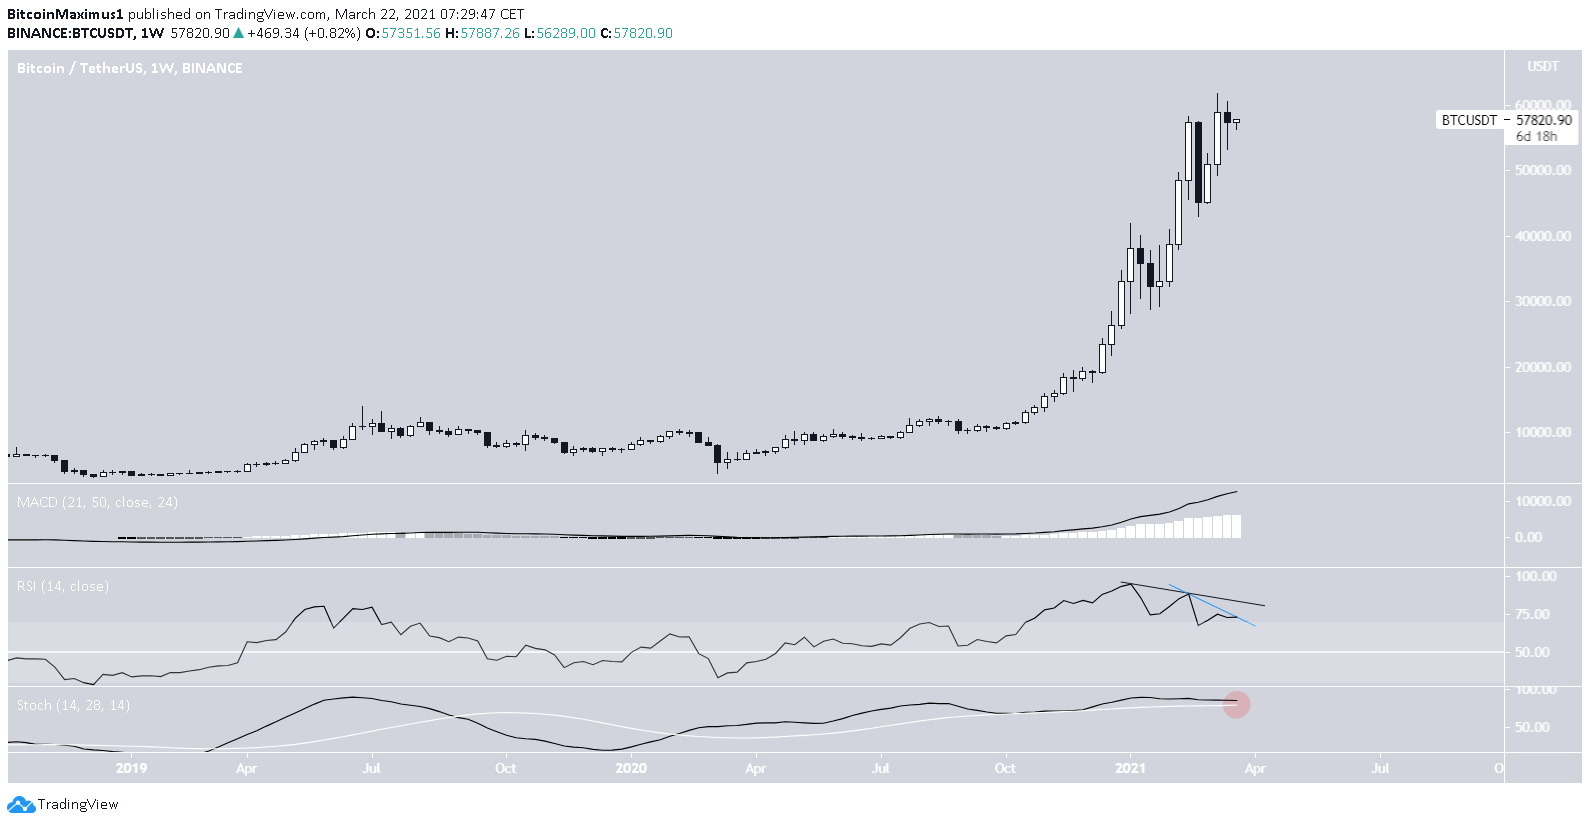
Long-Term Weekly Close
Last week, Bitcoin decreased slightly, creating a small Doji candlestick. This is seen as a sign of indecision, especially since it is coming after a week in which BTC reached a new all-time high price.
In a way, the market is cooling off prior to another significant movement.
The MACD is still increasing and has yet to create even one lower momentum bar. Similarly, the Stochastic oscillator is still moving upwards, even though it does not have considerable strength.
However, there are two instances of bearish divergences visible in the RSI. These are seen as a sign of weakness, especially since they are present in the weekly time-frame. Therefore, it is possible that a reversal or at least a significant correction will soon occur.
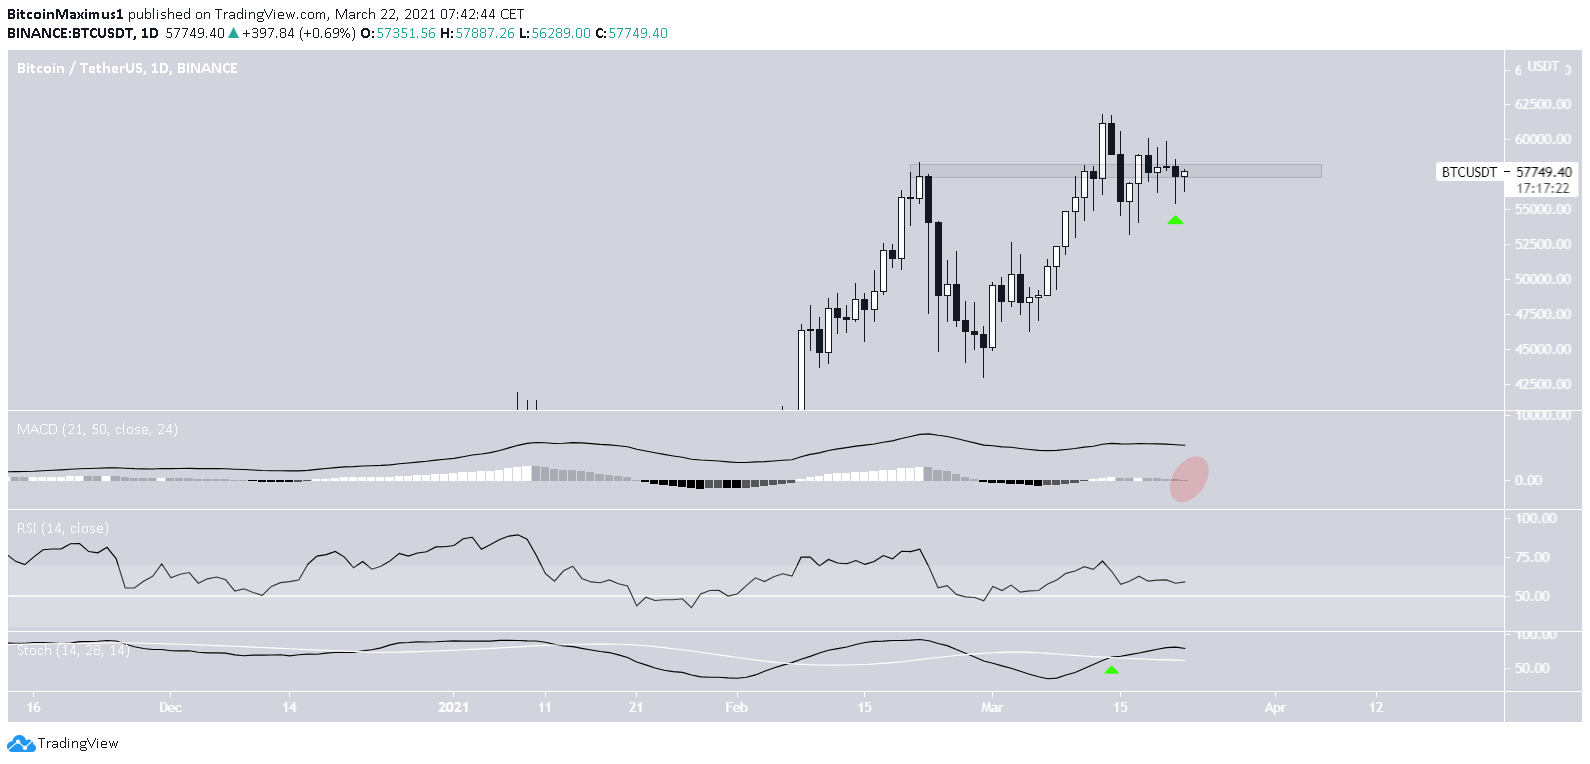
Bitcoin Trades Inside Support
The daily chart shows that Bitcoin is trading just above the $57,800 support area. While the long lower wick is a sign of buying pressure, the failure to close above this area is considered a sign of weakness.
Technical indicators are bullish even though they lack conviction.
While the MACD is positive, it has lost all of its strength. The RSI is trending above 50, but similar to the MACD, it’s moving on a neutral trajectory.
However, the Stochastic oscillator is bullish.
Nevertheless, a daily close above this support level is required in order for the trend to be considered bullish.
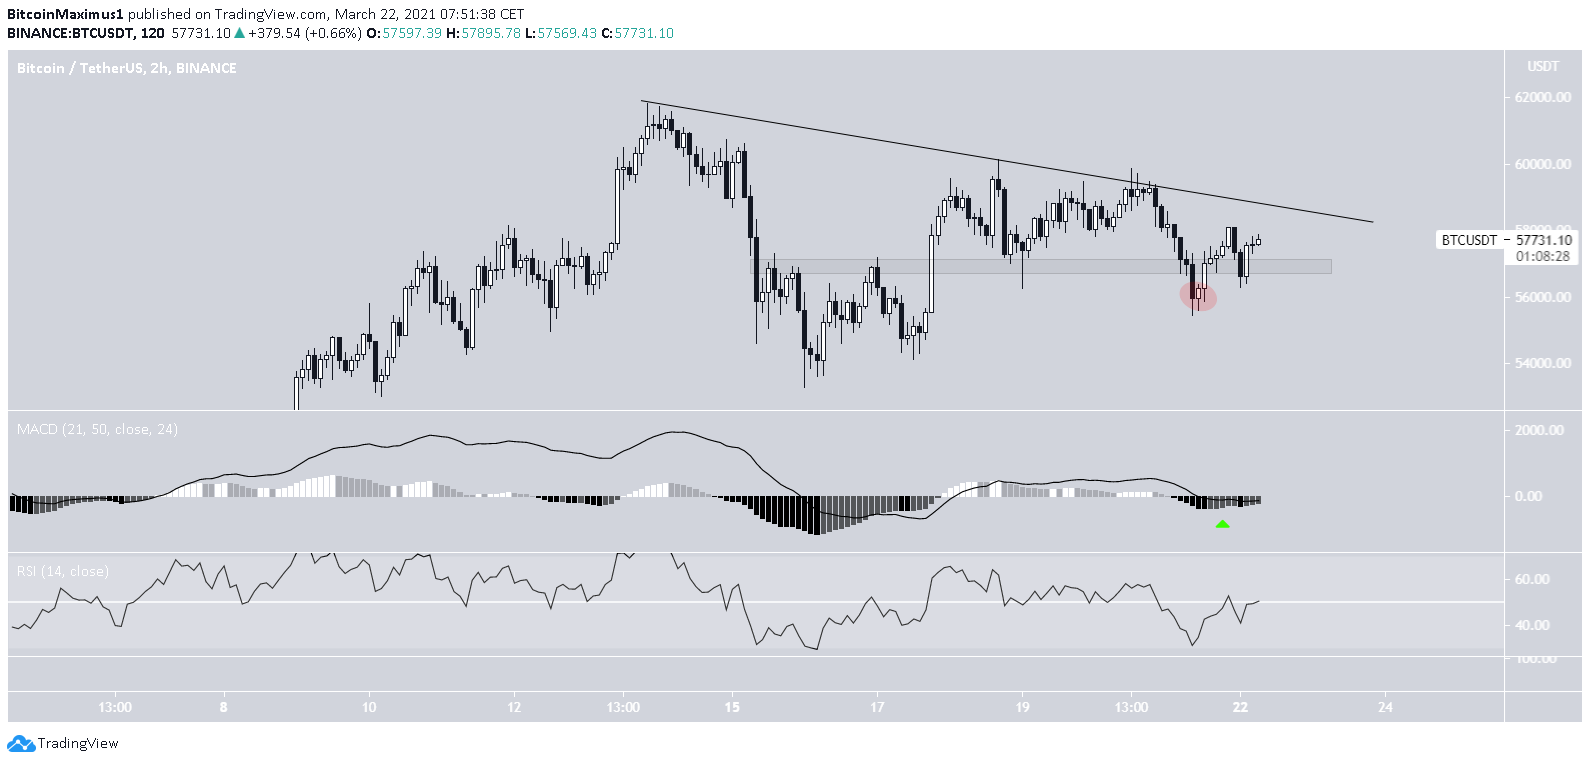
The two-hour chart is more bullish. Bitcoin returned to validate the $57,000 area as support before bouncing.
After some deviation below it, BTC has now reclaimed the area once again.
While the RSI is neutral, the MACD supports the continuation of the upward movement.
A breakout from the current descending resistance line would likely confirm that the trend is bullish.
Conclusion
The long-term trend for BTC is undecided due to the lack of conviction from technical indicators. However, the short-term trend seems to be bullish. This would be confirmed by a breakout above the current short-term descending resistance line.
For BeInCrypto’s previous Bitcoin (BTC) analysis, click here.
