
Bitcoin (BTC) spent the past week consolidating above $11,150. The price is expected to soon begin moving upwards towards higher targets.
During the week of Oct 12-19, the Bitcoin price gradually continued the ascent that it began in early September. The price created a small Doji candlestick, reaching a high of $11,731 before decreasing slightly.
Bitcoin Weekly Close
While the price is considerably above the $10,000 support, it’s still trading below the $12,000 resistance level that was seen throughout August 2020 as well as in July 2019.
Until BTC is successful in moving above these levels, we cannot confidently state that it will move upwards.
Technical indicators are relatively neutral, leaning on bullish, but do not provide a clear direction of the future trend.

Ongoing Retracement
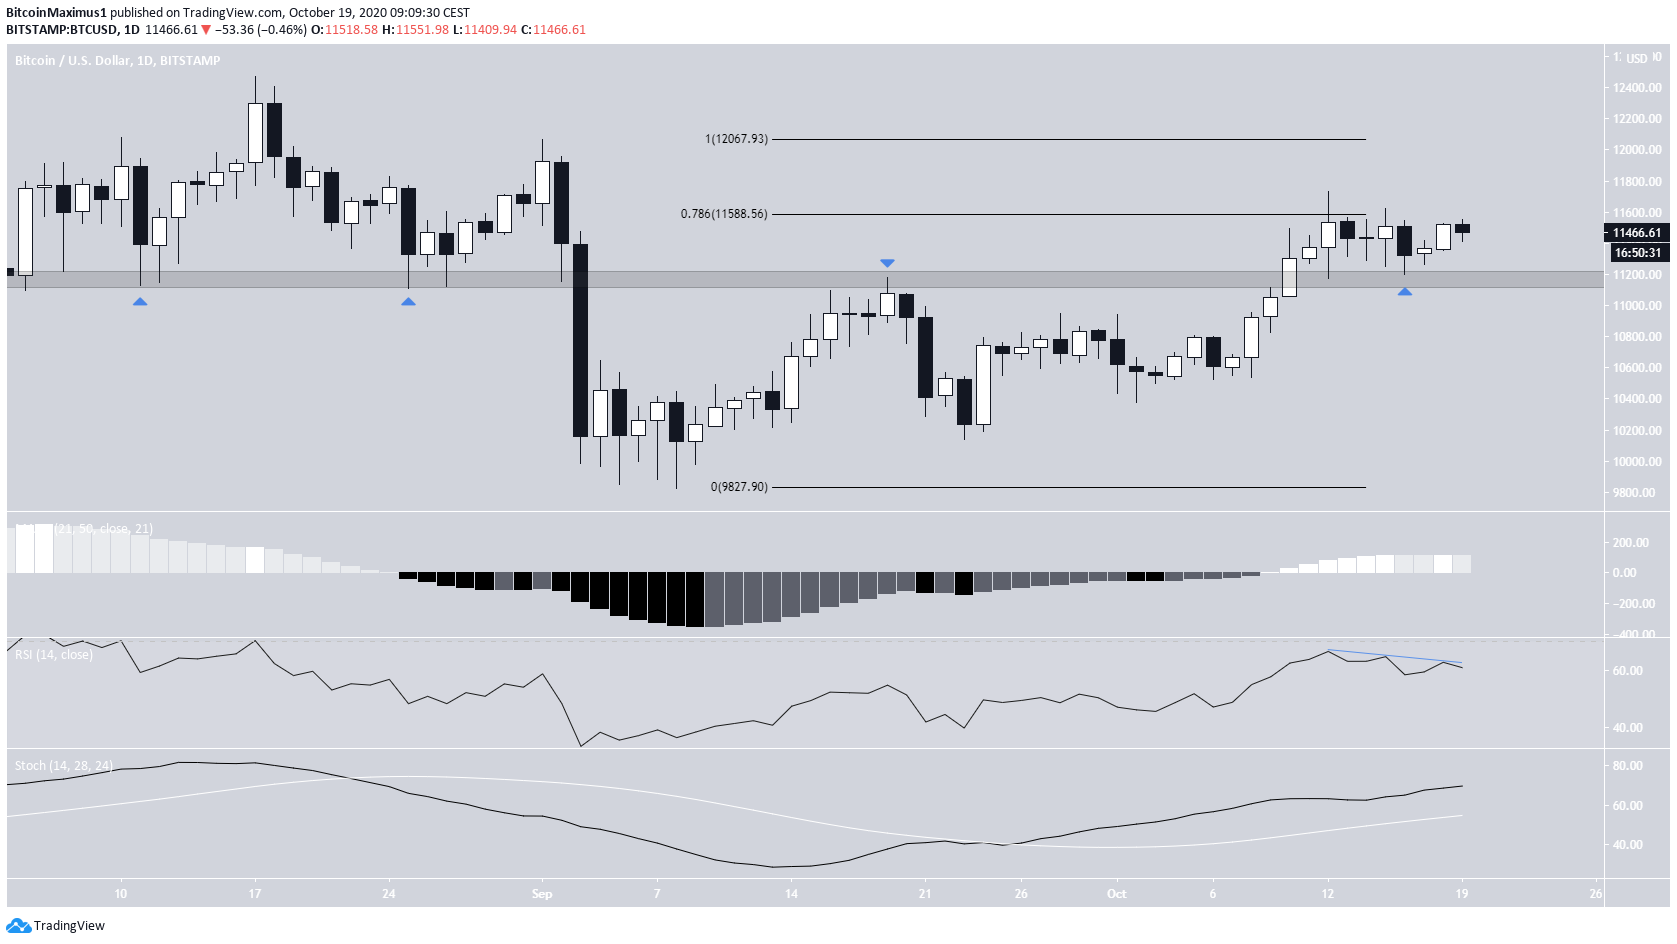
A look at the daily time-frame shows that the main support area is found at $11,150. The area has intermittently acted as support and resistance since late-August. As long as the price is trading above this level, it is expected to continue moving upwards.
Furthermore, BTC has briefly moved above the 0.786 Fib level of the previous decrease, which would be expected to act as the top if the current movement is corrective.
Technical indicators are still positive, but the first signs of weakness are showing in the form of an unconfirmed bearish divergence in the RSI.
A breakout above the current level would likely take BTC back to the long-term resistance area at $12,000 — the same level that initiated the Sept 4 drop.
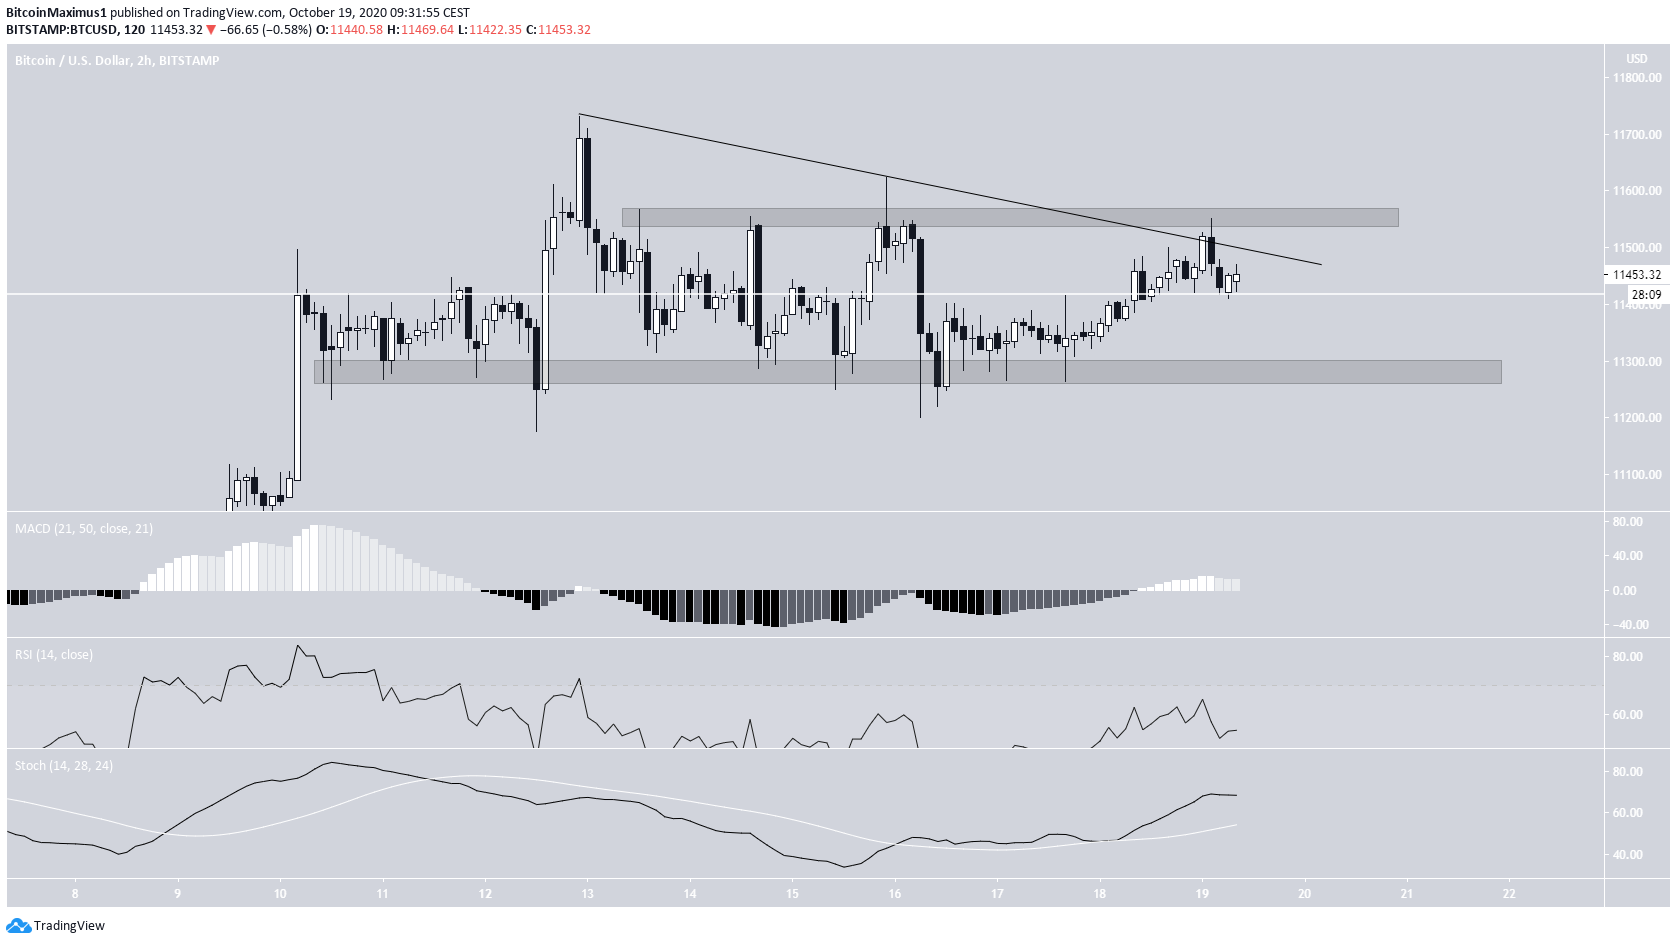
The shorter-term 2-hour chart shows a trading range between $11,550 and $11,300, with the price currently being very close to the former. In addition, BTC appears to be following a descending resistance line.
While the range does not directly help in determining if the price will break out, the successive attempts at doing so make a breakout more likely. There is no weakness in technical indicators yet, and since the ongoing trend is bullish, a breakout would be expected.
Wave Count
In BeInCrypto’s Bitcoin analysis from Oct 16, we stated that:
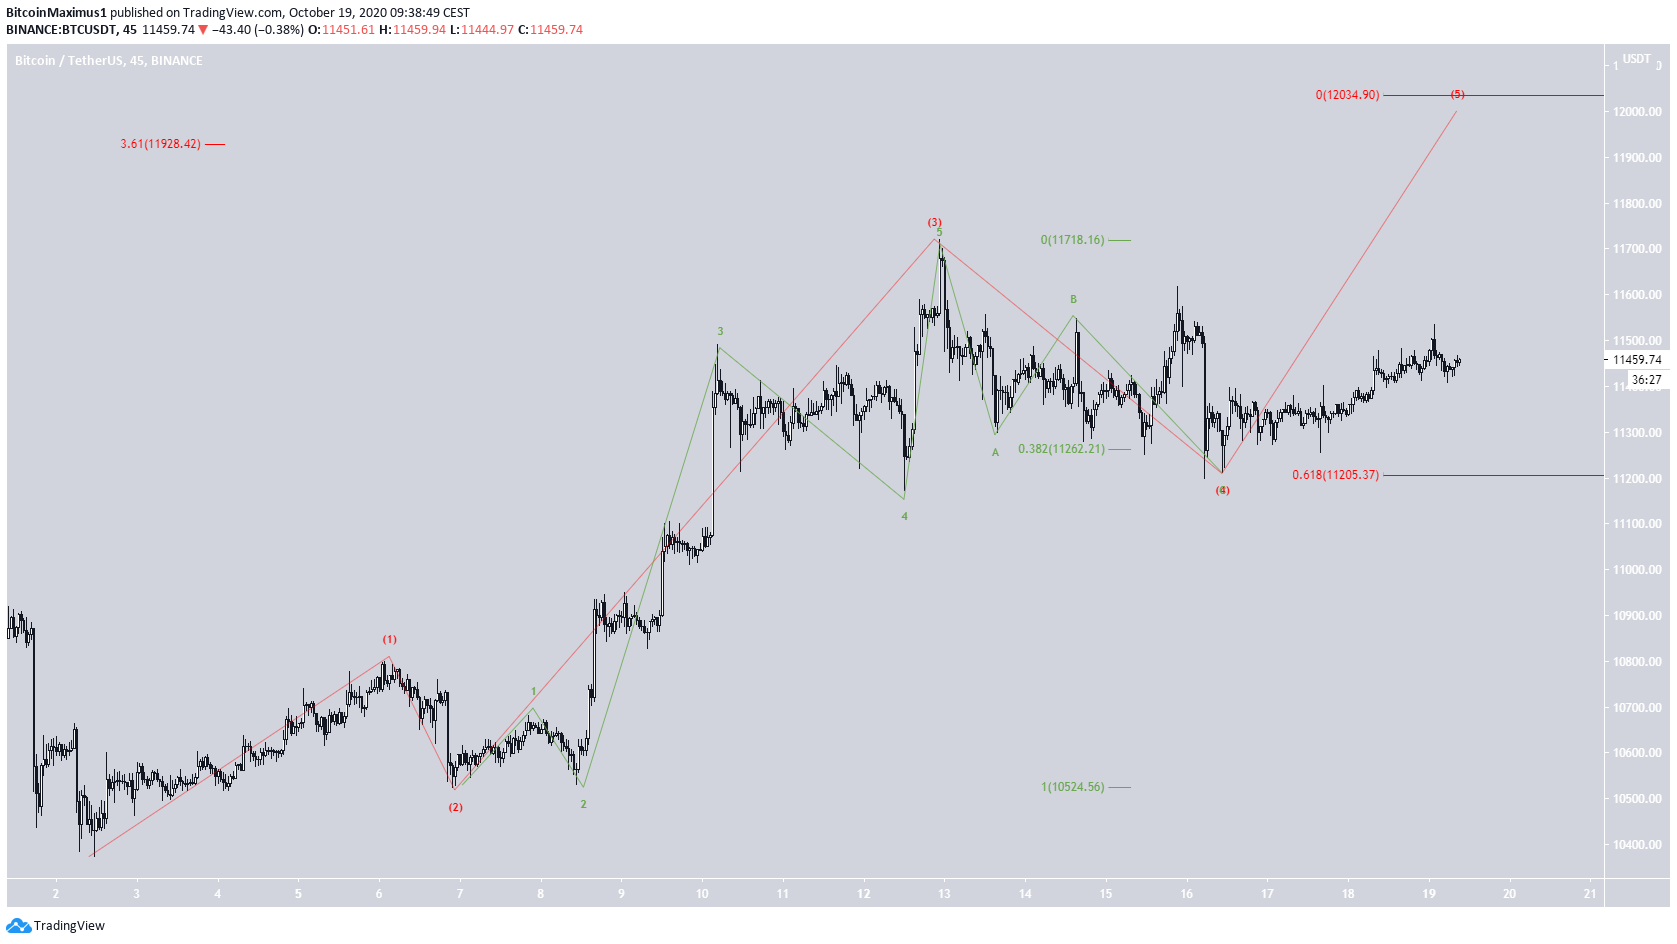
“The price seems to be in wave 4, which is expected to end near this $11,150 area, before wave 5 begins (shown in red below). Wave 5 would be expected to end near $11,920.”
It’s possible that the price has already completed wave 4, and has now begun wave 5, which is expected to end between $11,930-$12,030, a target found by using the Fib lengths of waves 1-3.
This particular wave count would be invalidated by a decrease below the wave 4 low of $11,205.
To conclude, Bitcoin is expected to gradually move towards the weekly range highs at $11,900.
For BeInCrypto’s previous Bitcoin analysis, click here!
Disclaimer: Cryptocurrency trading carries a high level of risk and may not be suitable for all investors. The views expressed in this article do not reflect those of BeInCrypto.
