


On July 22, the Bitcoin (BTC) price continued its breakout from the previous day, creating another bullish candlestick with significant size.
It looks like BTC has begun a new upward trend that may eventually lead the price to make another attempt at breaking out above $10,000.
Bitcoin Continues to Climb
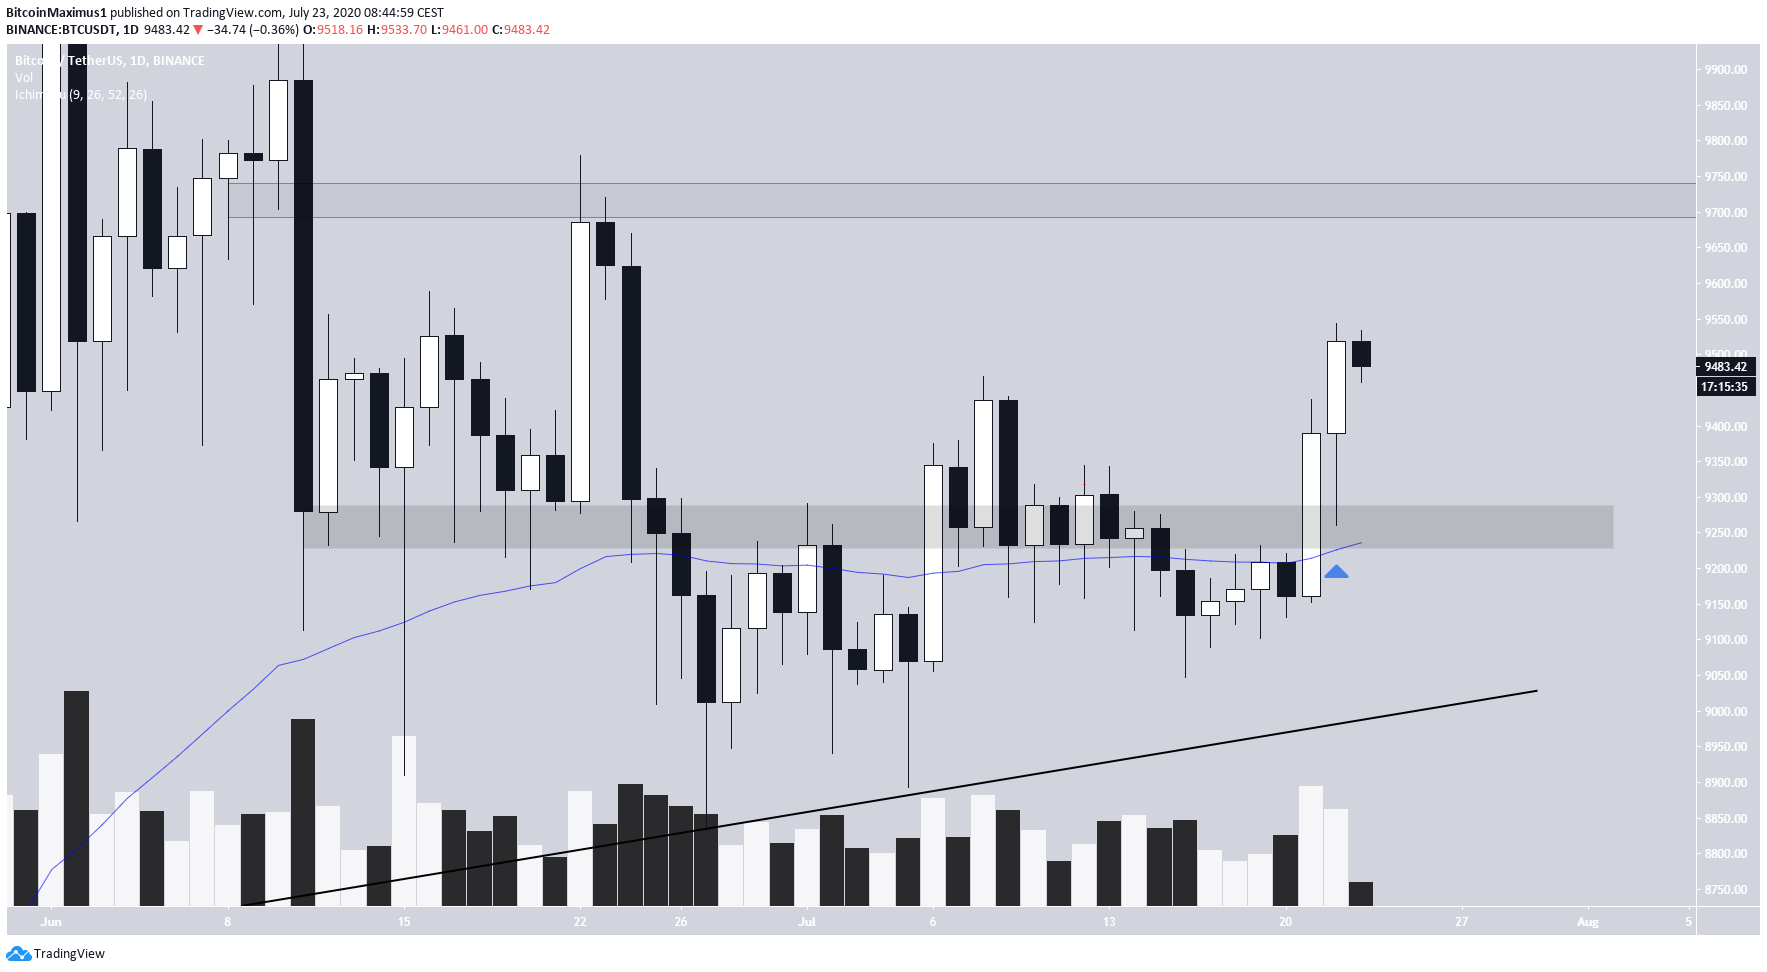
On July 21, the Bitcoin price created a bullish engulfing candlestick, breaking out above the $9,250 area and the 50-day moving average (MA), both of which had been providing resistance to the price over the past two weeks. The breakout occurred with above-average volume.
Yesterday, after validating the breakout level, BTC created another bullish candlestick, confirming that it has begun an upward trend.
The closest resistance area is found at $9,720, while the closest support area lies near the breakout level at $9,250.
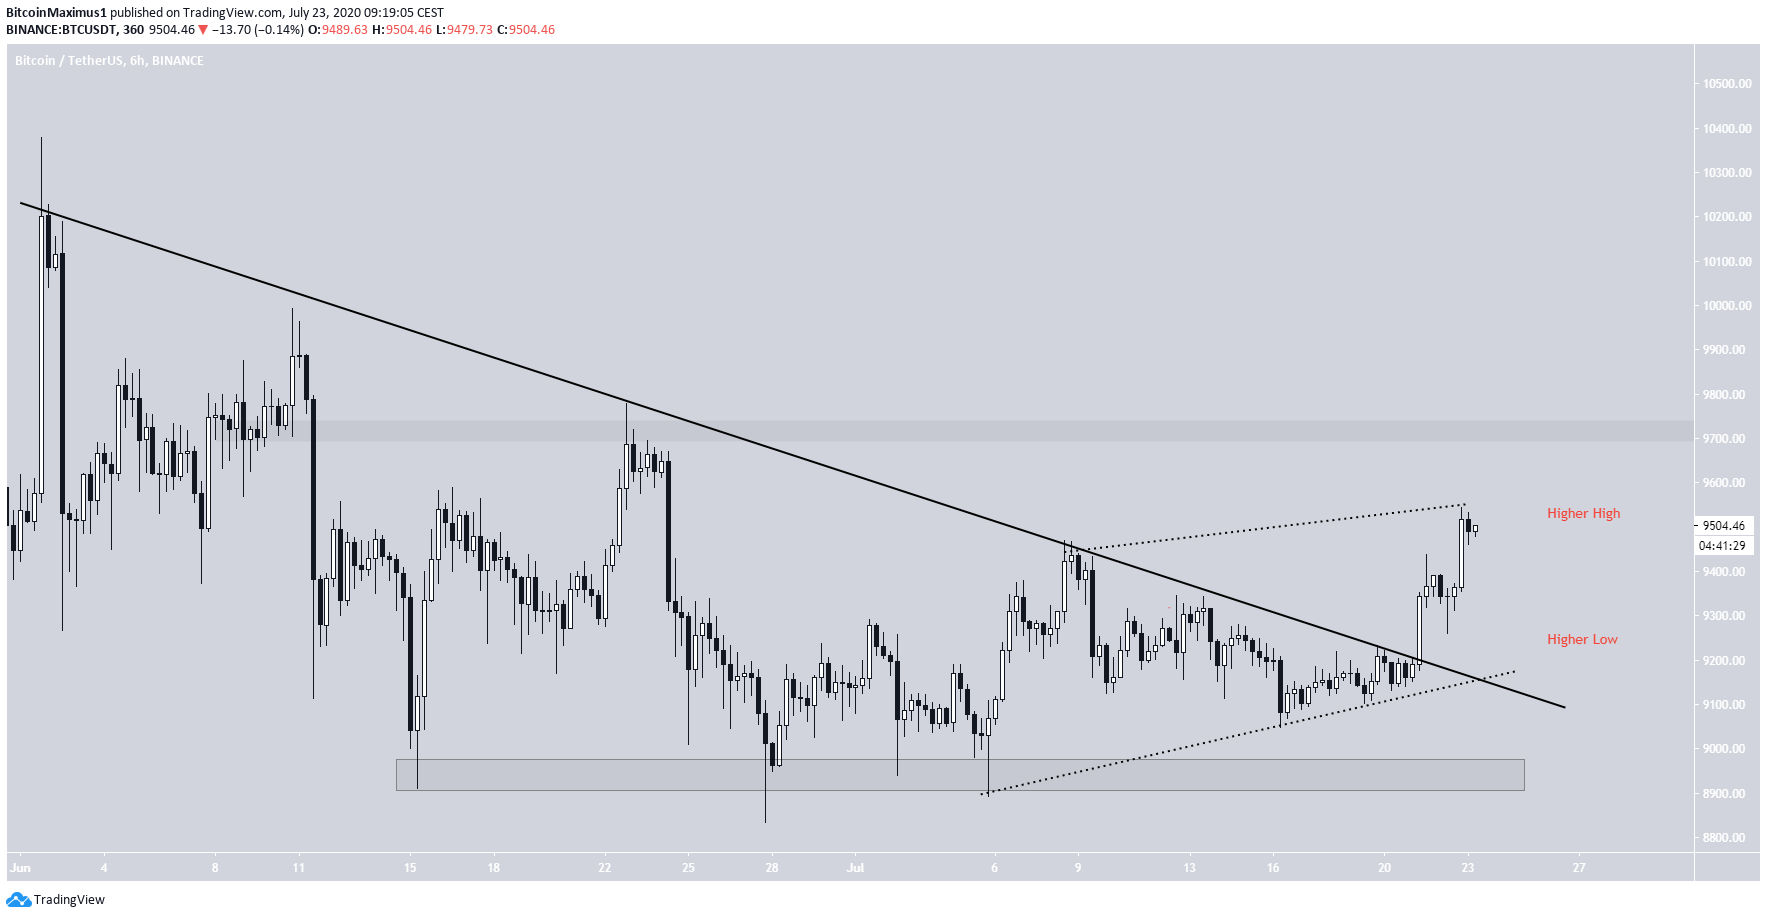
The breakout is much clearer when looking at the six-hour time-frame, where the price has moved above a descending resistance line that had been in place since June 1.
In addition, it is the first instance since then that the price has created both a higher-high and higher-low, a sign that the bullish trend has already begun.
Moving on Up
As for the wave count, BTC seems to be in the third wave of a five-wave Elliott formation, which has become extended. Inside this move, the fifth sub-wave has also become extended. The current wave would be expected to end near $9,720, the resistance area outlined in the previous section.
The fact that volume was quite high in the most recent increase also makes it likely that the rally for BTC is not yet finished. Another wave is expected to transpire, ideally with lower volume, to indicate that the move is coming to an end.
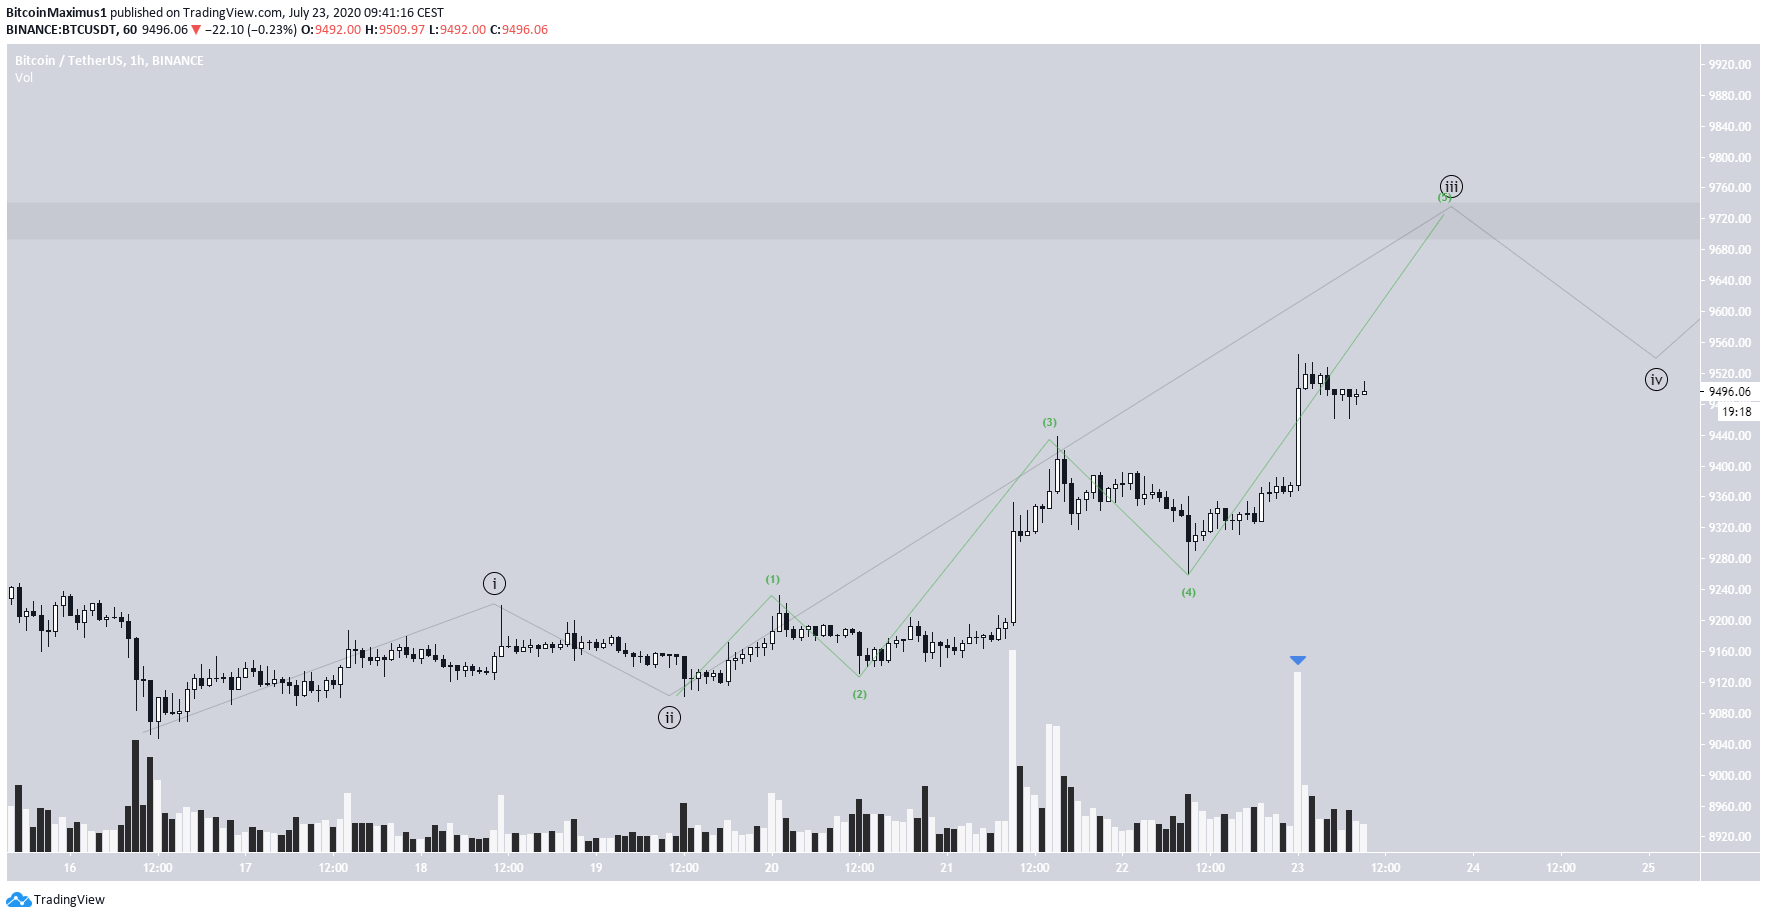
To conclude, the Bitcoin price has likely begun a new upward movement. The price is expected to reach the $9,720 resistance area before retracing slightly and resuming its upward movement.
For our previous analysis, click here.


