![Bitcoin Cash’s Upward Move Could Continue Above ₿0.03 [Premium Analysis]](/_mfes/post/_next/image/?url=https%3A%2F%2Fassets.beincrypto.com%2Fimg%2FoeJpDjToBusRyxf1r3JA4JgeMG8%3D%2Fsmart%2F036220f0a5ff4da889dc5f3e9e916901&w=1920&q=75)
The Bitcoin Cash price has likely reached a bottom. The current upward move could intensify if the BCH price breaks out above the trading range that has been in place for roughly 175 days.
The BCH price has been decreasing since the beginning of April. Since July, it has been consolidating, trading inside a range between ₿0.026 and ₿0.033. Naturally, this has caused many traders to speculate on when the price might break out from this range and begin a reversal.
Crypto analyst and trader Crypto Krillin stated that the BCH price has begun an upward move and gave a target of ₿0.0303 as a likely place for the end of this trend. He believes the recent move above the 50- and 100-day moving averages (MAs) acted as the trigger.
Breakout and retest of that line with MAs support was the trigger.
Didn't trade on Bitmex during the holidays, too bad, that was an easy one. pic.twitter.com/43NIR0XnHV
— krillin ॐ (@LSDinmycoffee) December 30, 2019
Will BCH reach the outlined target? How long will it continue to increase? Keep reading below if you are interested in finding out.
Trading Range
The BCH price has been trading in a range between ₿0.026 and ₿0.033 since July 10 — totaling a period of 173 days.
Both the resistance and support areas have been validated four times. While the price briefly dropped below the support area on December 25, the lower levels could not be sustained and the price began a strong upward move that is still ongoing.
This movement caused the price to move above the 50- and 100-day MAs as outlined in the tweet. If the upward move continues, it will cause the bearish cross to be rejected. However, the price is still trading below the 200-day MA, which is likely to offer resistance if the price reaches it.
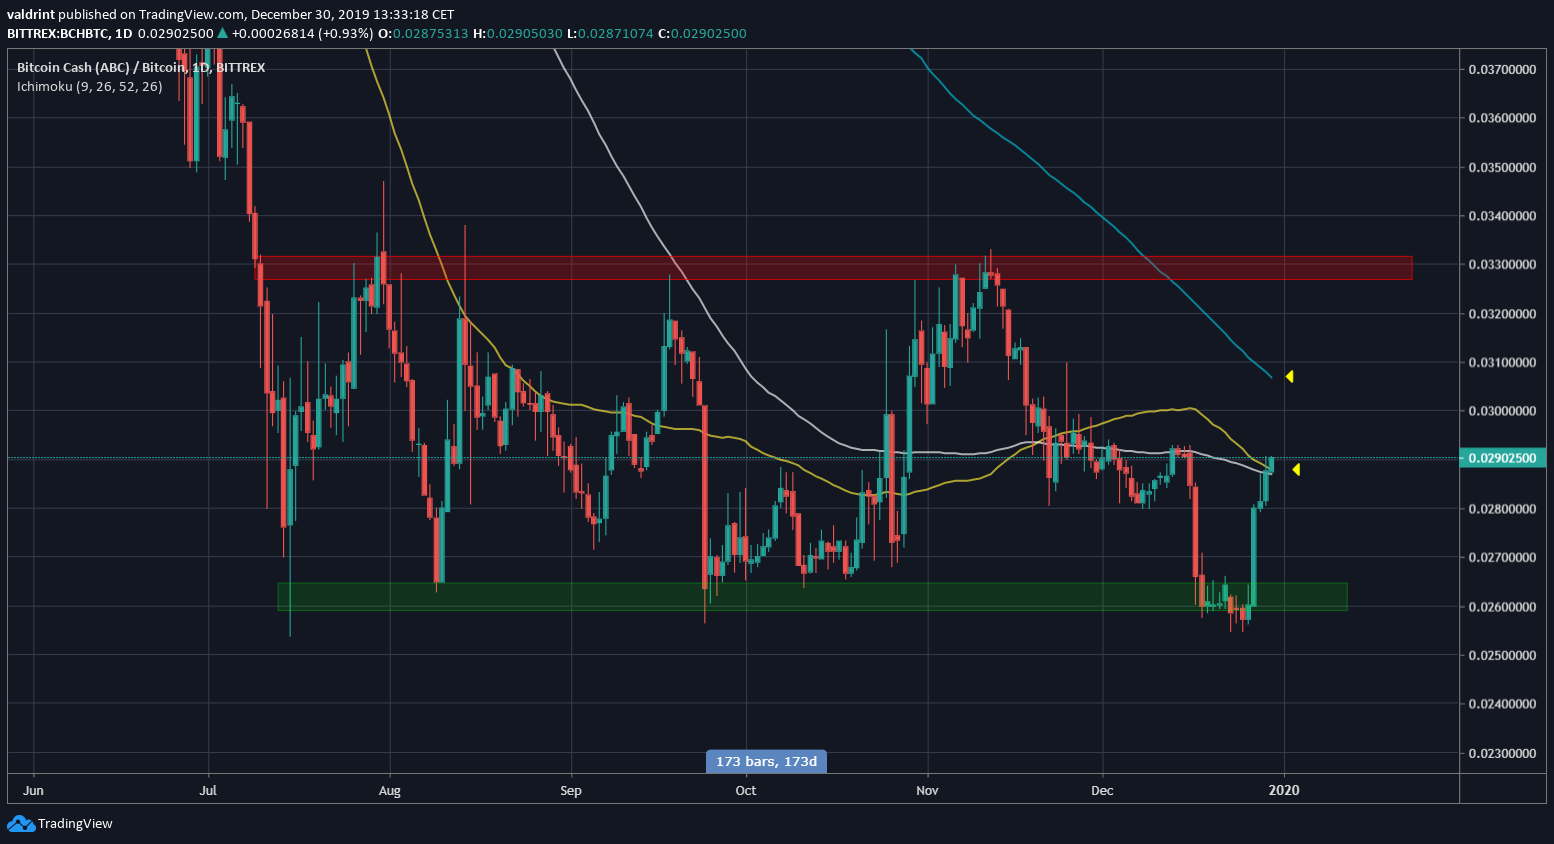
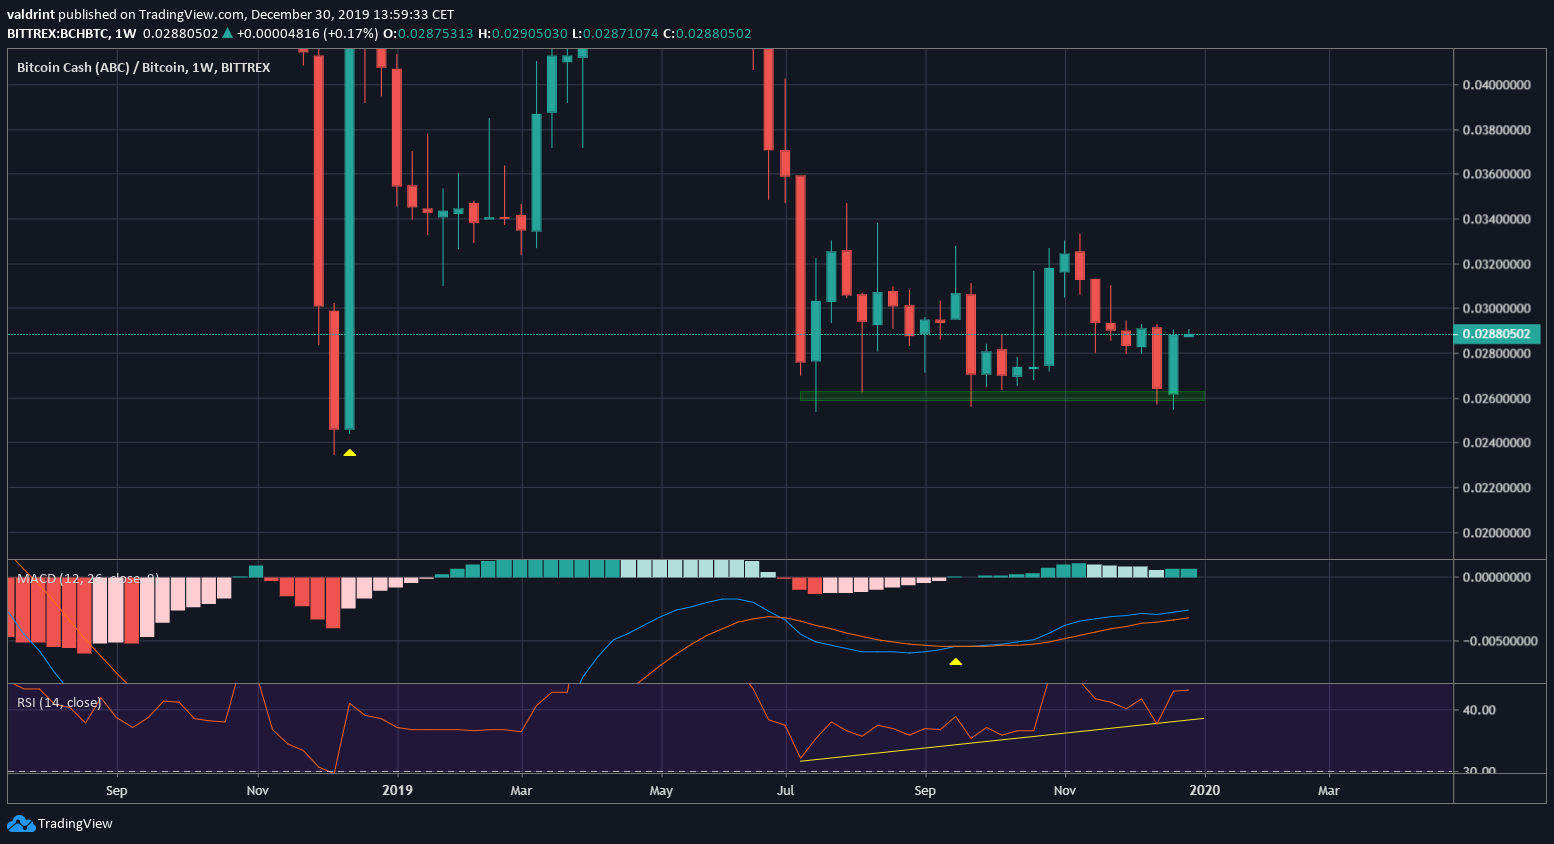
Throughout this trading range, long-term indicators have suggested that the BCH price has possibly made a bottom.
The weekly RSI has generated bullish divergence and the weekly MACD has made a bullish cross. Also, the price has made a sort of triple bottom, which is considered a bullish pattern.
Resistance Areas for Bitcoin Cash
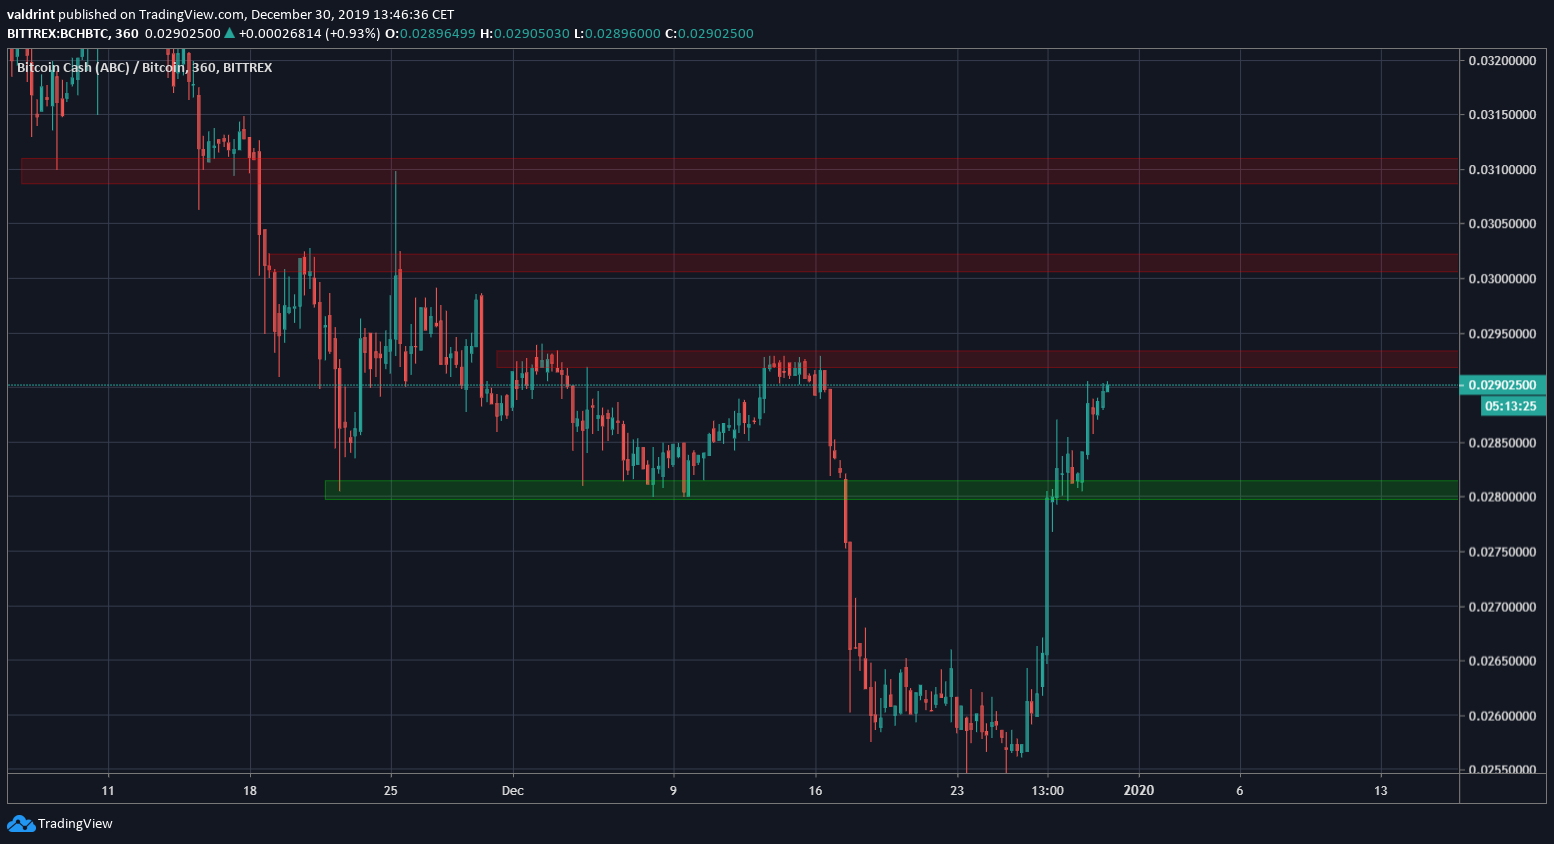
The BCH price has moved above the ₿0,0290 resistance area and validated it as support afterward. The next resistance areas are found at ₿0.0293, ₿0.0302 and ₿0.031, respectively.
The first resistance area at ₿0.0293 represents a full retracement in response to the rapid decrease that began on December 16.
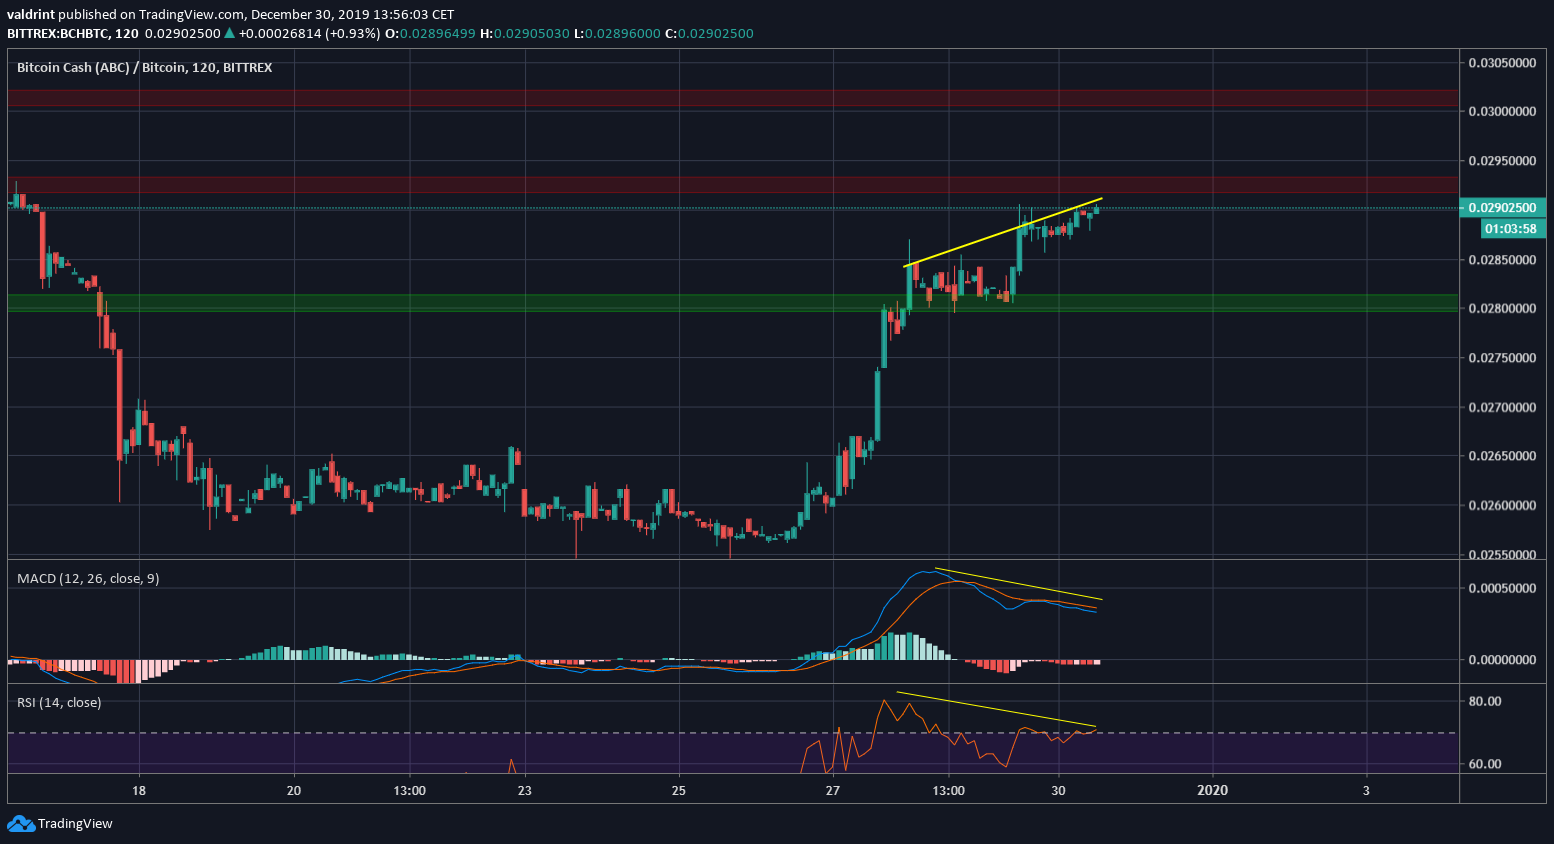
The move that began at the bottom on December 27 has not had almost any retracement at all. Since moving above the support area, the price has begun to show weakness.
There is a very significant bearish divergence developing in both the RSI & MACD. This suggests that the price will decrease. Therefore, while it is possible that BCH increases up to the second resistance area at ₿0.0303, it is more likely that it fails at ₿0.0293 and continues trading in a range between ₿0.028-0.0293 until it makes another attempt at breaking out.
To conclude, the BCH price has likely made a bottom and will soon begin a new bullish market cycle. However, a short-term decrease followed by consolidation is likely to precede this movement.
