
BCH, the native coin of the peer-to-peer electronic cash system Bitcoin Cash, is currently experiencing heightened volatility. This leaves the altcoin susceptible to sharp price swings in either direction.
At press time, BCH trades at $349.68, and its price has remained within a narrow range over the past seven days.
Bitcoin Cash Sees High Volatility
The first volatility marker worthy of note is BCH’s Bollinger Bands (BB) indicator. As of this writing, there is a widening gap between the upper and lower bands of the indicator.
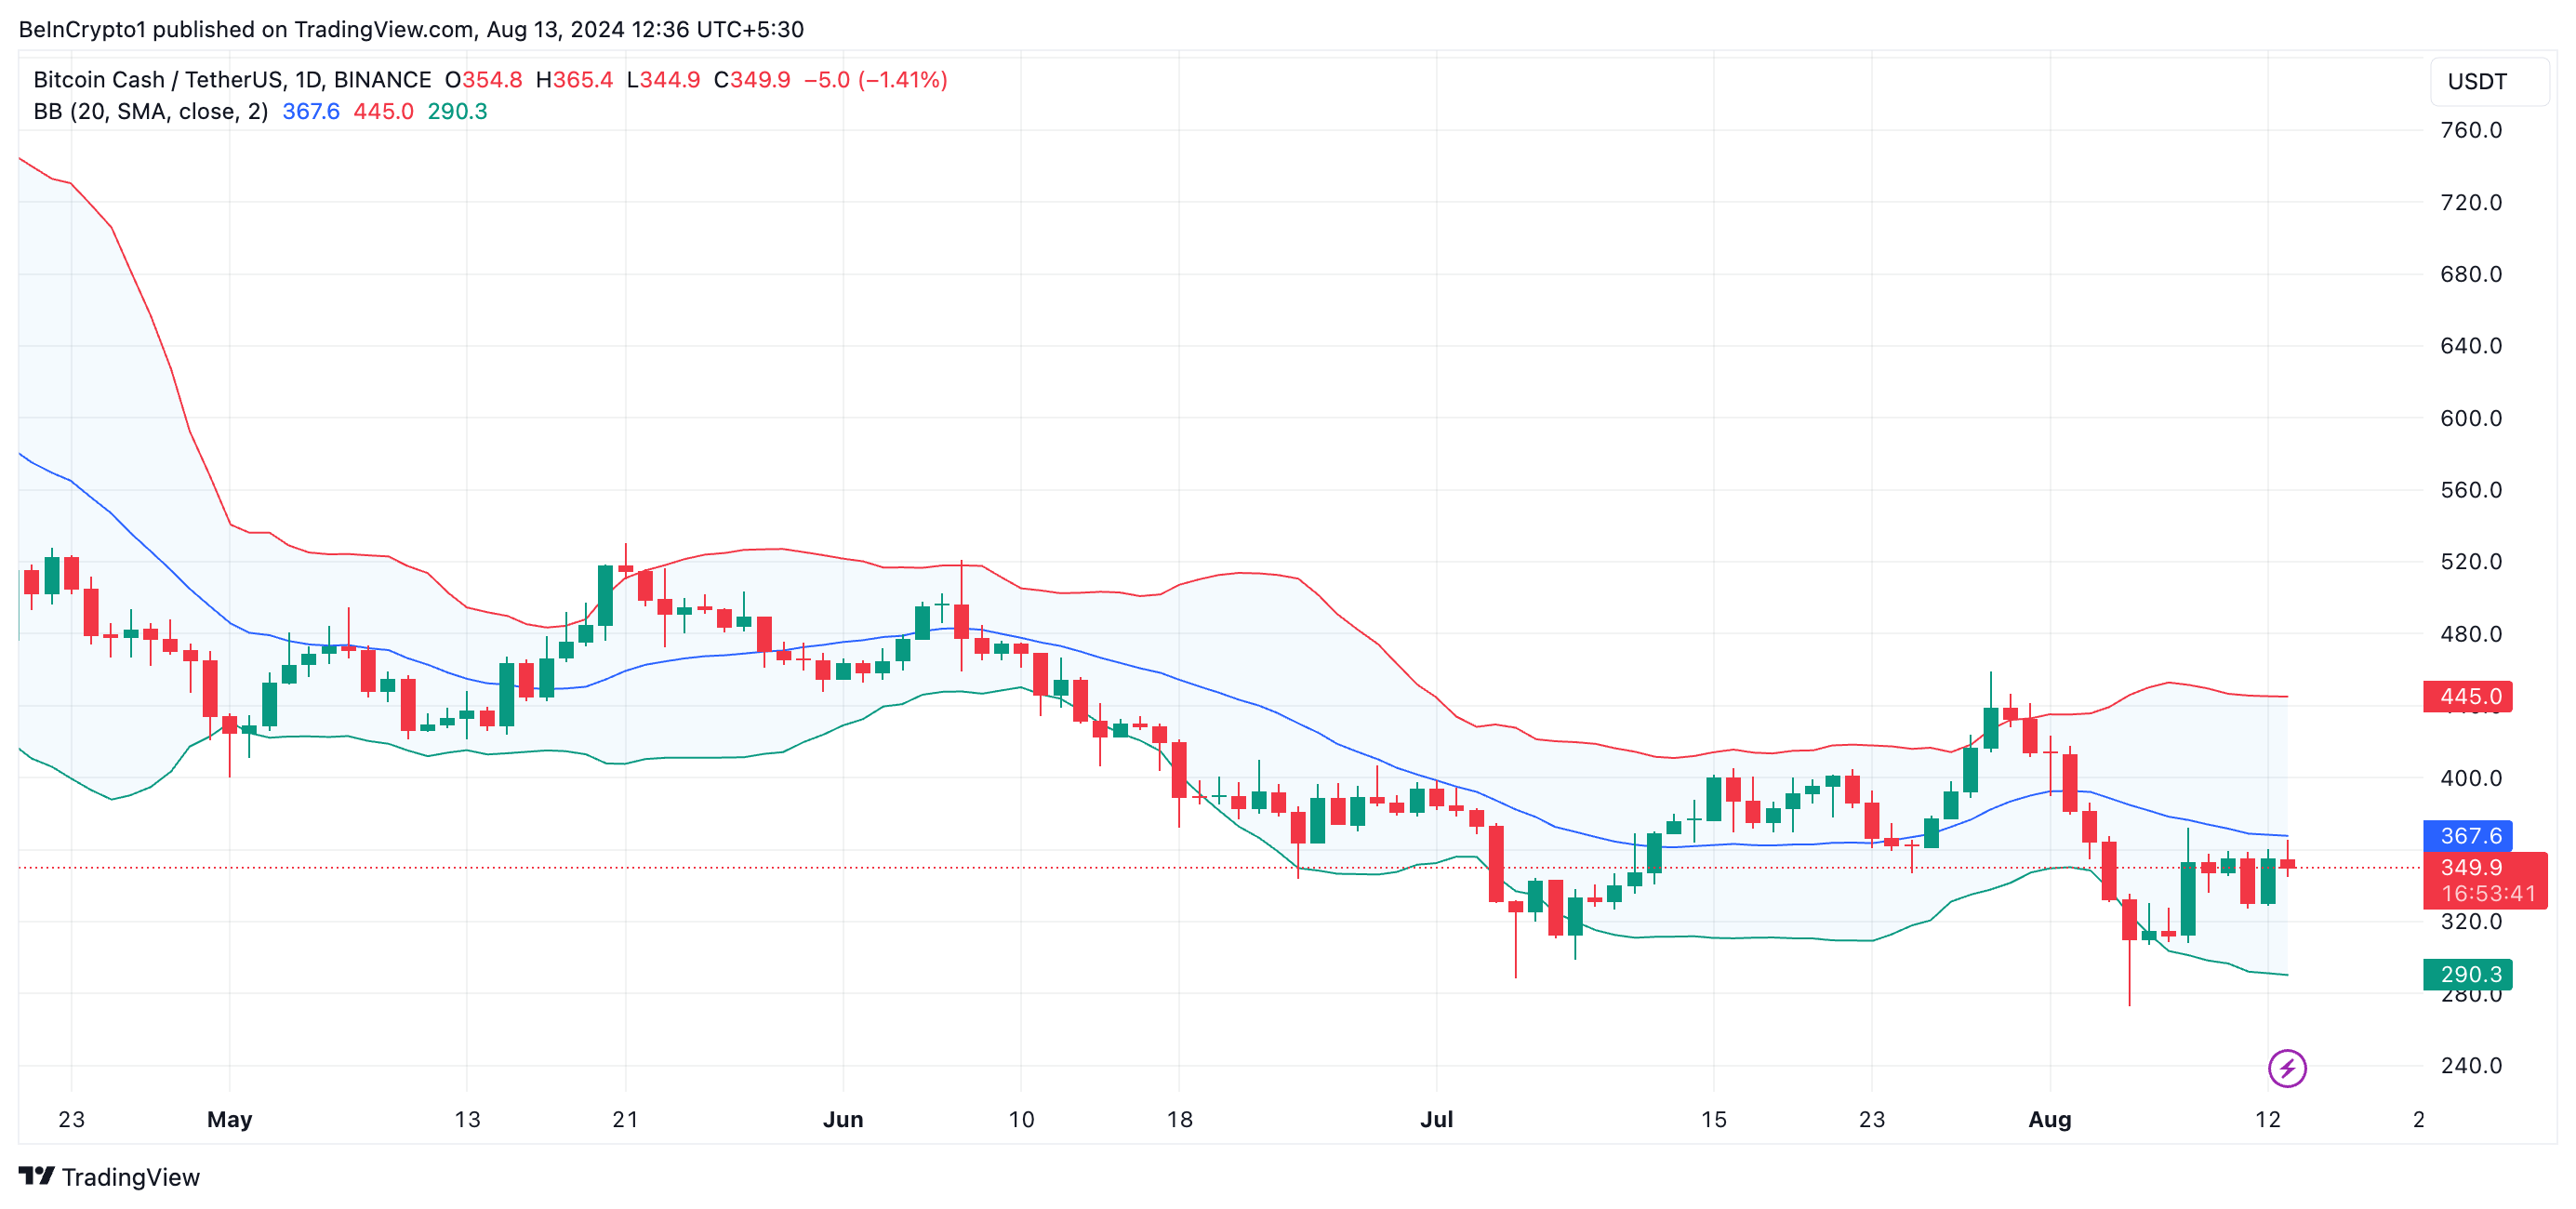
An asset’s BB indicator measures market volatility and identifies potential overbought or oversold conditions. The upper band represents the higher range of an asset’s price movements, while the lower band tracks the lower range.
When the gap between these bands widens, it suggests that market volatility has increased. This usually occurs after a significant price movement in either direction. In BCH’s case, the gap began to widen after the general market downturn of August 5 caused the altcoin’s price to plummet to a seven-month low of $309.90.
Read more: How To Buy Bitcoin Cash (BCH) and Everything You Need To Know
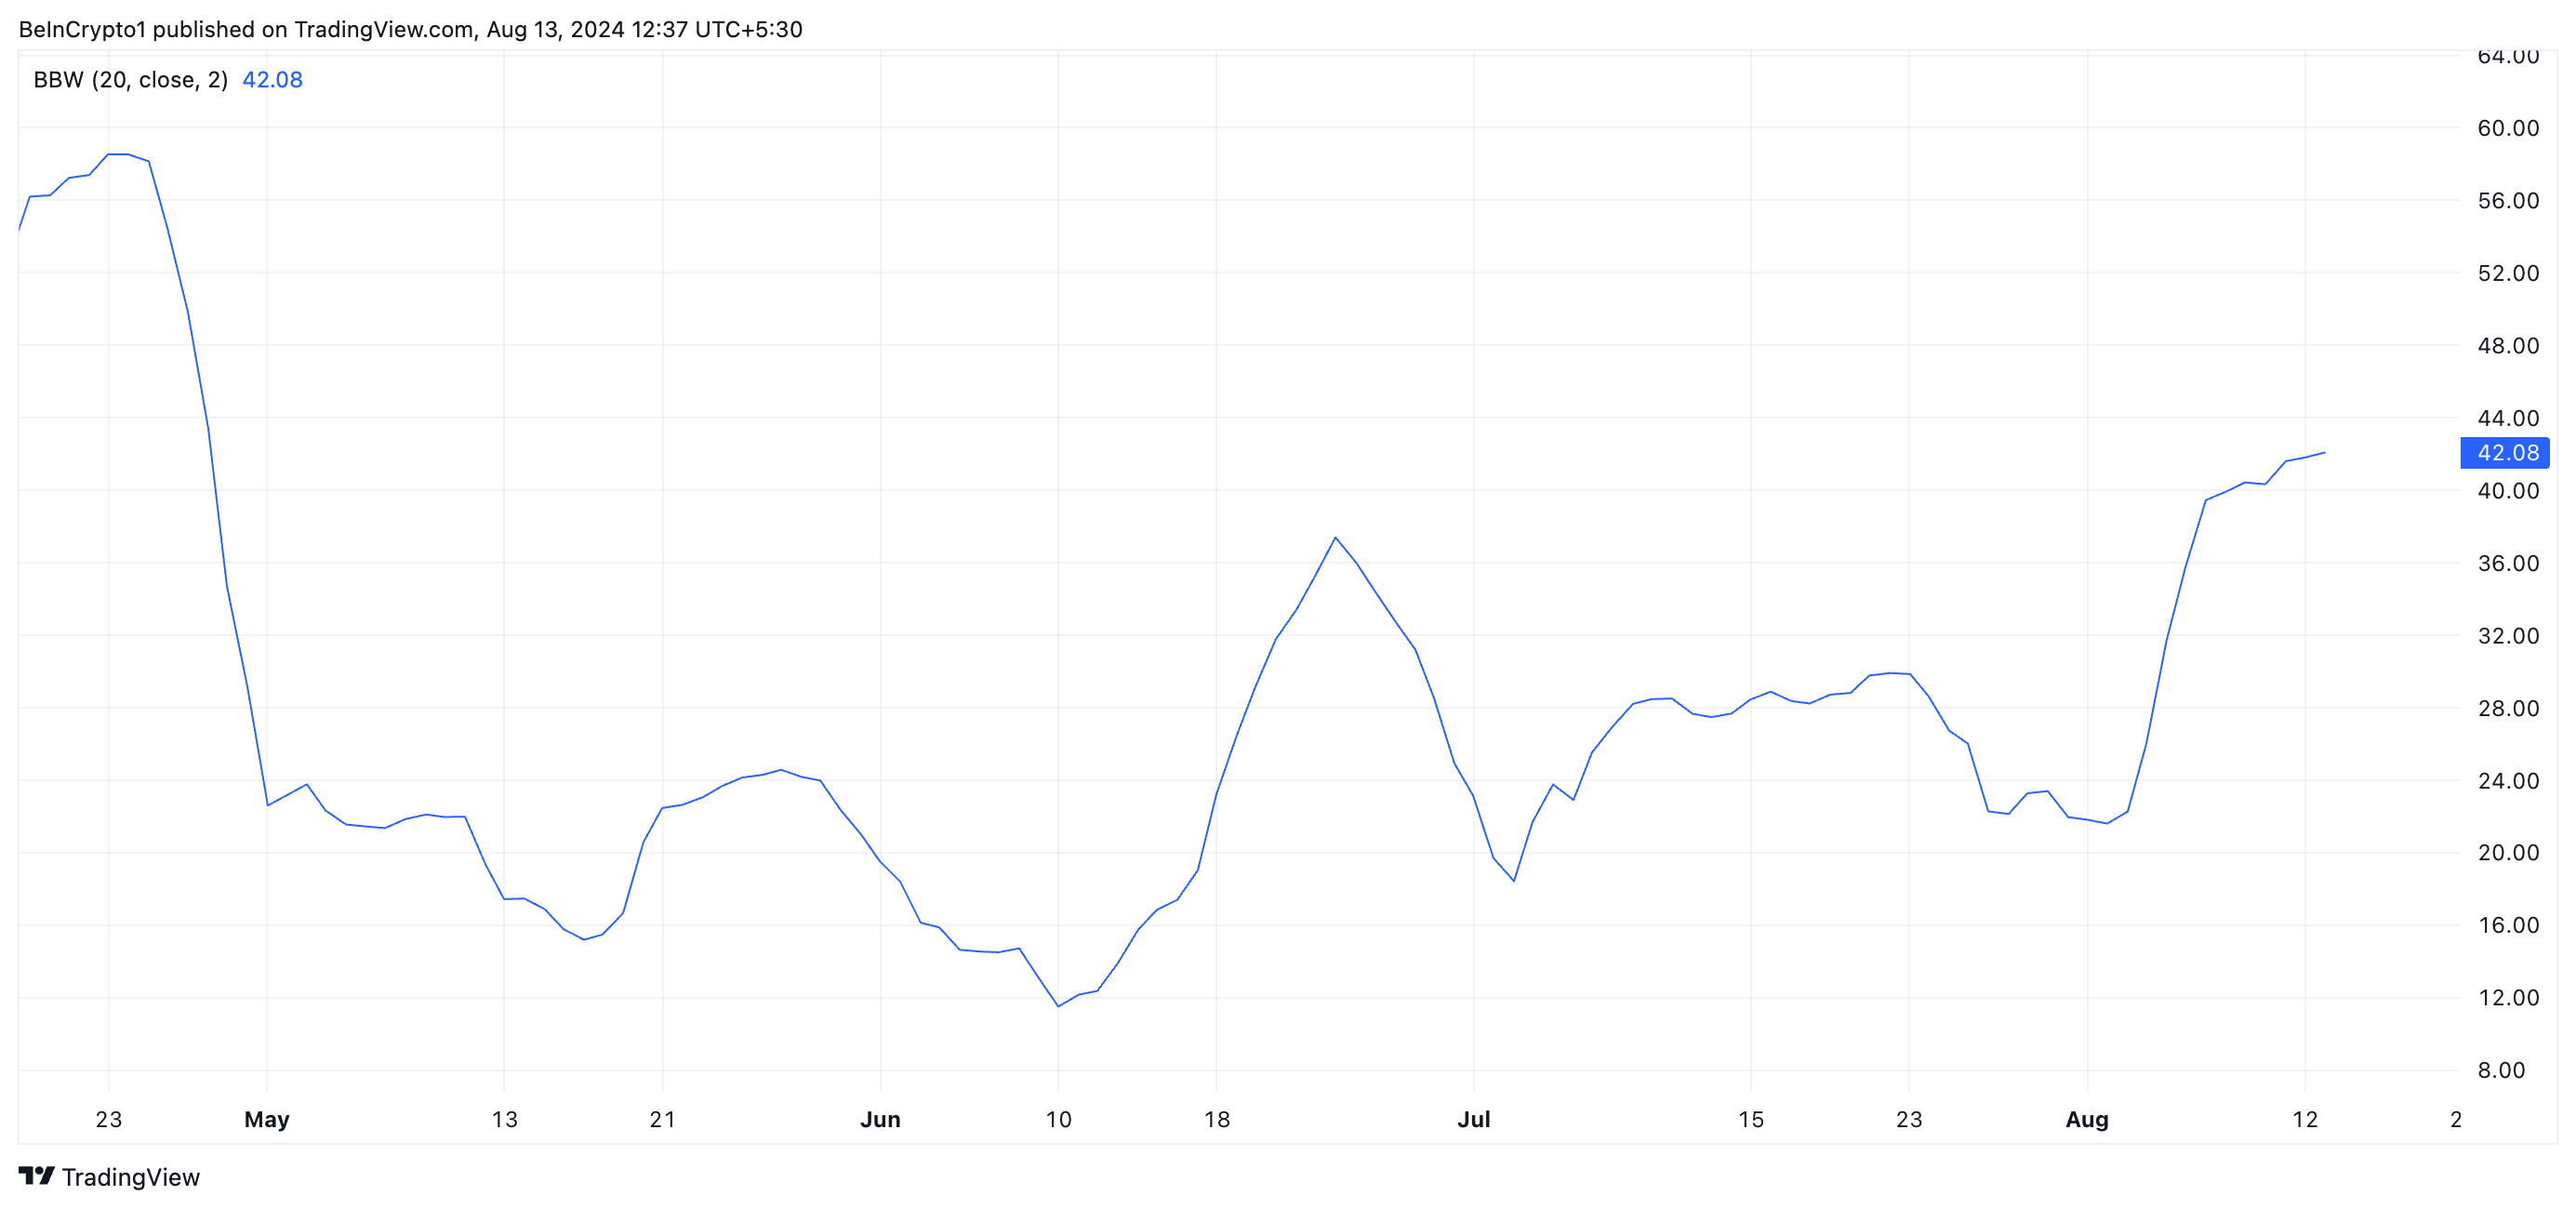
Further, BCH’s Bollinger Bandwidth, which helps traders gauge the market’s volatility and identify potential breakout opportunities, has also spiked since August 5. As of this writing, BCH’s Bollinger Bandwidth value is 42.08, having risen by 32% in the past seven days.
A rising bandwidth such as this indicates that BCH’s bands are far apart, confirming high market volatility.
BCH Price Prediction: Death Cross Means Trouble
BeinCrypto has found that a Death Cross occurred on the BCH daily chart a few weeks ago, increasing the likelihood of a downward breakout in its price.
A Death Cross occurs when an asset’s short-term moving average (the 50-day moving average) crosses below a long-term moving average ( the 200-day moving average). This crossover is a bearish signal, suggesting that the market or a particular asset might experience further declines.
Additionally, the coin continues to be trailed by bearish sentiments, as evidenced by its Parabolic Stop and Reverse (SAR) indicator. As of this writing, the dots of this indicator rest above BCH’s price.
Read more: Bitcoin Cash (BCH) Price Prediction 2024/2025/2030
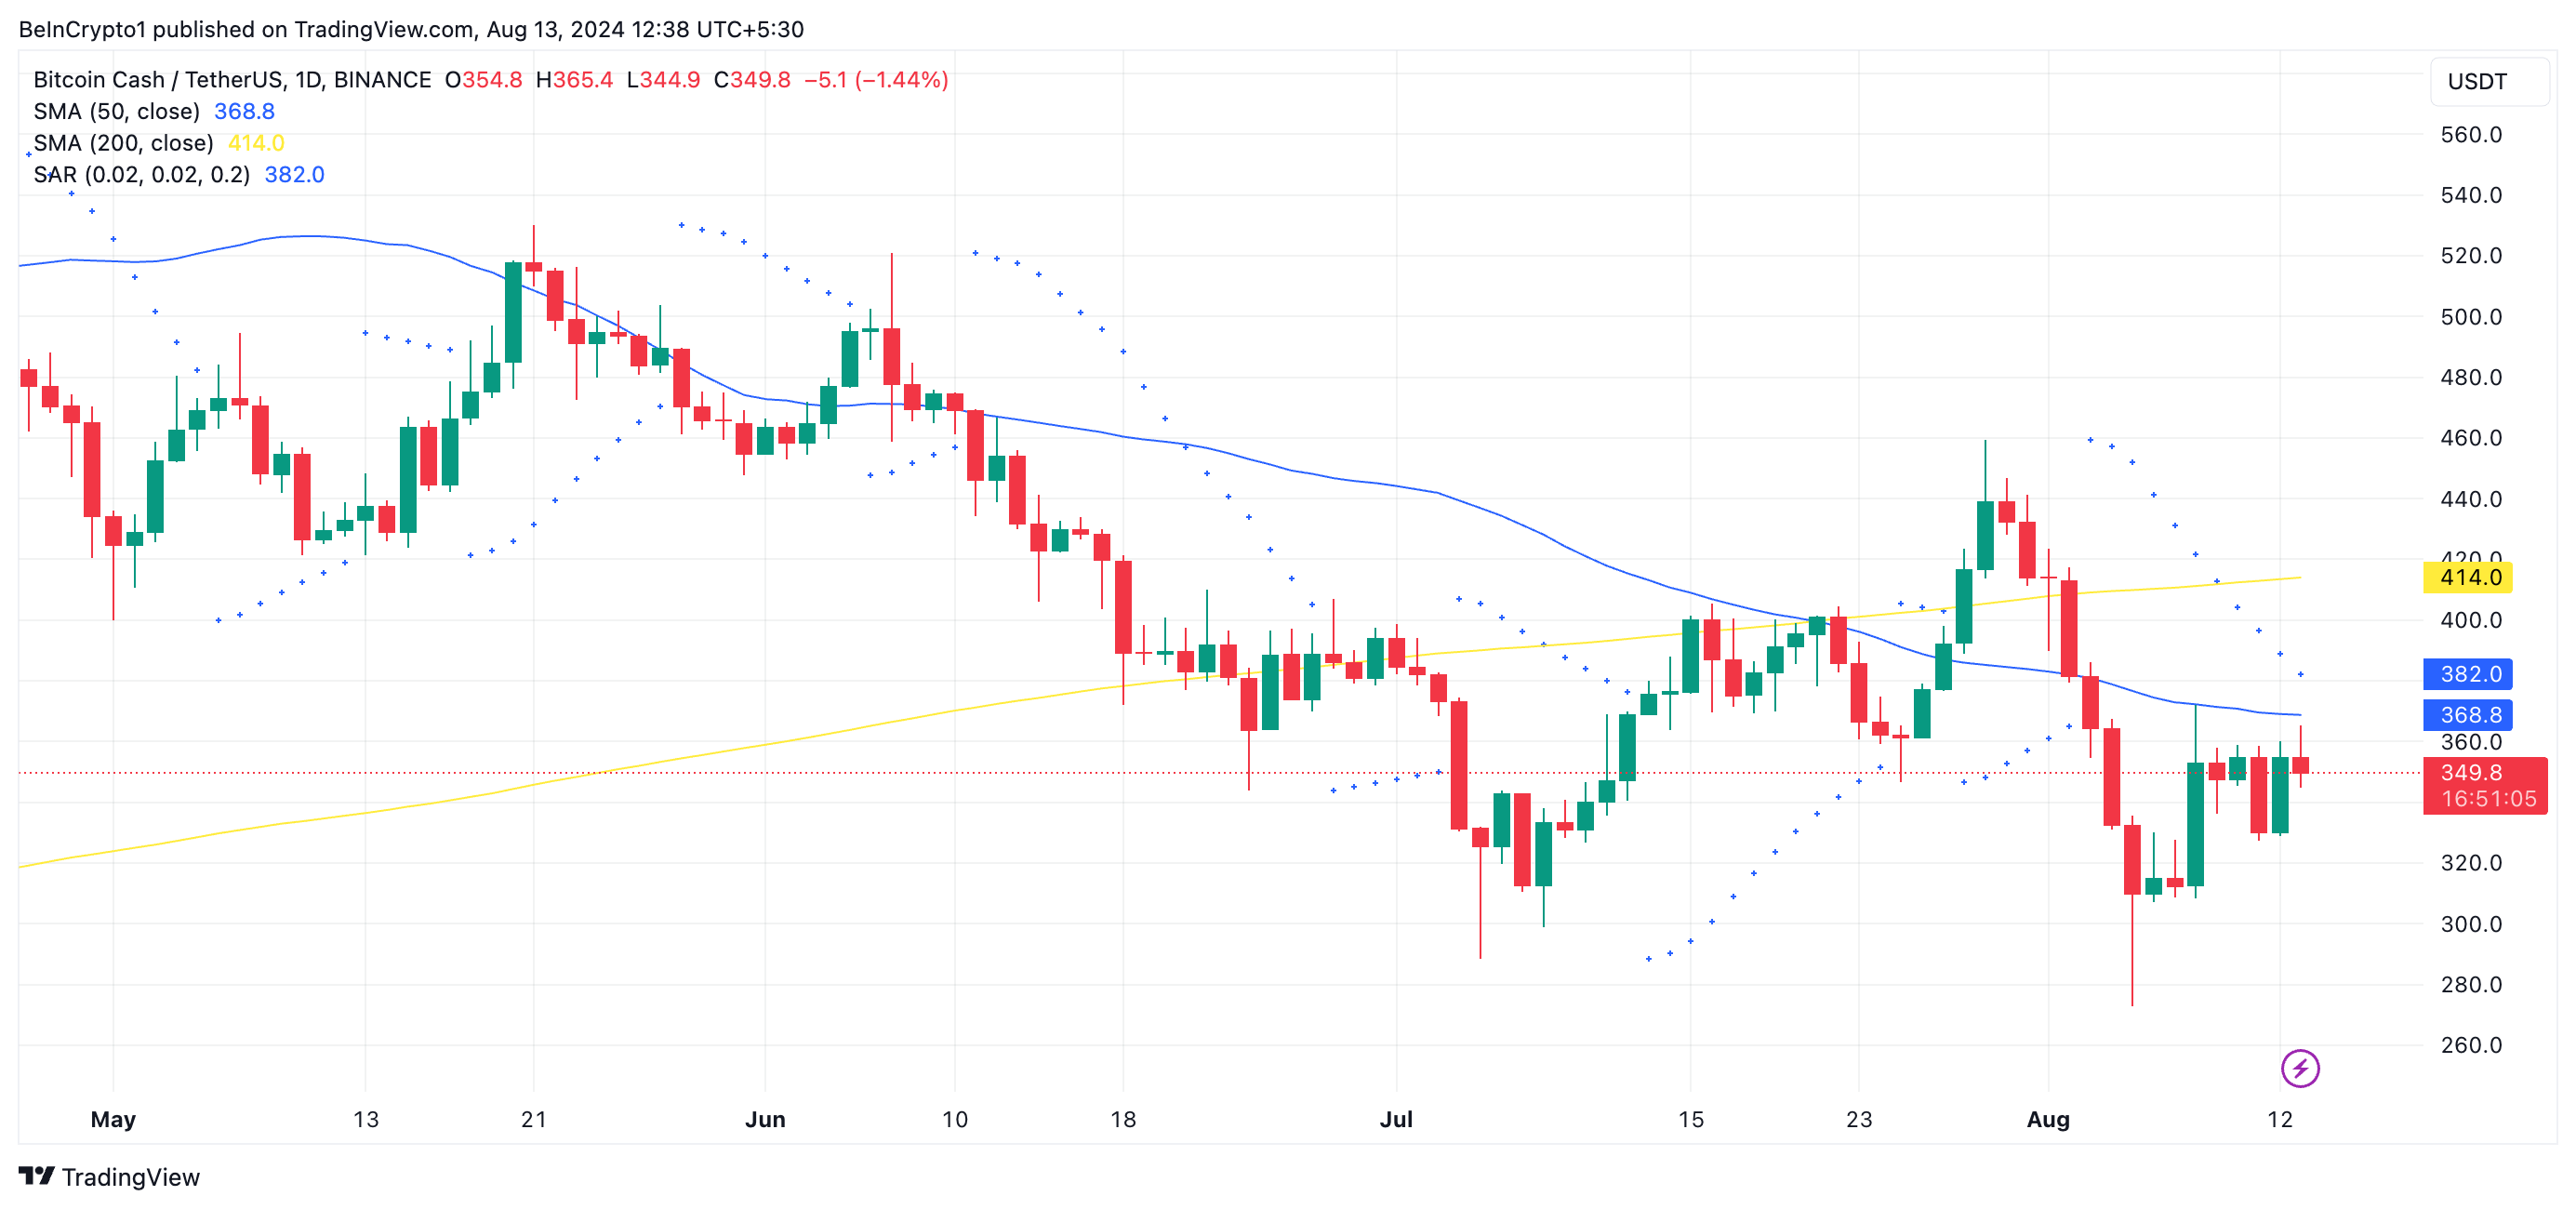
This indicator tracks an asset’s price trends and identifies potential reversal points. When its dots are positioned above the price, the market is in a downtrend. This is a bearish signal that indicates a spike in selling activity.
BCH may fall below the seven-month low of $309.90 if selling pressure gains momentum. It may exchange hands at $272.70.
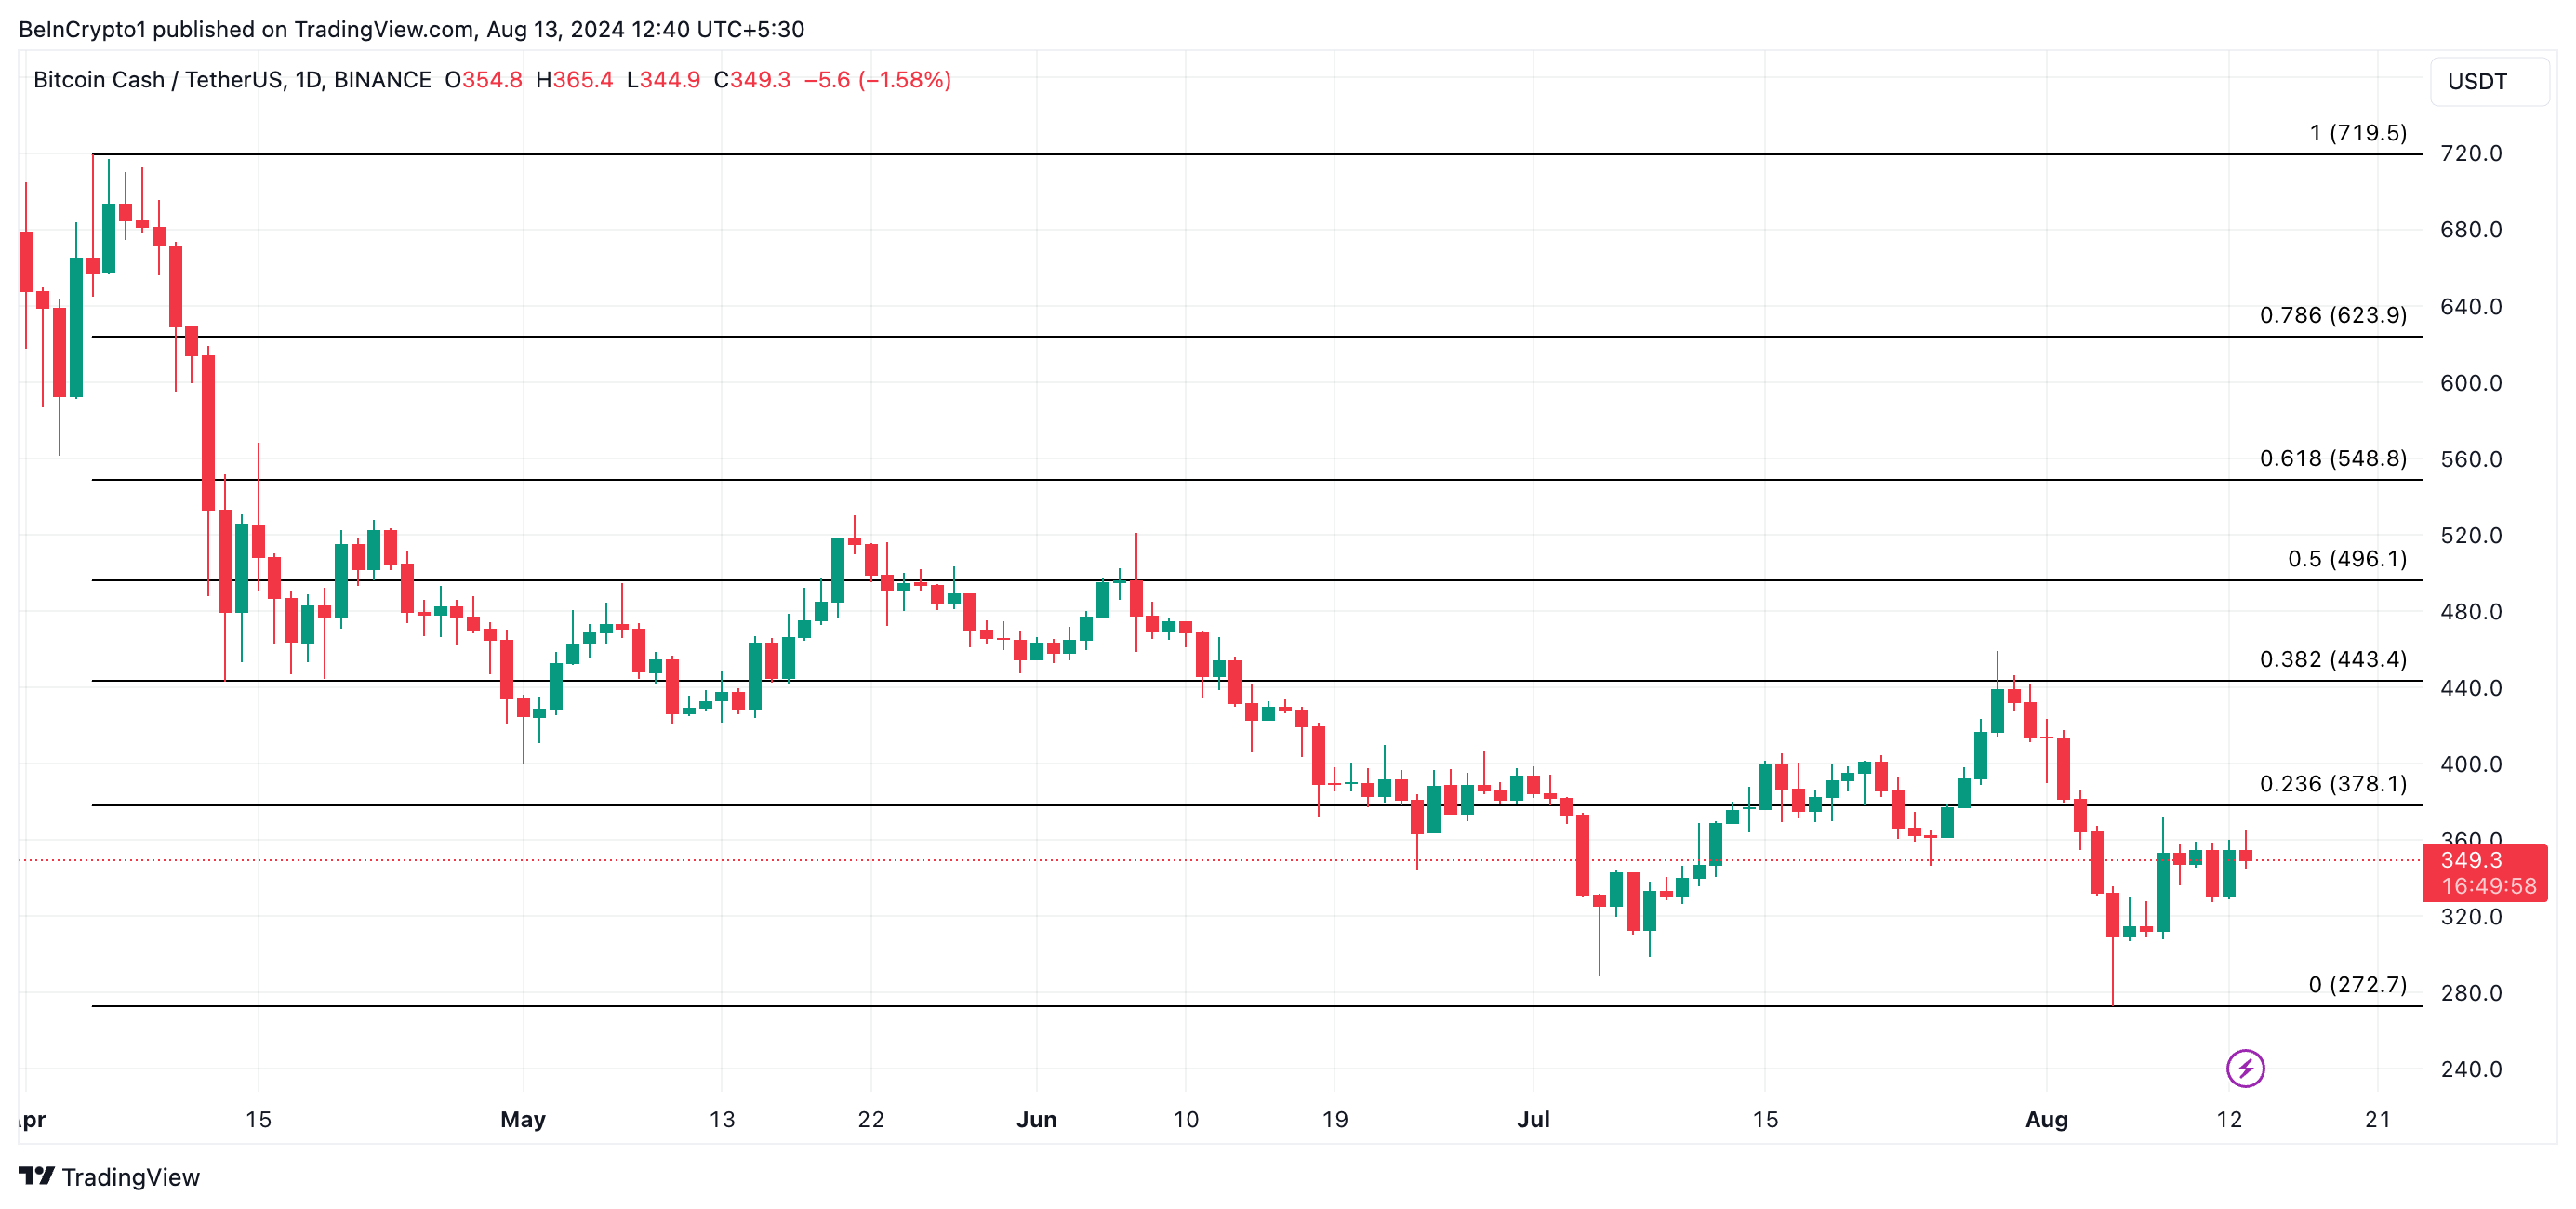
However, a positive shift in market trends can push the coin’s price to $378.10, invalidating the bearish predictions above.
