
On June 5, 2019, the Bitcoin Cash (BCH) price reached lows near $364. A rapid upward move ensued and the price reached a high of $412 the next day. Since then, it has been trading between these two ranges without experiencing significant fluctuations.
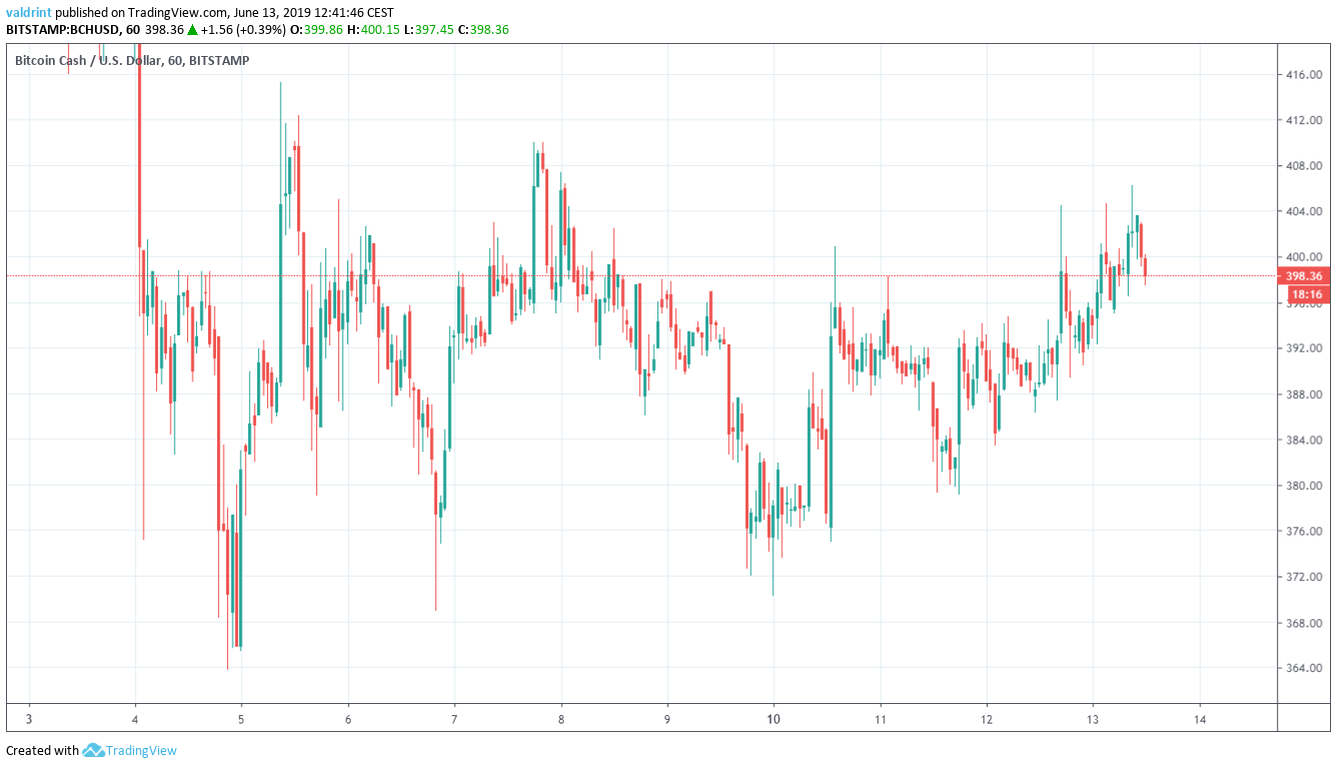
At the time of writing, the BCH price was trading slightly below $400.
Below, we are going to analyze the price of BCH in different time-frames and alongside technical indicators in order to predict its future movement. (Click here for our previous analysis.)
Bitcoin Cash: Trends And Highlights For June 13
- BCH/USD reached a low on June 5.
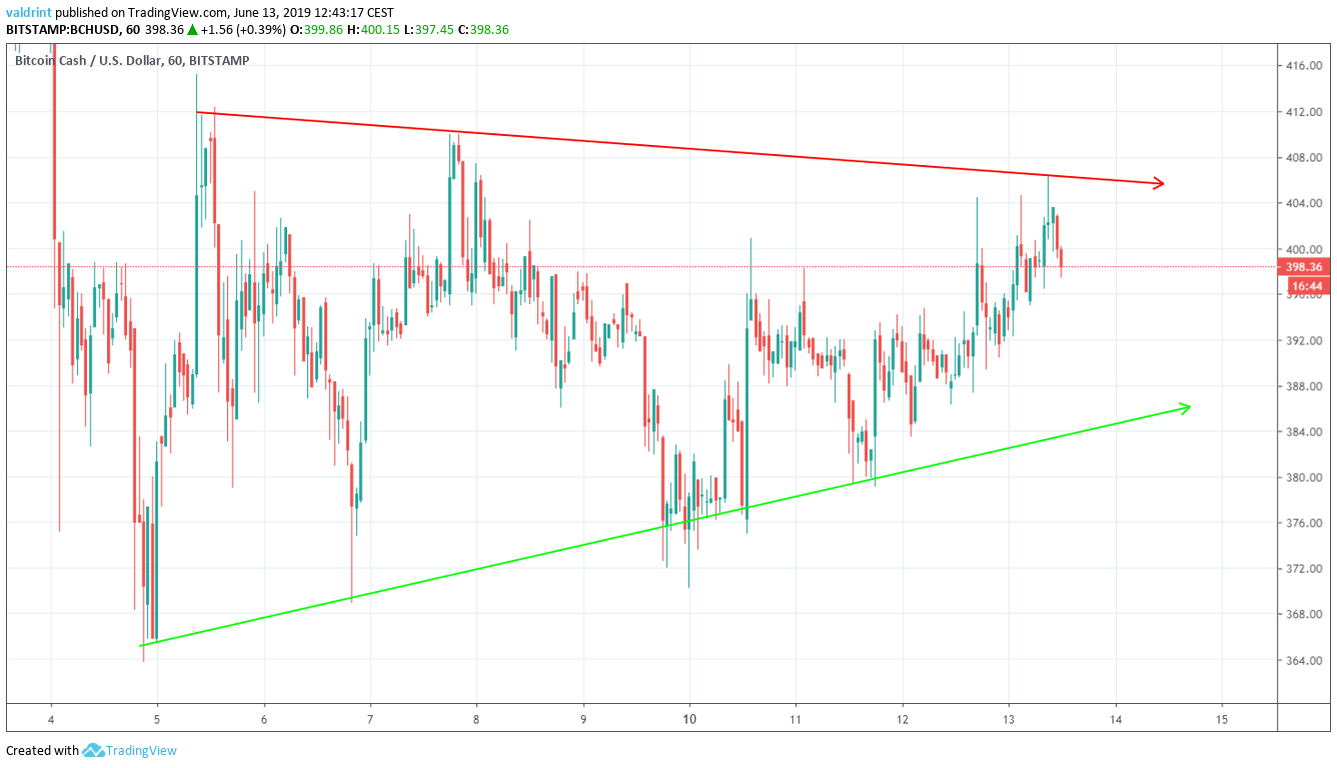
- It is trading inside a symmetrical triangle
- Bearish divergence is developing in the RSI in both short- and long-term time-frames.
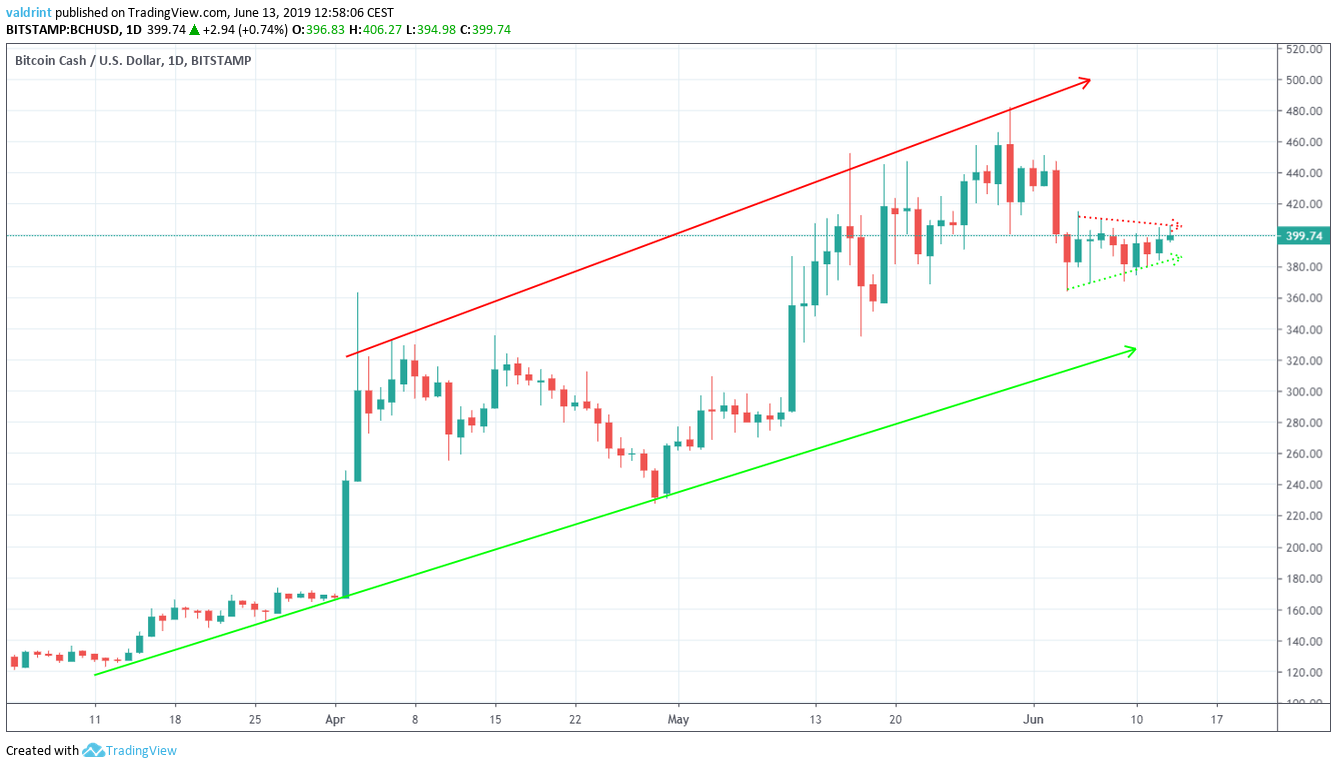
- The 10- and 20-day moving averages (MA) have made a bearish cross.
- There is resistance near $450 and support near $360.
Short-Term Movement
An analysis of technical indicators makes this improbable.
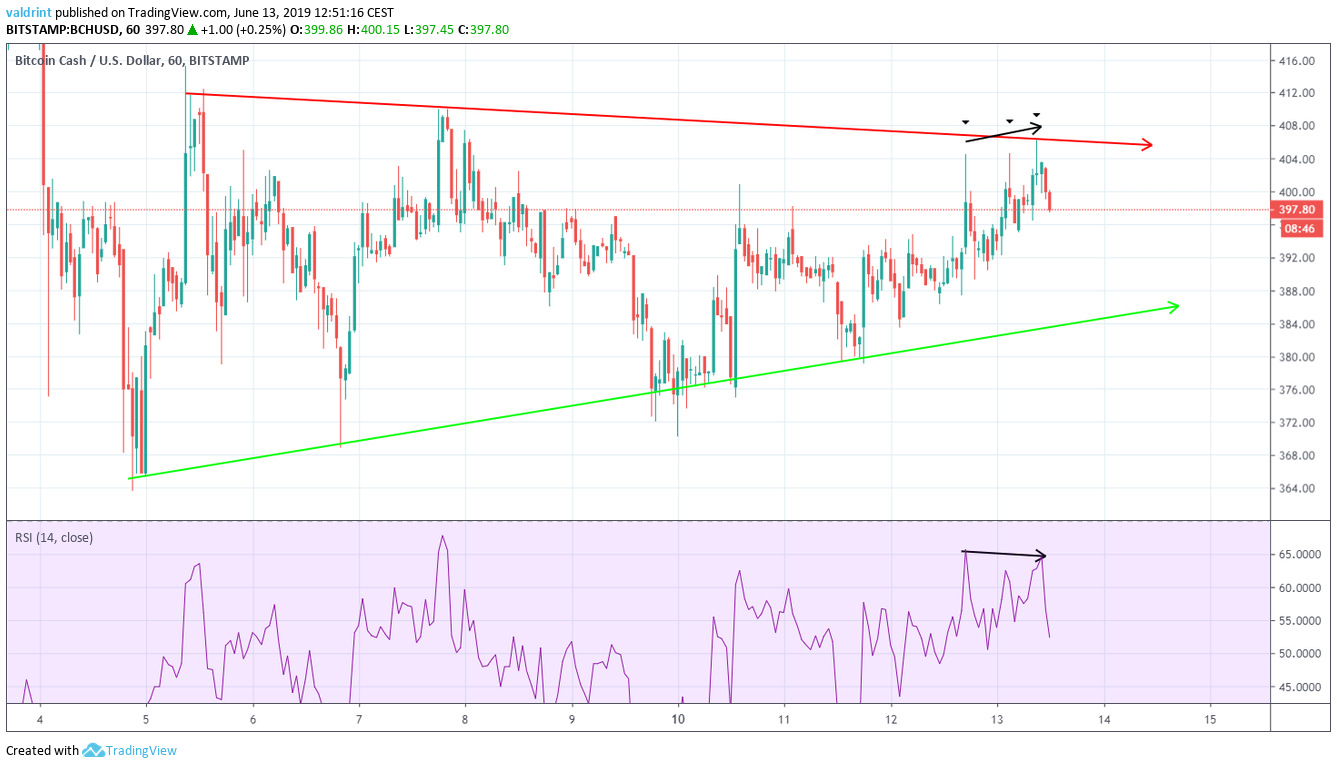
First, the RSI has generated bearish divergence. However, it is only occurring in short-term timeframes and is not very significant in value.
However, the three highest hourly candles since June 12 have been characterized by long upper wicks. This indicates that there is selling pressure in the market.
Therefore, the use of short-term indicators supports a price decrease towards the support line of the triangle.
Bitcoin Cash Price: Long-Term
Will it get there?
An analysis of the RSI and the moving averages say that it is probable that it will.
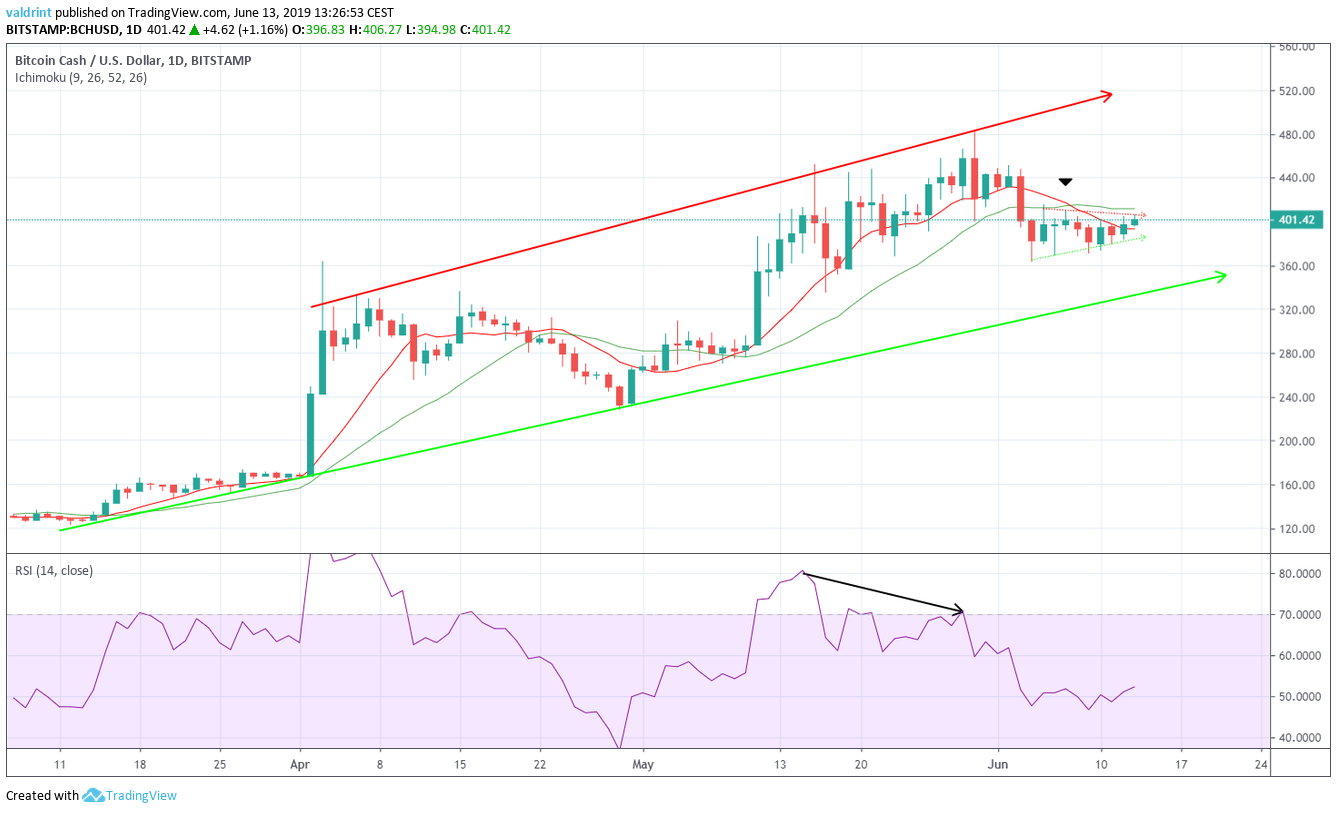
The RSI has been generating bearish divergence since May 14. It culminated with a high on May 28. However, a decrease has already occurred as a result of the bearish divergence. It is not yet clear how long it will last.
Furthermore, a bearish cross occurred on June 6. The previous time this occurred was on Apr 22. Afterward, the price continued to decrease until it bounced at the support line. If the BCH price acts in the same manner, it will eventually reach it.
Reversal Areas
One resistance and one support area are traced for BCH/USD below:
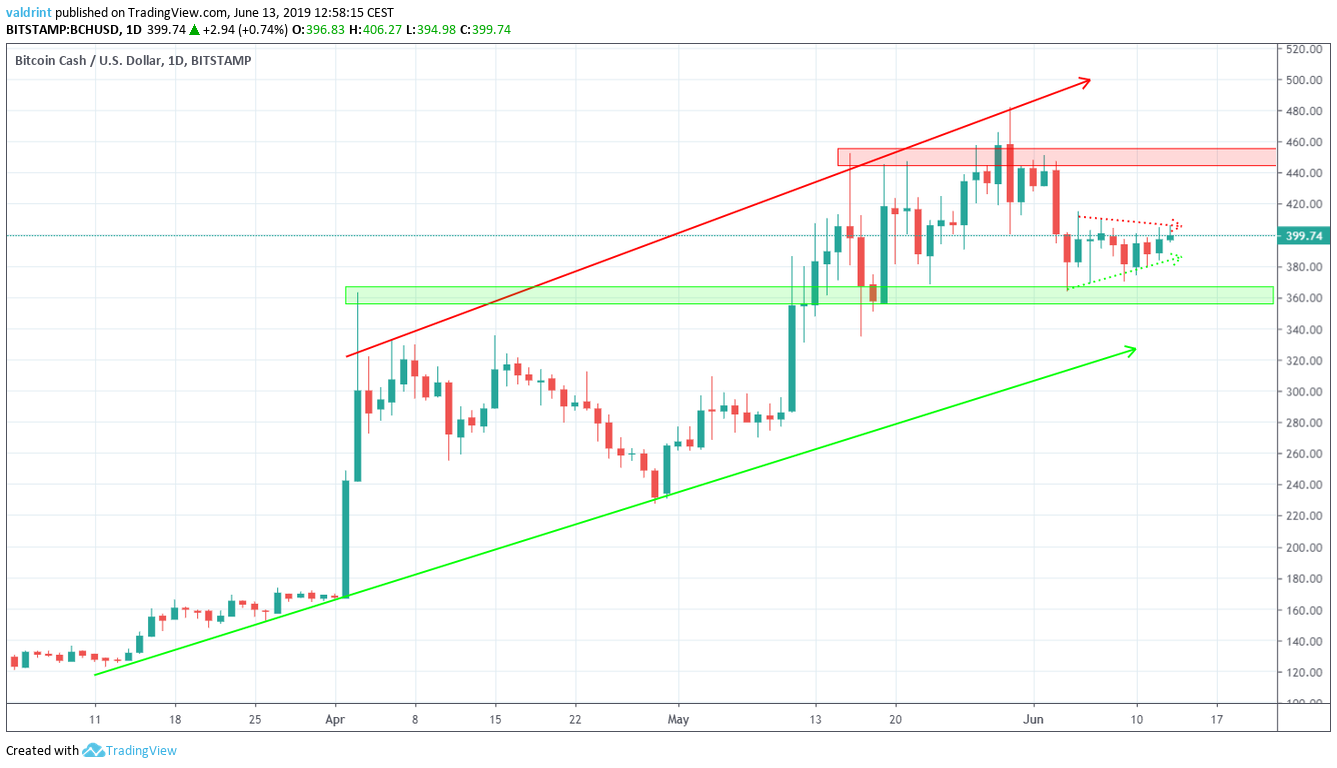
The closet support area is found near $360. Price found support at this level on May 20 and initiated an upward move. It again reached this area in early June. A breakdown below this level would likely take the price to the support line of the channel.
Conversely, the closest resistance area is found near $450.
What do you think about the Bitcoin Cash (BCH) price? Let us know your thoughts in the comments below!
