


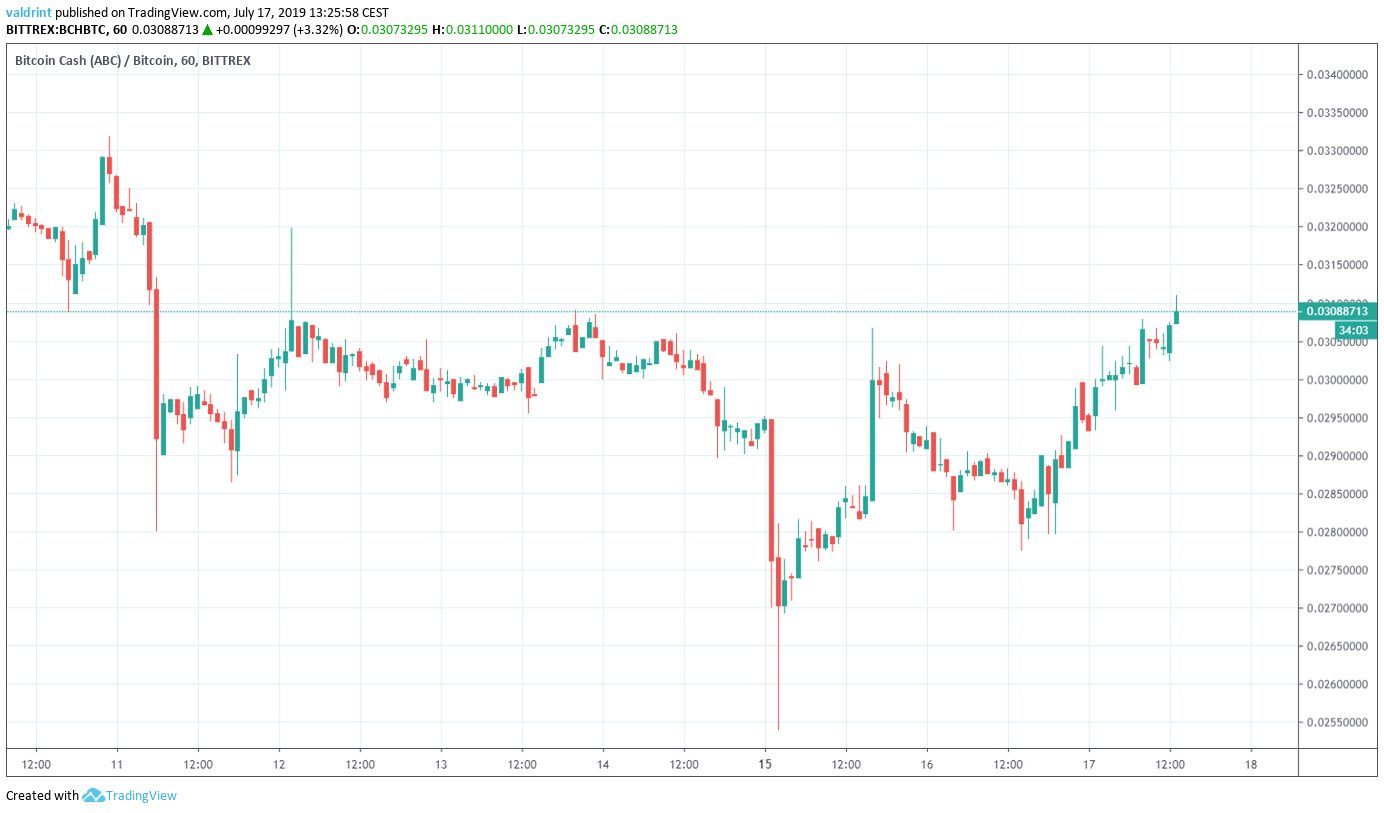
On July 10, 2019, the Bitcoin Cash price reached a high of ₿0.033. A rapid decrease ensued. After trading sideways until July 15, another decrease followed. BCH reached a low of ₿0.0255. Since then, it has been increasing.
How long will this increase continue? Below, we are going to analyze the BCH price in different time-frames alongside technical indicators in order to answer this question.
For our previous analysis, click here.
Bitcoin Cash Price: Trends and Highlights for July 17
- BCH/BTC is trading inside an ascending triangle.
- Short-term moving averages have made a bullish cross.
- There is bullish divergence developing in the RSI.
- There is significant support near ₿0.025.
- There is resistance near ₿0.035.
BCH Price: Ascending Triangle
Since the aforementioned decrease transpired on July 11, the BCH price has been struggling to break out above ₿0.331.
At the time of writing, it was attempting to do so for the third time.
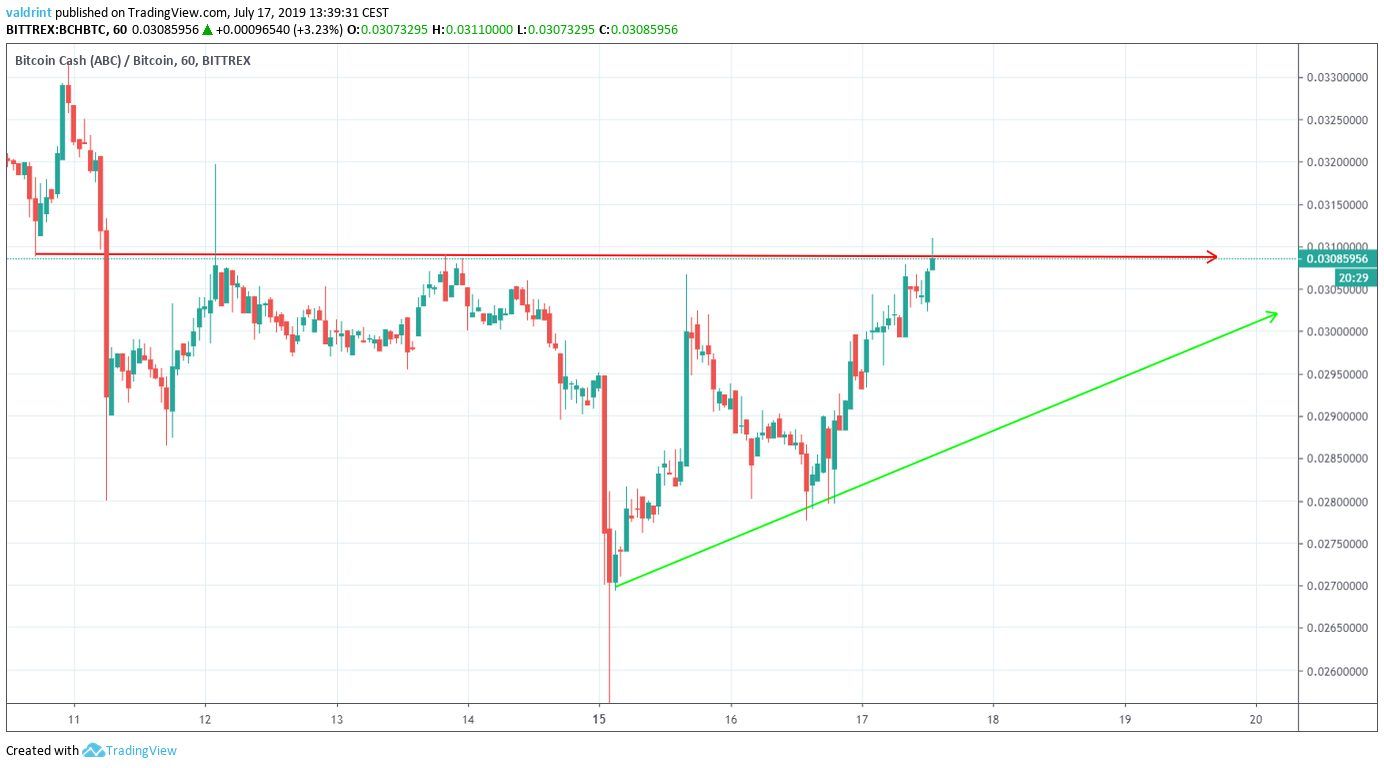
Additionally, since making a low on July 15, BCH has been following an ascending support line.
Combined with the resistance line at ₿0.031, this creates an ascending triangle.
The ascending triangle is a bullish pattern, making Bitcoin Cash price breakouts more likely.
A look at moving averages (MA) also hints that a breakout may soon occur.
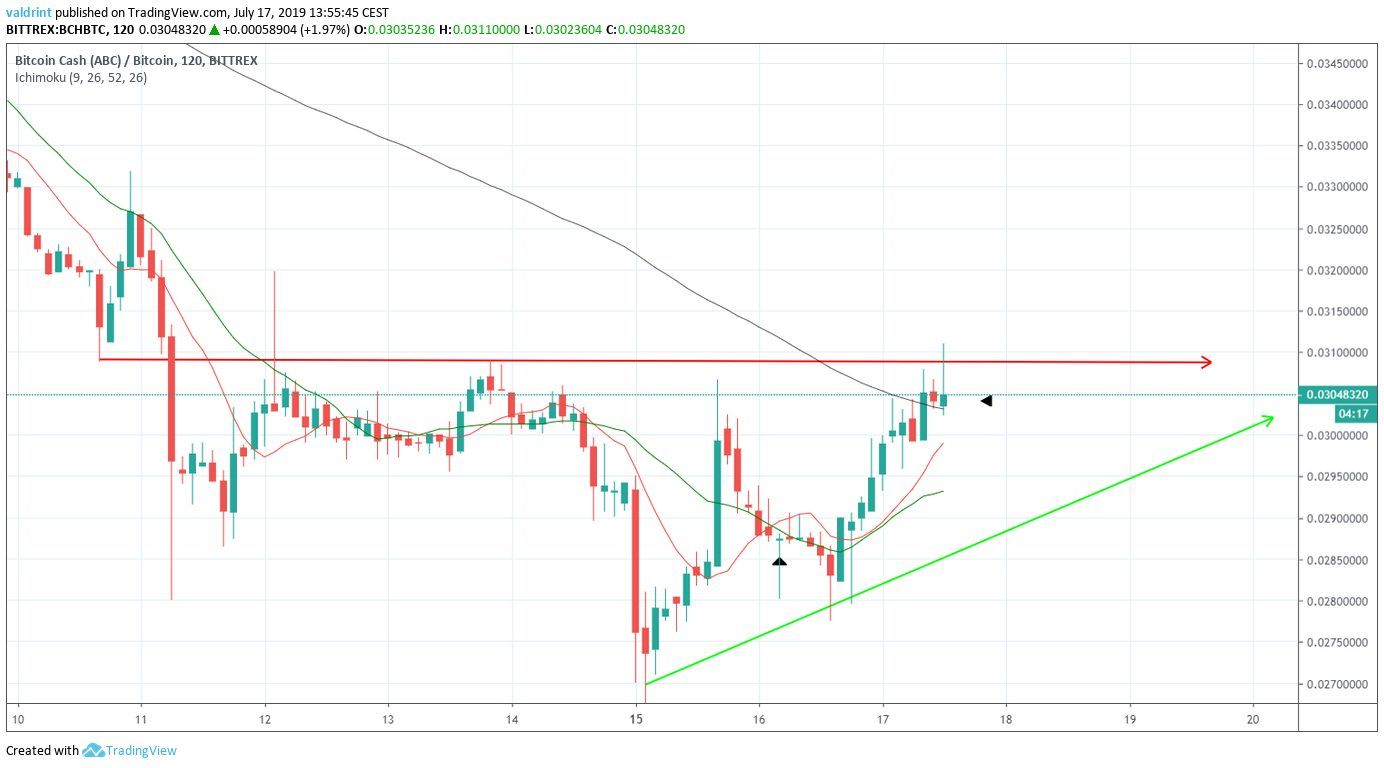
On July 16, a bullish cross transpired between the 10- and 20-period MAs. They have been offering support to the BCH price since.
Additionally, recent price movements caused it to increase above the 100-period MA.
While it has seemingly found support above it, we do not have confirmation yet.
While the MAs suggest a breakout, it will not necessarily happen immediately.
It is possible that the price will continue trading inside the triangle before it eventually breaks out.
Breakout Target
A look at the daily chart shows that the Bitcoin Cash price has almost reached a very significant support area, created by the lows experienced in December 2018.
The price has not traded at this level since.
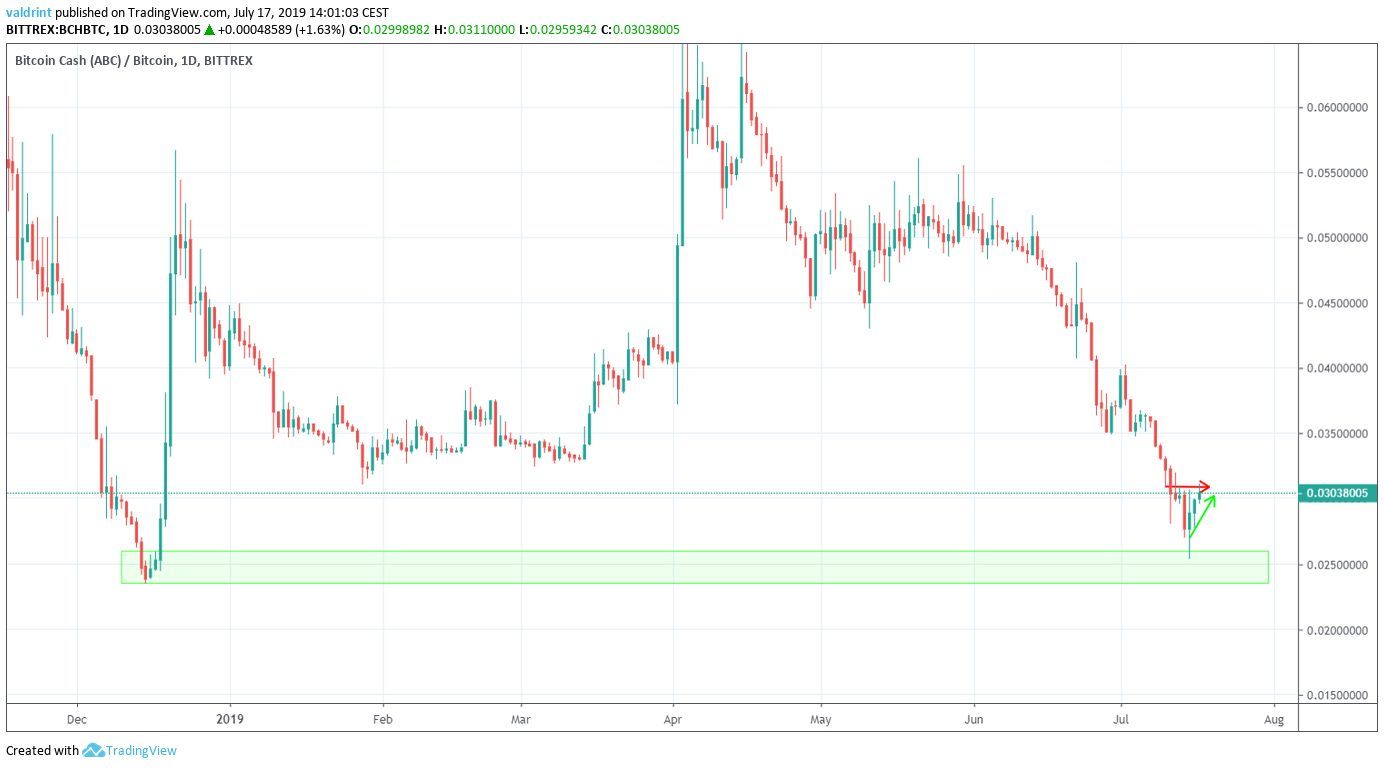
Once it reached the area, it immediately began an upward move.
This is especially visible once we take a closer look at the candlestick for July 15, that had a long lower wick.
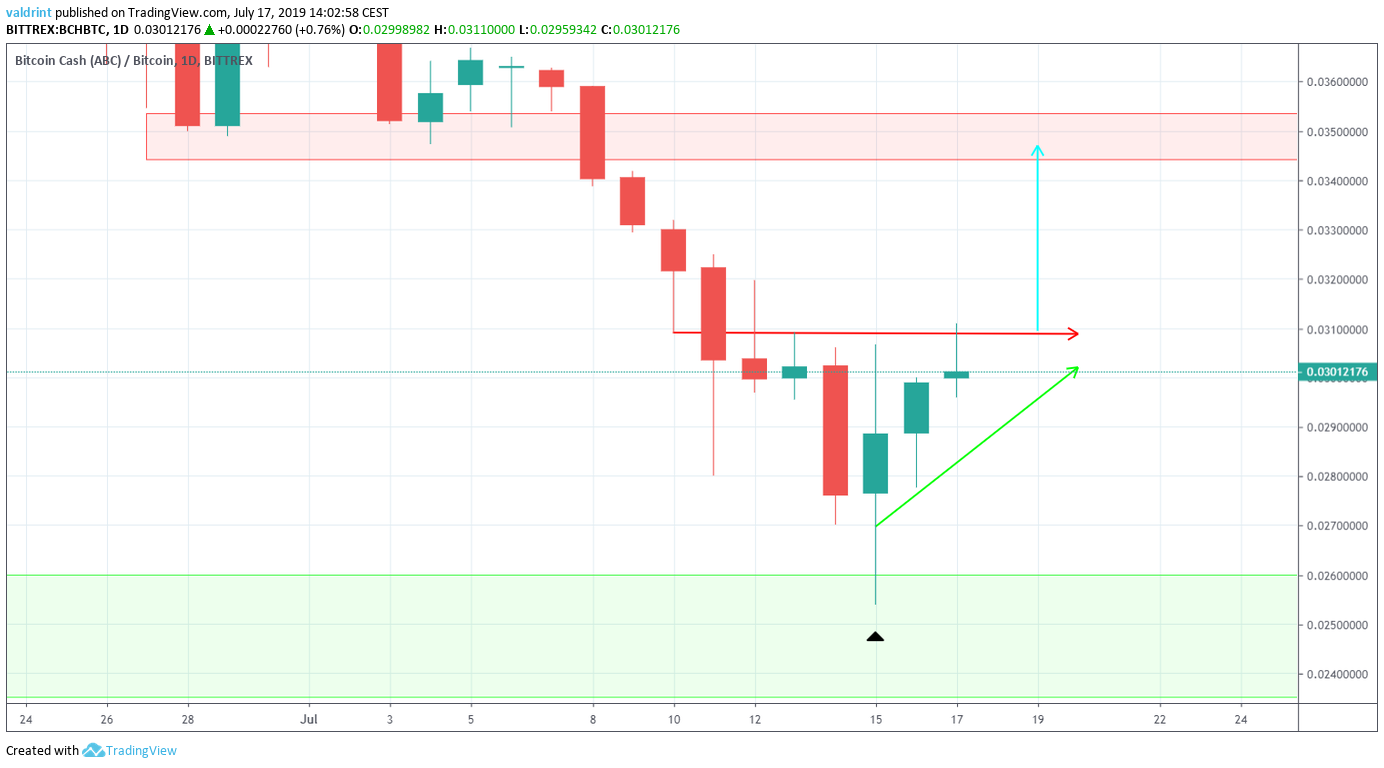
Also, we can see a significant resistance area near ₿0.035.
The blue arrow is the height of the triangle projected at the breakout point.
If the BCH price increases by the complete height of the triangle, it will reach the resistance area.
This hypothesis is also supported by the bullish divergence that has been developing in the RSI since June 23.
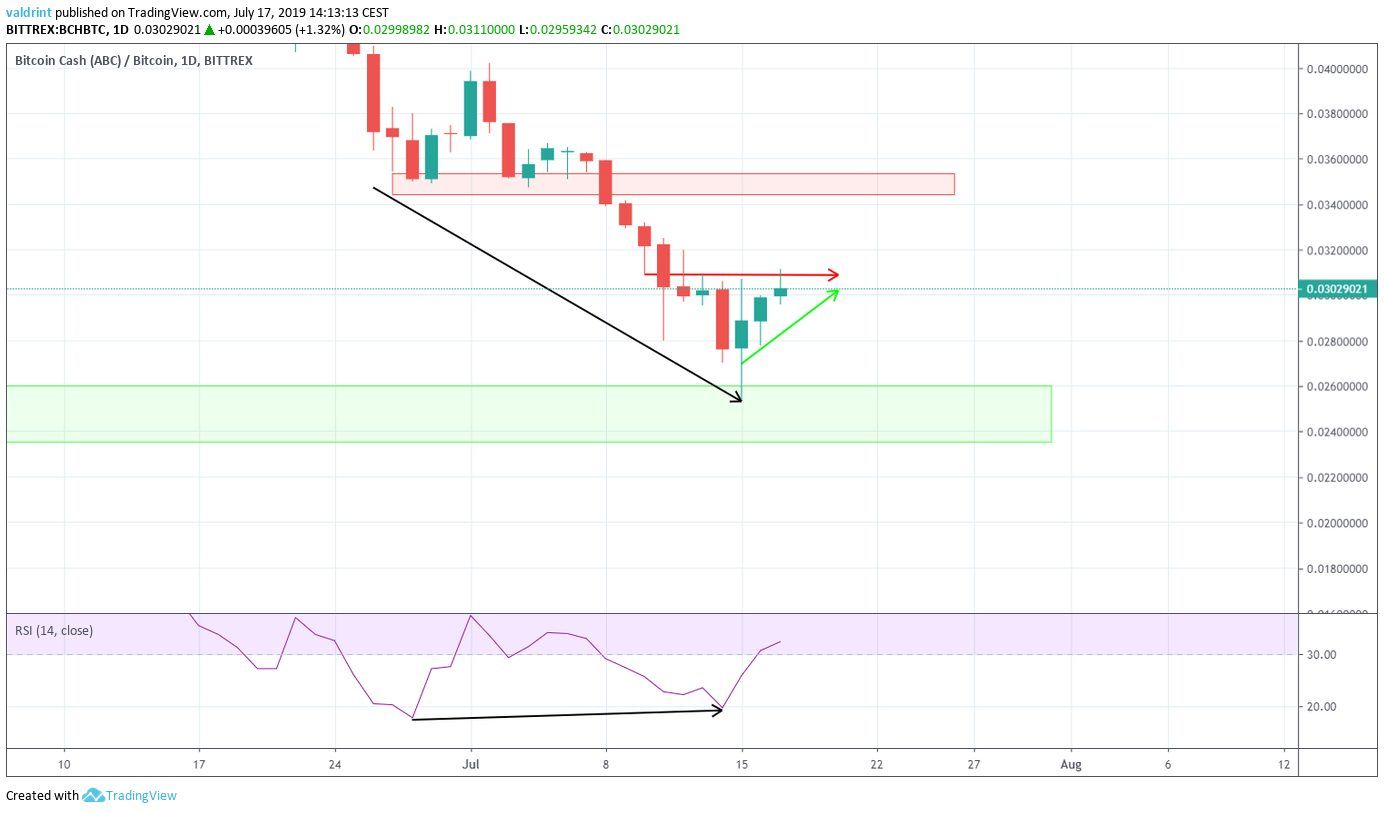
While the divergence is not present in the MACD, the fact that it is occurring inside a bullish pattern increases its significance.
The combination of these indicators makes it likely that BCH will soon break out from the triangle.
Summary
The BCH price is trading inside an ascending triangle.
According to our analysis, it is likely to break out from this triangle and reach the resistance area outlined above.
Do you think the BCH price will break out from the triangle? Join our Telegram Signals group.


