
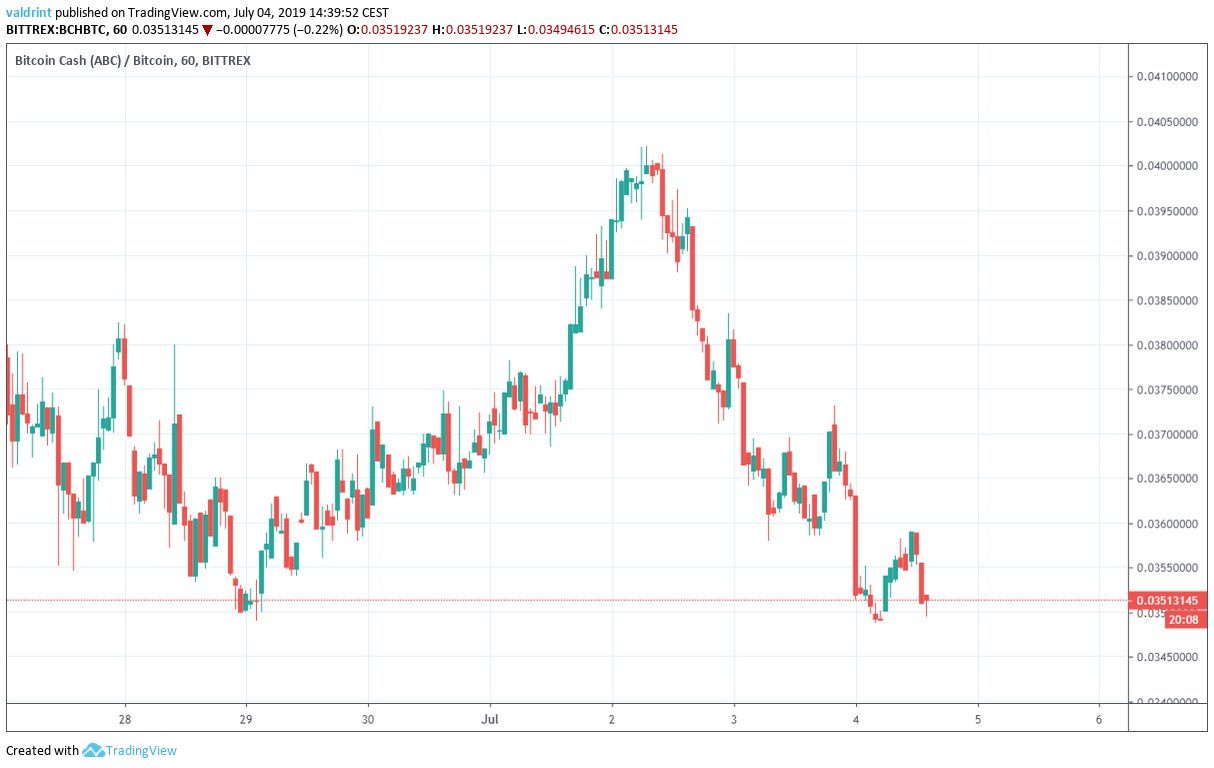
On June 29, 2019, the price of Bitcoin Cash made a low of ₿0.0349. An upward move ensued shortly after. However, the BCH price again dropped to the ₿0.035 level on July 4.
Will it initiate another upward move or are there further decreases in store? Keep reading below in order to find out:
For our previous analysis, click here.
If you are interested in trading Bitcoin Cash (BCH) on our partner exchange, follow this link to get set up on XCOEX.
BCH Price: Trends and Highlights for July 4
- BCH/BTC is trading inside a symmetrical triangle.
- It has made a double bottom, combined with bullish divergence.
- Long term moving averages are bullish.
- Short term moving averages are bearish.
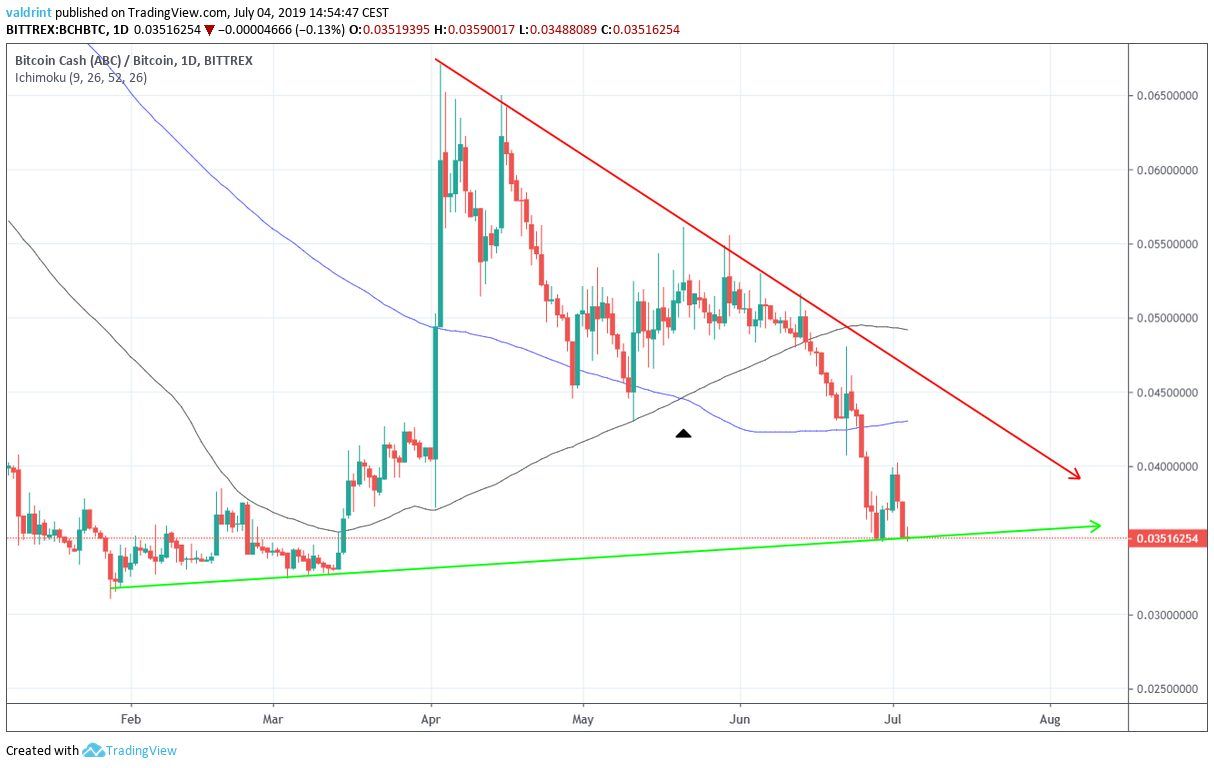
Bitcoin Cash Price in a Symmetrical Triangle
Since making a low near ₿0.032 at the beginning of February, the price of BCH has been trading inside the symmetrical triangle outlined below:
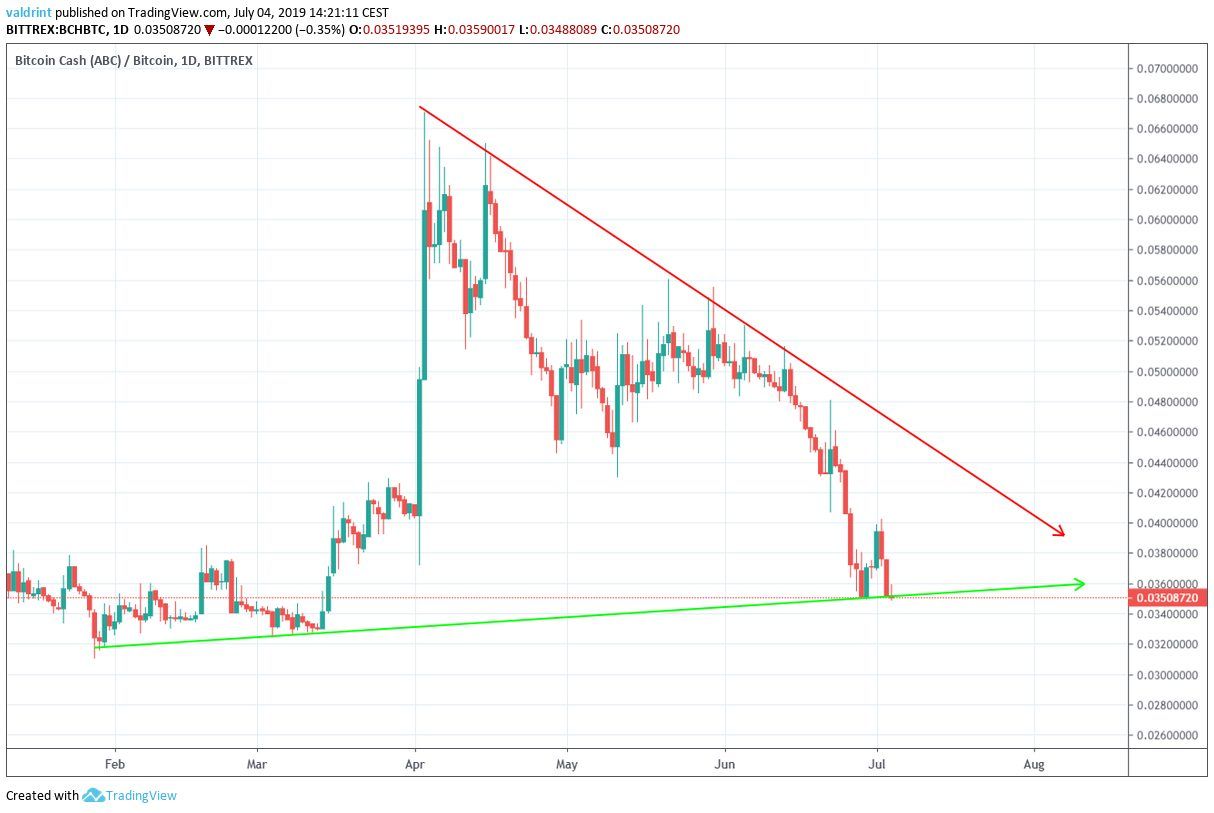
At the time of writing, the Bitcoin Cash price was trading right on the support line of the triangle.
While the support line is ascending slowly, the resistance is rapidly decreasing.
A closer look at the price shows that it has made a double bottom on June 29 and July 4.
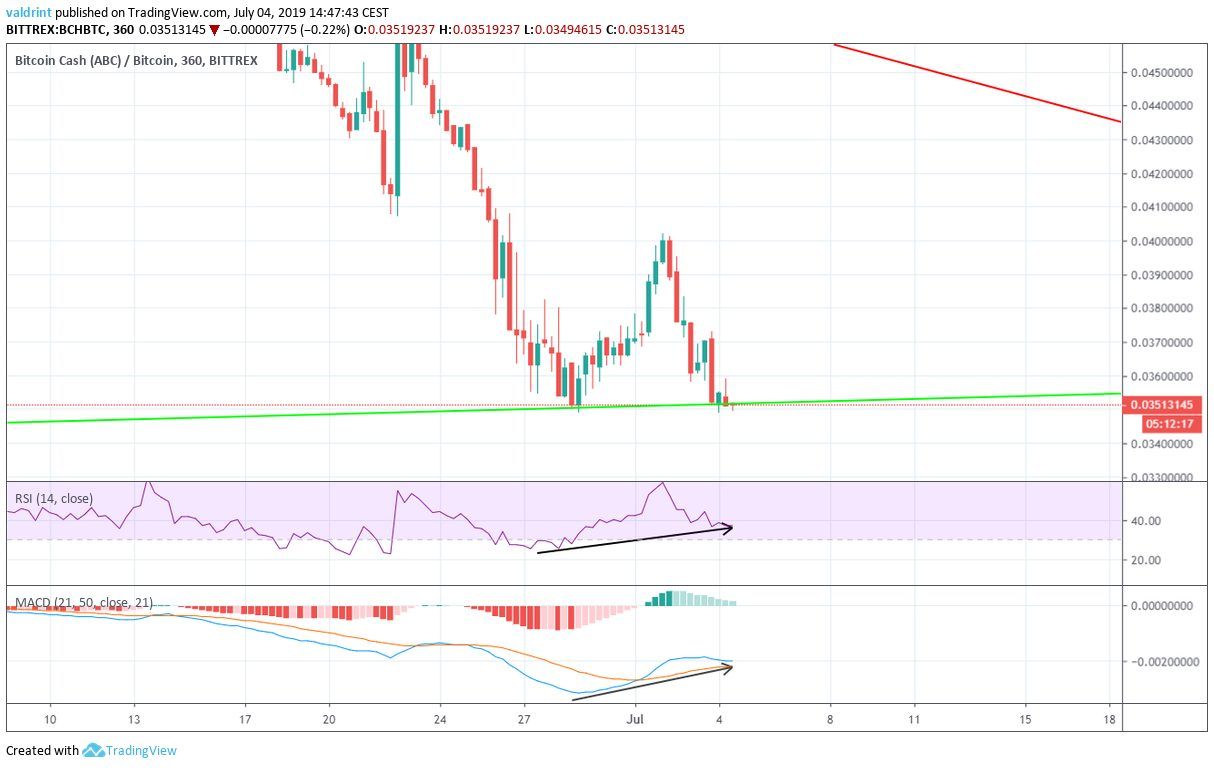
Furthermore, this pattern has been combined with a bullish divergence in both the RSI and the MACD.
The divergence is significant and is present in both indicators.
This makes us believe that the BCH price will soon begin an upward move.
Moving Averages
A bearish cross between the 10- and 20-day MAs occurred on June 5.
Since then, both the price and the MAs have been sharply decreasing.
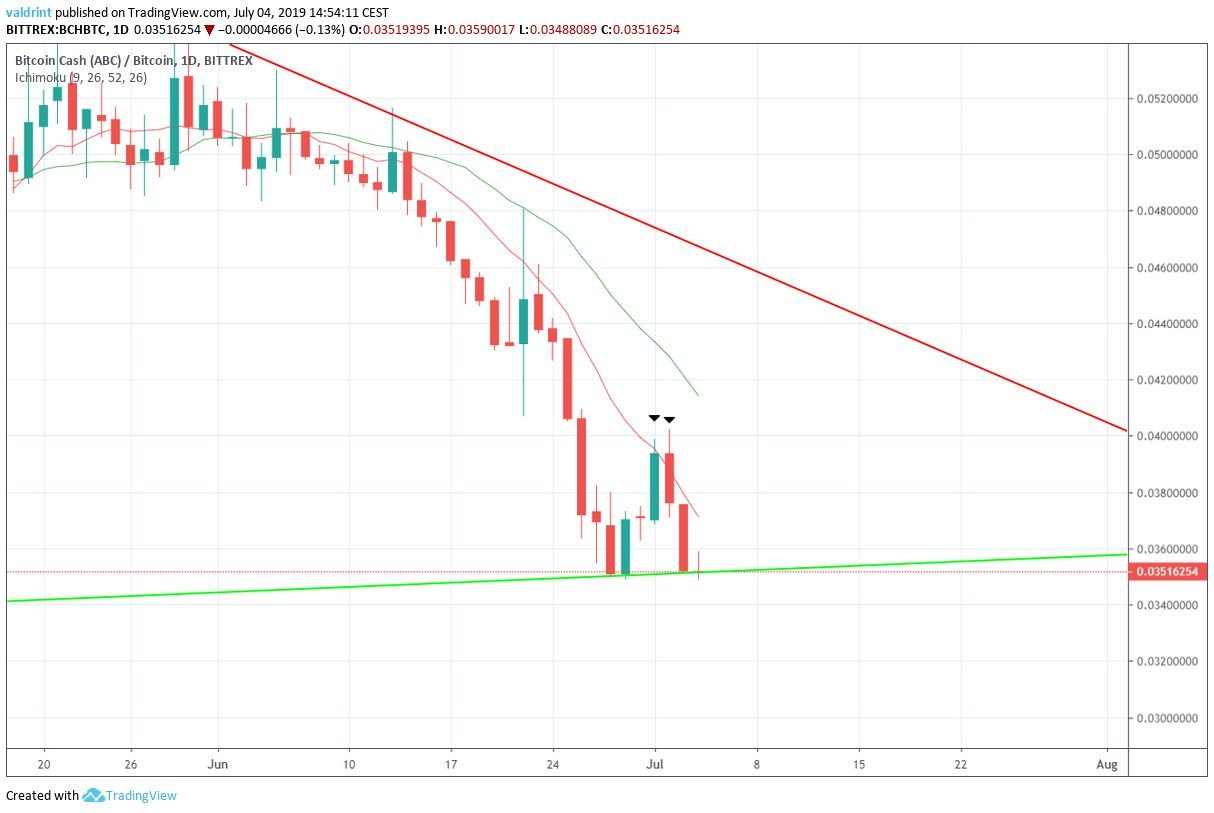
BCH/BTC has made several unsuccessful attempts at a breakout, most recently on June 30 and July 1.
At the time of writing, the BCH price was trading below both MAs and facing very close resistance from the 10-day one.
To the contrary, the 100- and 200-day MAs give a bullish outlook.
A bullish cross occurred on May 18.
Afterward, the price decreased below both MAs. However, a bearish cross is yet to occur, and the MAs are quite far from each other.
An analysis of the MAs shows that the price is in a long-term uptrend and a short-term downtrend.
However, since the RSI and the MACD support the initiation of an upward move, we believe that the short-term downtrend will soon be broken.
Summary
The price of BCH is trading inside a symmetrical triangle. The moving averages indicate that there is significant resistance ahead.
However, an analysis of momentum indicators supports the initiation of an upward move towards the resistance line of the triangle.
What do you think of the Bitcoin Cash price? Let us know your thoughts in the comments below!
Disclaimer: This article is not trading advice and should not be construed as such. Always consult a trained financial professional before investing in cryptocurrencies, as the market is particularly volatile.
Images are courtesy of Shutterstock, TradingView
