
The Bitcoin Cash price has been decreasing since February 14. It has currently reached a significant support area, a breakdown below which could trigger a rapid price decrease.
Bitcoin Cash (BCH) Highlights
- BCH broke down from an ascending support line.
- There is support at ₿0.0375 and ₿0.0325.
- A golden cross has transpired.
- The price is trading inside a short-term descending wedge.
- The RSI is bearish.
Technical analyst @LomahCrypto outlined a BCH price chart that shows that the price has fallen right into a significant support area. If the price does not bounce here, he states that the will close the majority of his position, with the aim of entering about 20% below the current price.
03 – Bitcoin Cash -15%
> Coming very close to my stop here
> If this doesn't bounce, I'll close this position out
> Next area of interest would be either a reclaim or somewhere 20% below pic.twitter.com/ZnrDzHVhTZ
— Loma (@LomahCrypto) February 20, 2020
Will BCH bounce or will it decrease towards the next support area instead? Keep reading below if you are interested in finding out.
Ascending Support Line
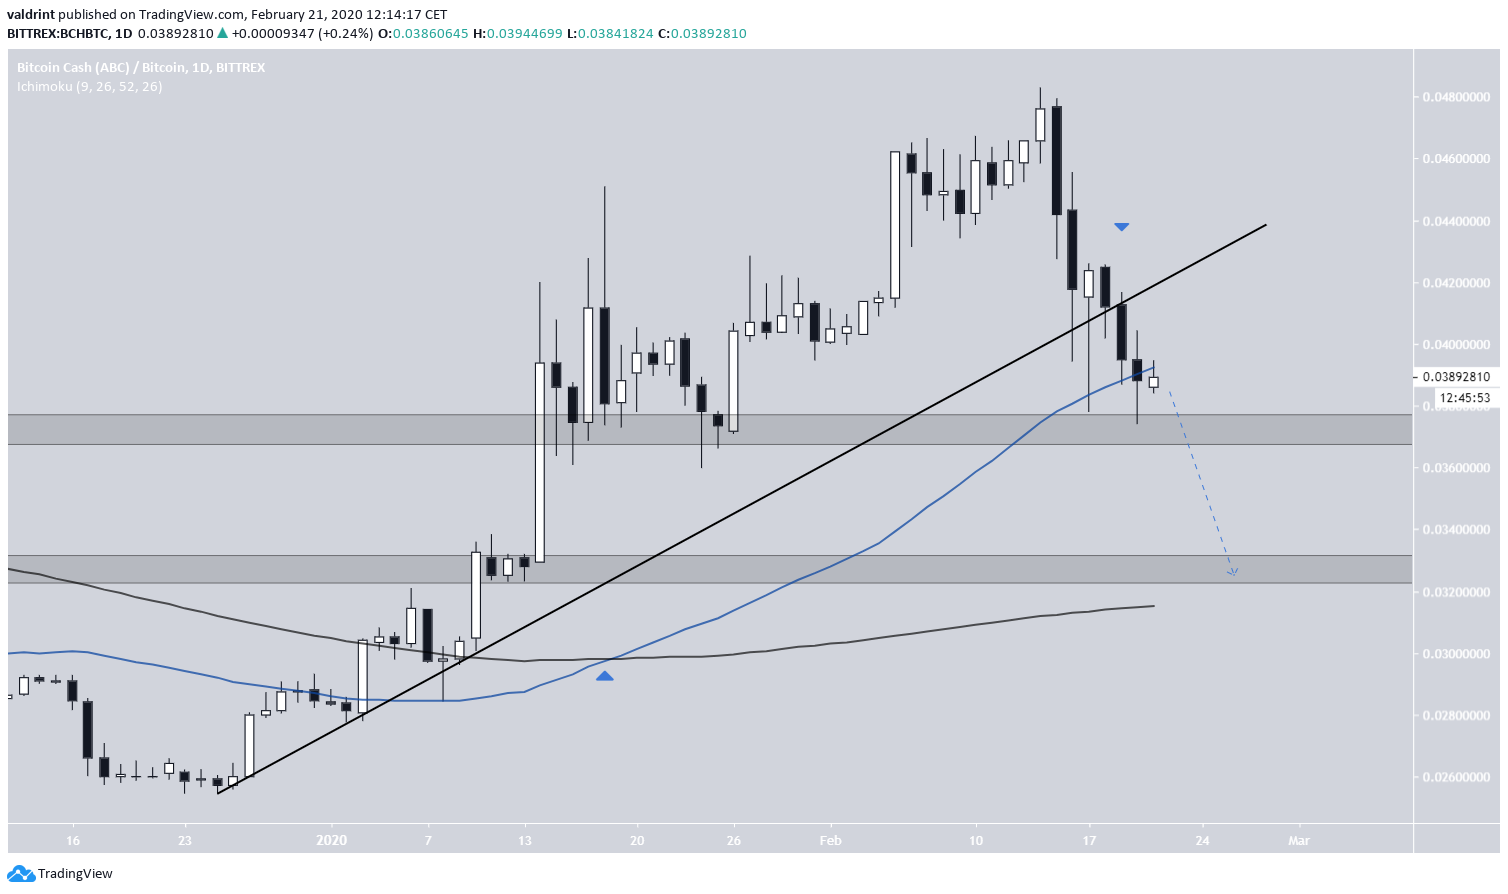
The BCH price had been following an ascending support line since December 25, 2019. On February 19, the price broke down from this ascending support line.
While a bullish cross between the 50- and 200-day moving averages (MA) has transpired previously, the price has just decreased below the 50-day MA, therefore losing its support.
There are two visible support areas, being at ₿0.0375 and ₿0.0325, respectively. The price is currently trading inside the former. A breakdown below it, as outlined in the tweet, would likely take the price to ₿0.0325, where it would find support above the 200-day MA.
Let’s take a closer look at the short-term movement and see if BCH will bounce at the current support area.
Descending Wedge
In the short-term, the BCH price is trading inside a descending wedge, currently being right at its resistance line and possibly getting ready to break out.
If so, it could increase all the way to ₿0.0245, the 0.5 Fib level of the entire price decrease and the 200-hour MA.

Bitcoin Cash Future Movement
As for the future movement, the BCH price is expected to decrease after the bounce.
An RSI movement above 50 often indicates that the price is in an upward trend. The RSI went above 50 the same time the ascending support line began and decreased below 50 at the time of the breakdown. Therefore, even though the price is likely to bounce in the short-term, it should eventually decrease, since the RSI is suggesting that the price action is bearish.
The bounce would serve to validate the ascending support line as resistance and cause the RSI to do the same with the 50-line.
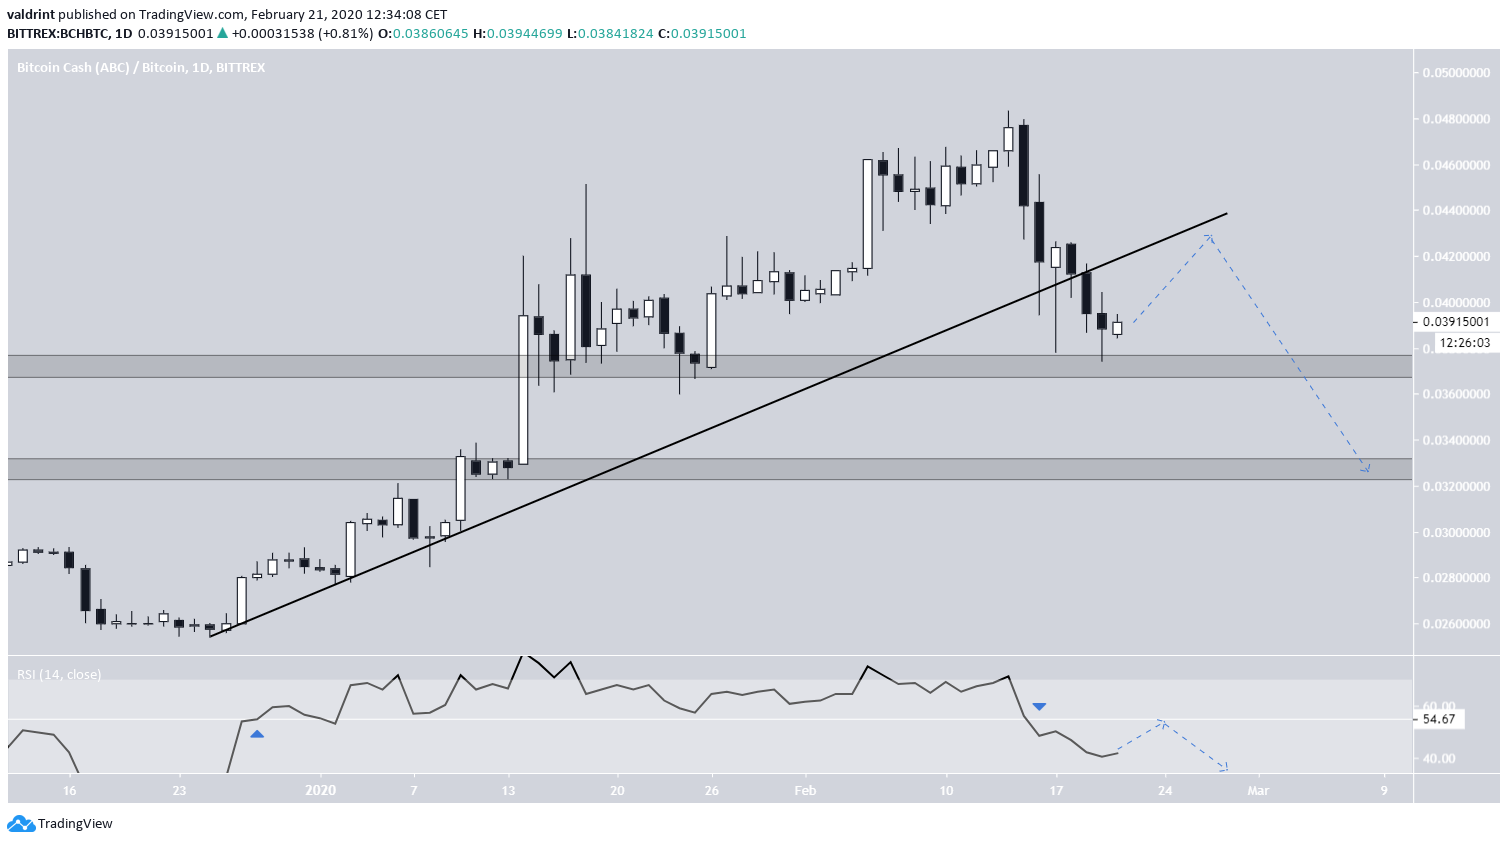
To conclude, the BCH price is trading inside a short-term descending wedge, out of which we believe it will break out. However, the medium-term outlook is bearish and the price is expected to eventually reach ₿0.0325.
