![Bitcoin Cash Falls to Penultimate Support Area: Will It Go Lower? [Premium Analysis]](/_mfes/post/_next/image/?url=https%3A%2F%2Fassets.beincrypto.com%2Fimg%2FsZ6bYKzjgduGGt_01fS1oknqP1Y%3D%2Fsmart%2F7a51e644dfb74cef9095ef9e44c02eb7&w=1920&q=75)
The Bitcoin Cash price is expected to begin a short-term upward move towards the outlined resistance area. However, the direction of the longer-term trend remains unclear.
The Bitcoin Cash price has been on a downward since June 26. On September 25, it found support above $200. However, on December 16, the price broke down below this support area and, at the time of writing, it is trading at $185.
Trader @LSDinmycoffee stated that the BCH price could see a relief rally at this level, but will ultimately enter “price discovery” — meaning it will create new all-time lows until it finds its true price.
Might see some relief here, but I can't wait to see this trash enter price discovery. pic.twitter.com/j9CSn2x41b
— krillin ॐ (@LSDinmycoffee) December 18, 2019
Let’s take a closer look at the Bitcoin Cash price movement and see if this really is the case.
Bitcoin Cash Trading Range
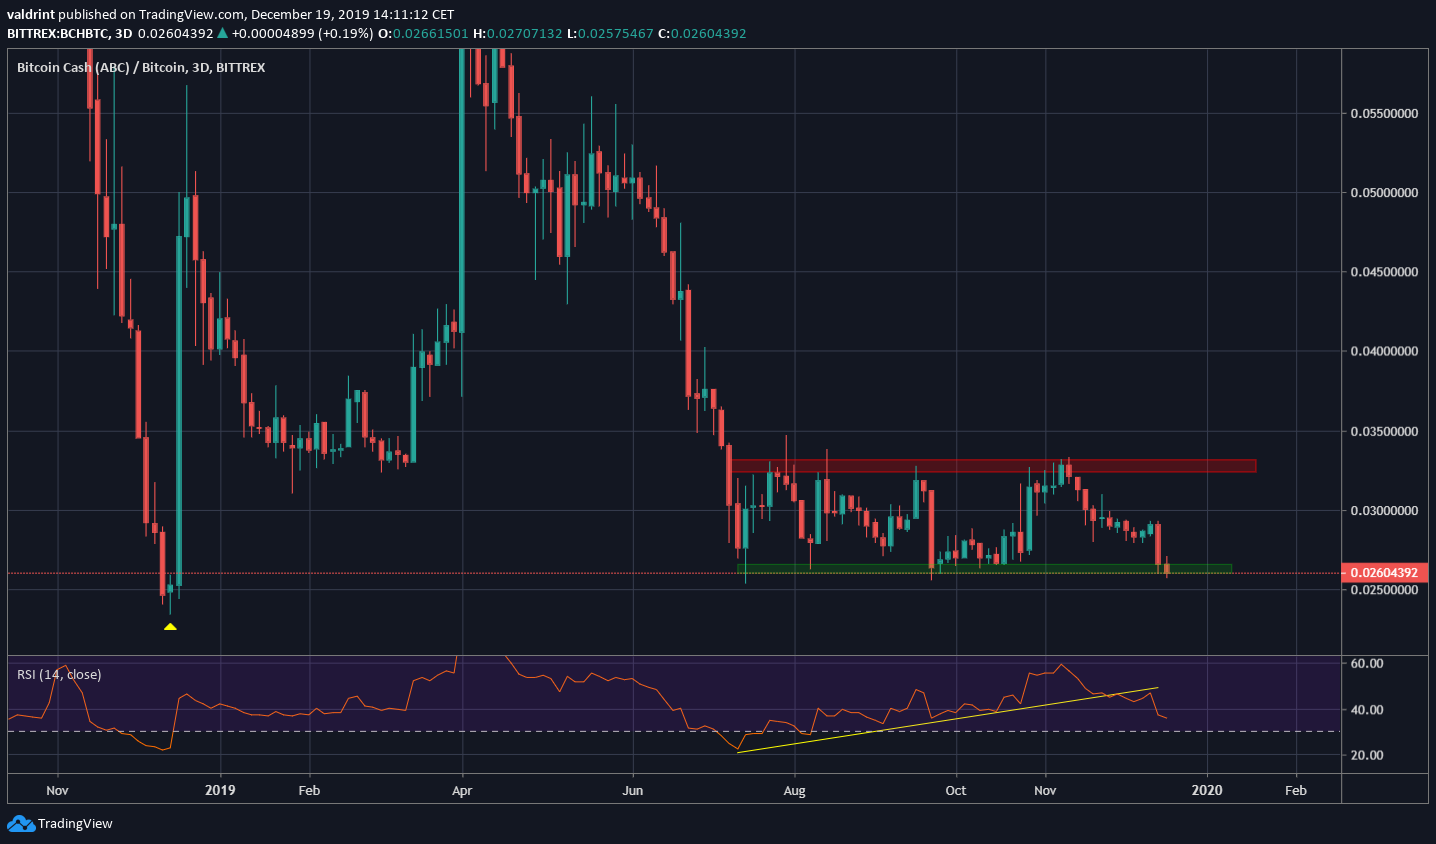
The BCH price has been trading in a range between ₿0.026 and ₿0.033 since July. Both the resistance and support areas have been validated thrice.
Currently, the price is trading inside the support area. This is very close to the all-time low of ₿0.024, reached on December 2018.
While the RSI has been generating bullish divergence since the beginning of the trading range, the upward sloping trend-line was recently broken and validated afterwards. This somewhat reduces the significance of the divergence.
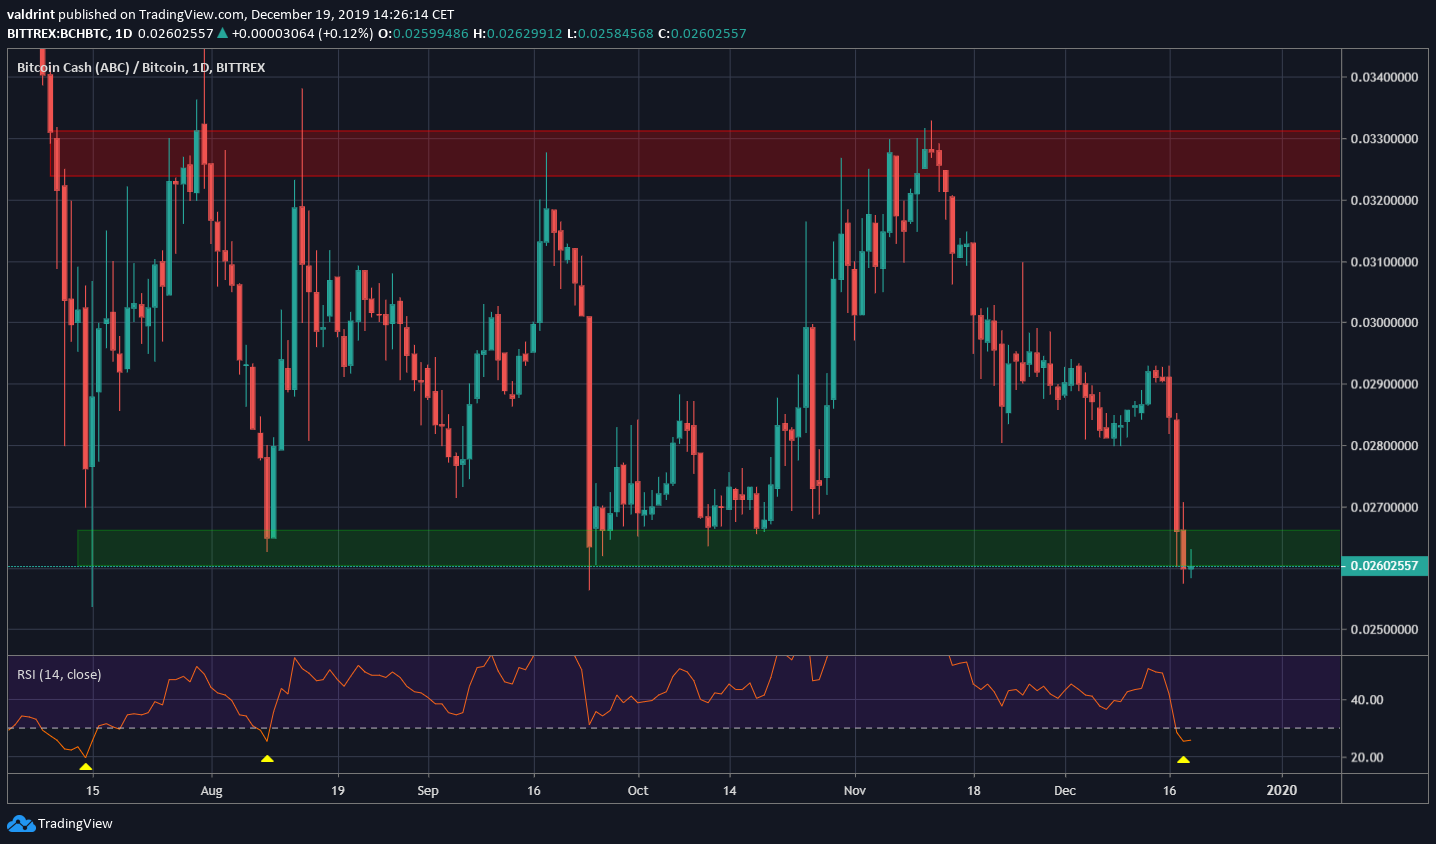
The daily outlook and RSI suggest that the Bitcoin Cash price might continue moving upward.
The daily RSI has fallen below 25. The only two other times this occurred, a movement towards the resistance line transpired. However, there is not divergence to confirm that this move will occur.
Future Movement
Since there is a lack of a short-term pattern besides the trading range, both a breakdown and a breakout remain possible.
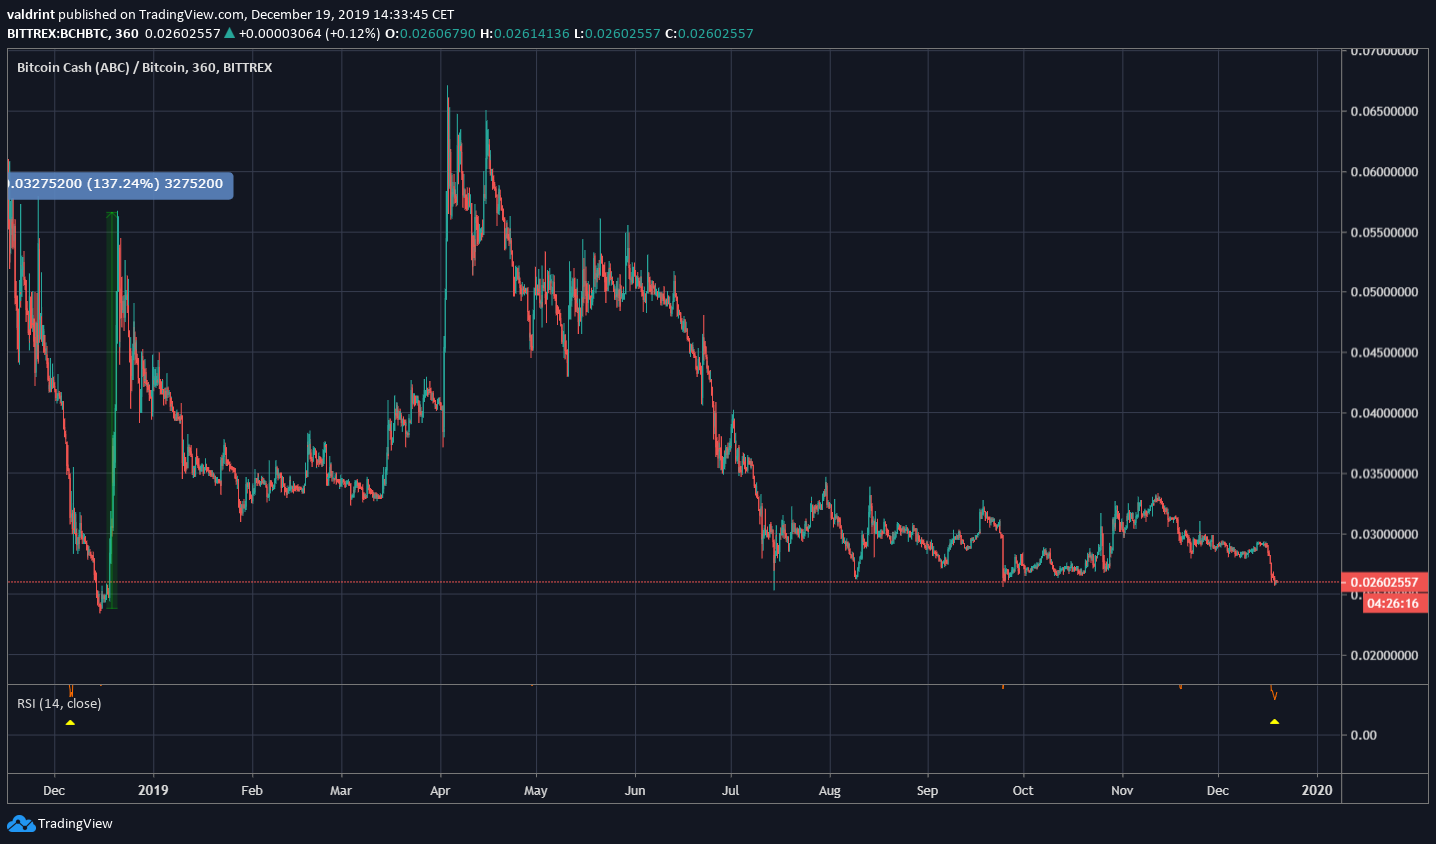
However, it is worth noting that the lower time-frame RSI is at its lowest levels ever — currently being at 12. The previous time it was near these levels, an upward move of nearly 140 percent transpired.
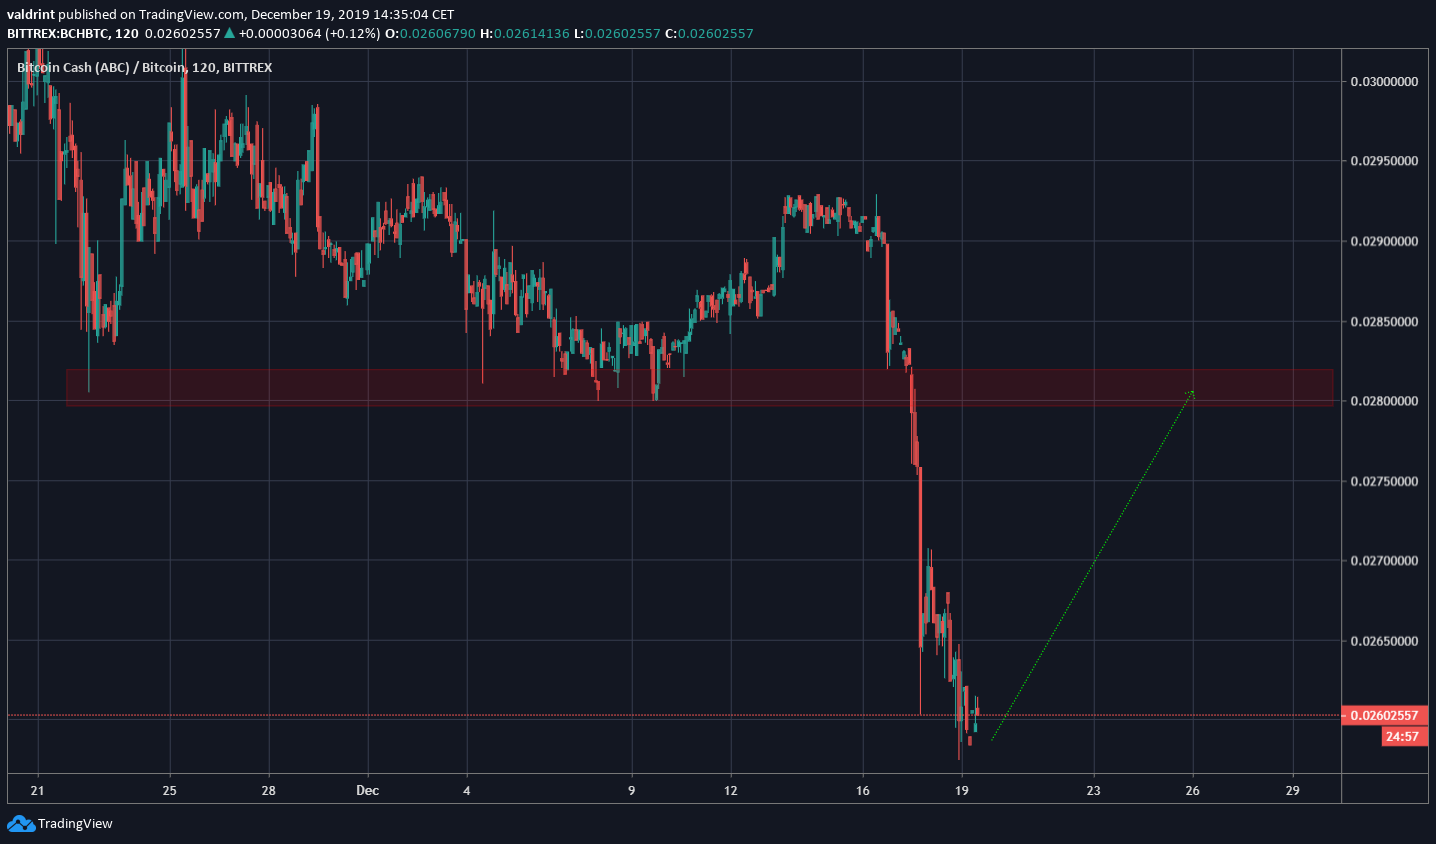
Therefore, we believe a short-term relief rally is very likely. The BCH price should eventually reach the closest resistance area at ₿0.028.
However, due to the lack of a trading pattern, it remains unclear if the price will break out above this area or not. Currently, we are slightly leaning towards this being a validation of the area as resistance followed by another price decrease.
To conclude, the BCH price has fallen to the bottom of its five month trading range. While a short-term upward move seems likely, we cannot confidently predict the direction of the longer-term trend.
