


The Bitcoin Cash (BCH) price dropped after being rejected by an important resistance area on Oct 16 but is expected to soon resume its upward movement towards weekly resistance levels.
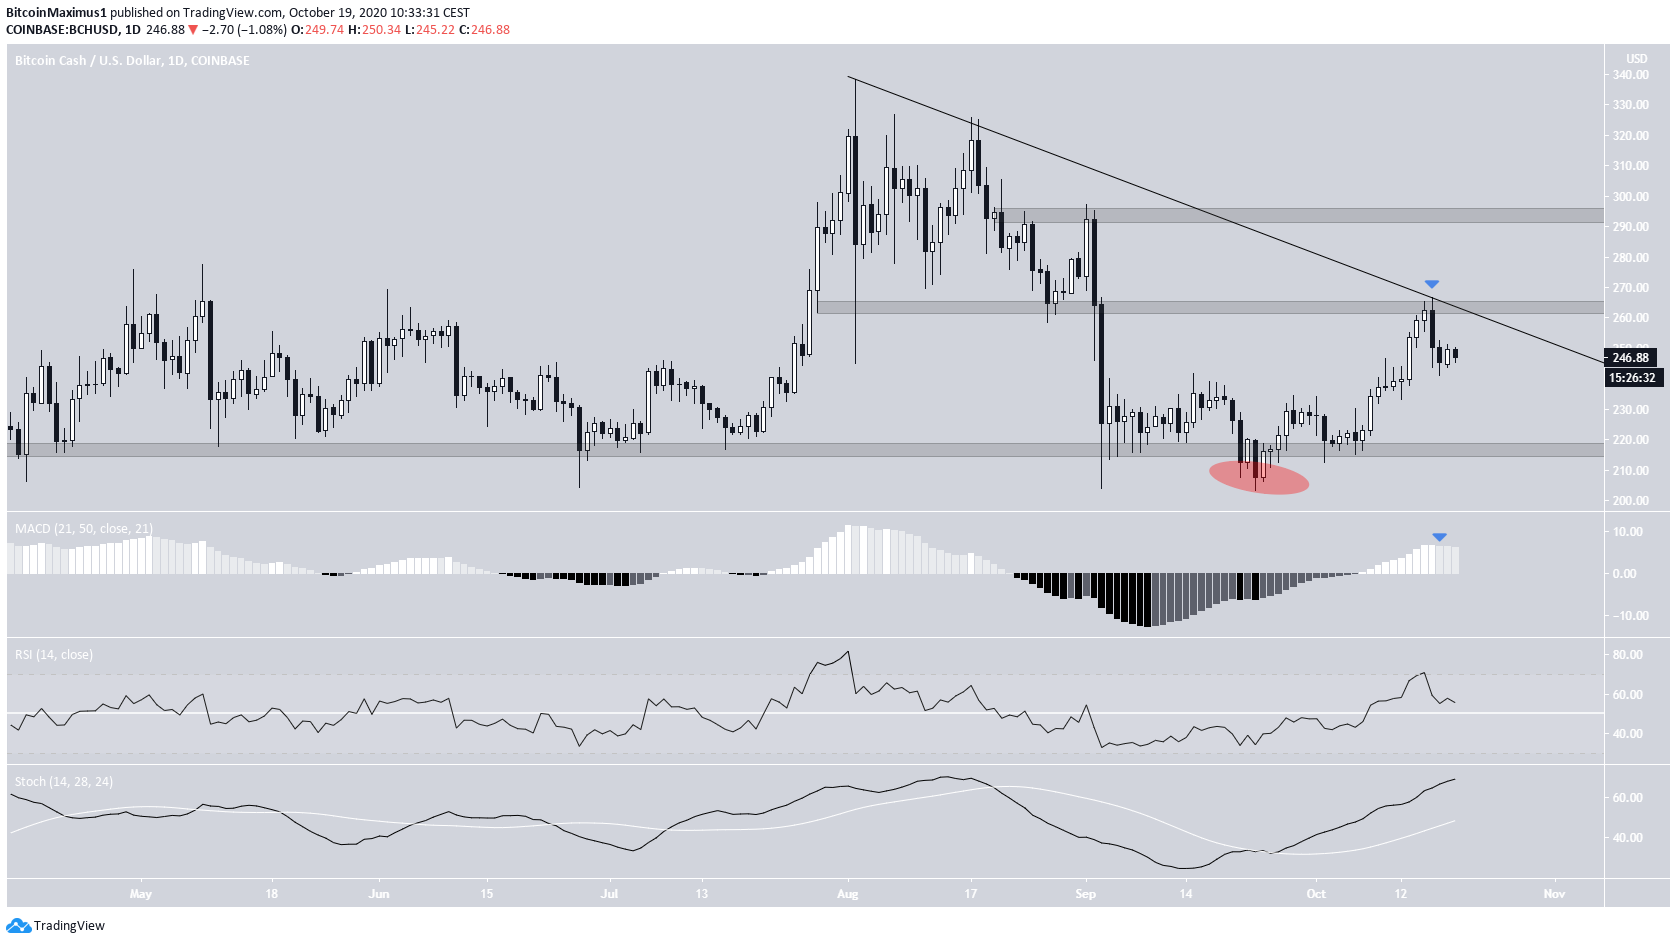
The BCH price has been decreasing since Aug 2, when it reached a local high of $338.49. Throughout the decrease, the price has been following a descending resistance line which was validated for the third time on Oct 16.
BCH Rejection from Resistance
The rejection from the line also coincided with the $263 level, which previously acted as support but has now turned to resistance.
A breakout above this resistance line would likely take BCH to $293, while a continued decrease could take the price back to the $216 range lows. BCH deviated slightly below the latter (red circle below) before beginning the current upward movement.
Technical indicators in the daily time-frame are still bullish, even though the MACD has begun to fall. The underlying trend has been bullish since the deviation, so BCH is expected to eventually break out after a possible short-term dip back to support levels.
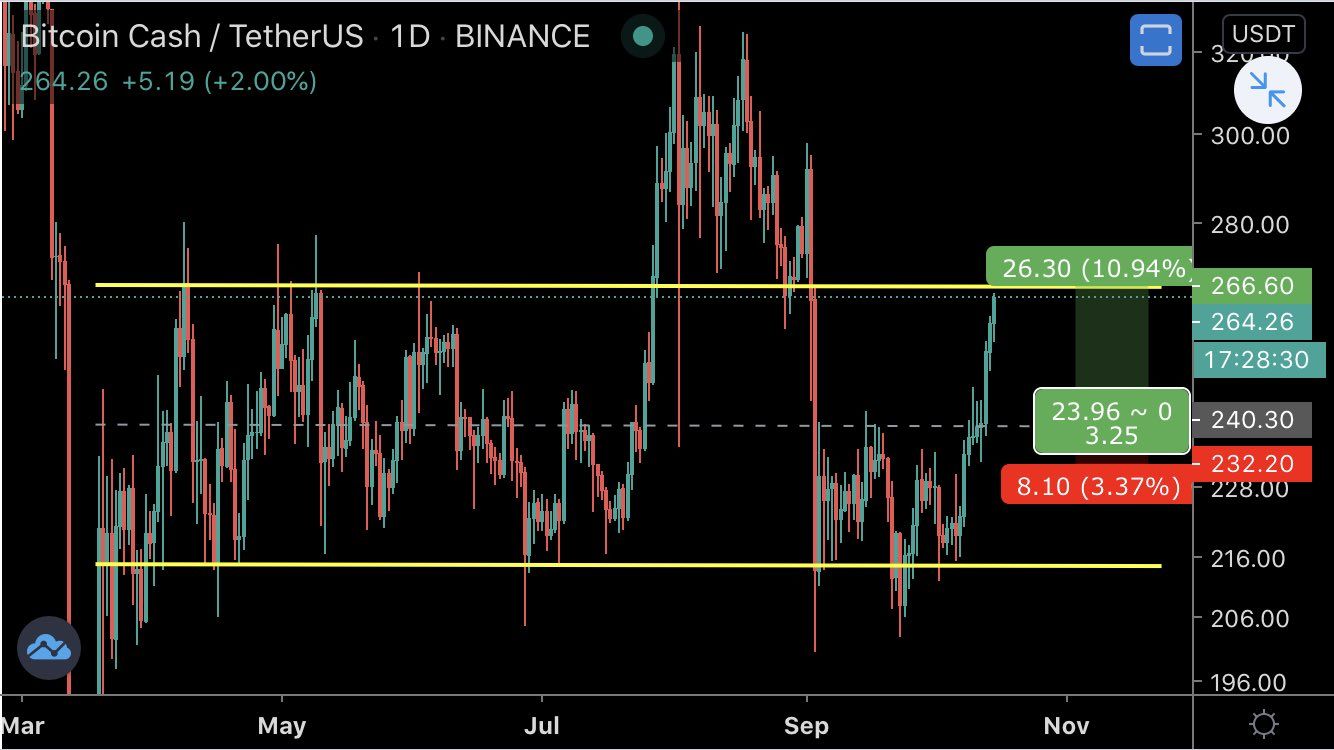
Cryptocurrency trader @Mesawine1 outlined a BCH chart that shows resistance at $265. Since the tweet, the price has been rejected by the area and decreased to the middle of the range.
Breakout Attempts
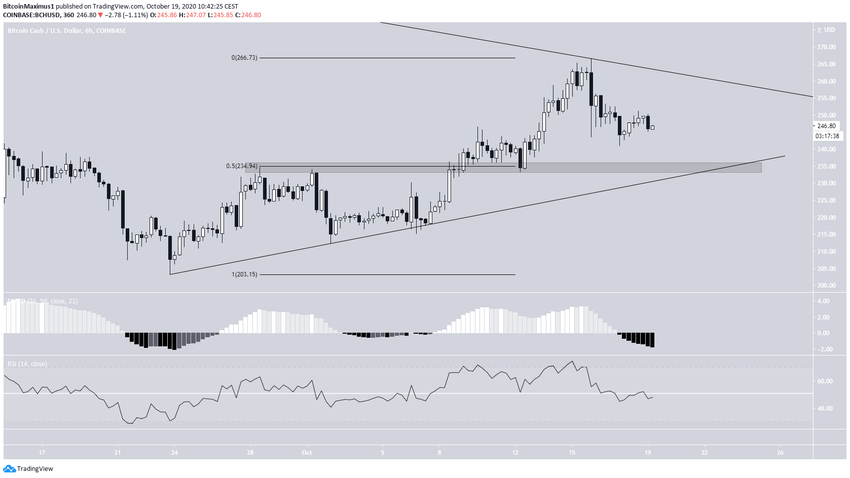
The 6-hour chart shows that the price is approaching a crucial support area, which is expected to sustain the rally if BCH wants to go higher.
The support area is found at $234, which is the 0.5 Fib retracement level of the entire upward move and also coincides with an ascending support line that has been in place since the move began.
However, technical indicators do not yet predict a bullish reversal.
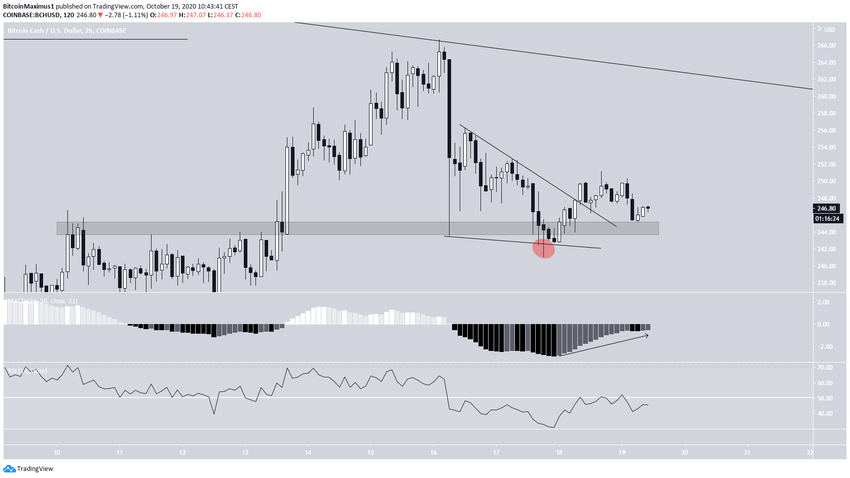
The 2-hour chart already shows a breakout from what looks like a descending wedge, after the price deviated below the range low — a bullish development.
Furthermore, the MACD is increasing and has almost crossed into positive territory.
Therefore, the lower time-frames might have already initiated an upward move that will gradually be visible in higher time-frames.
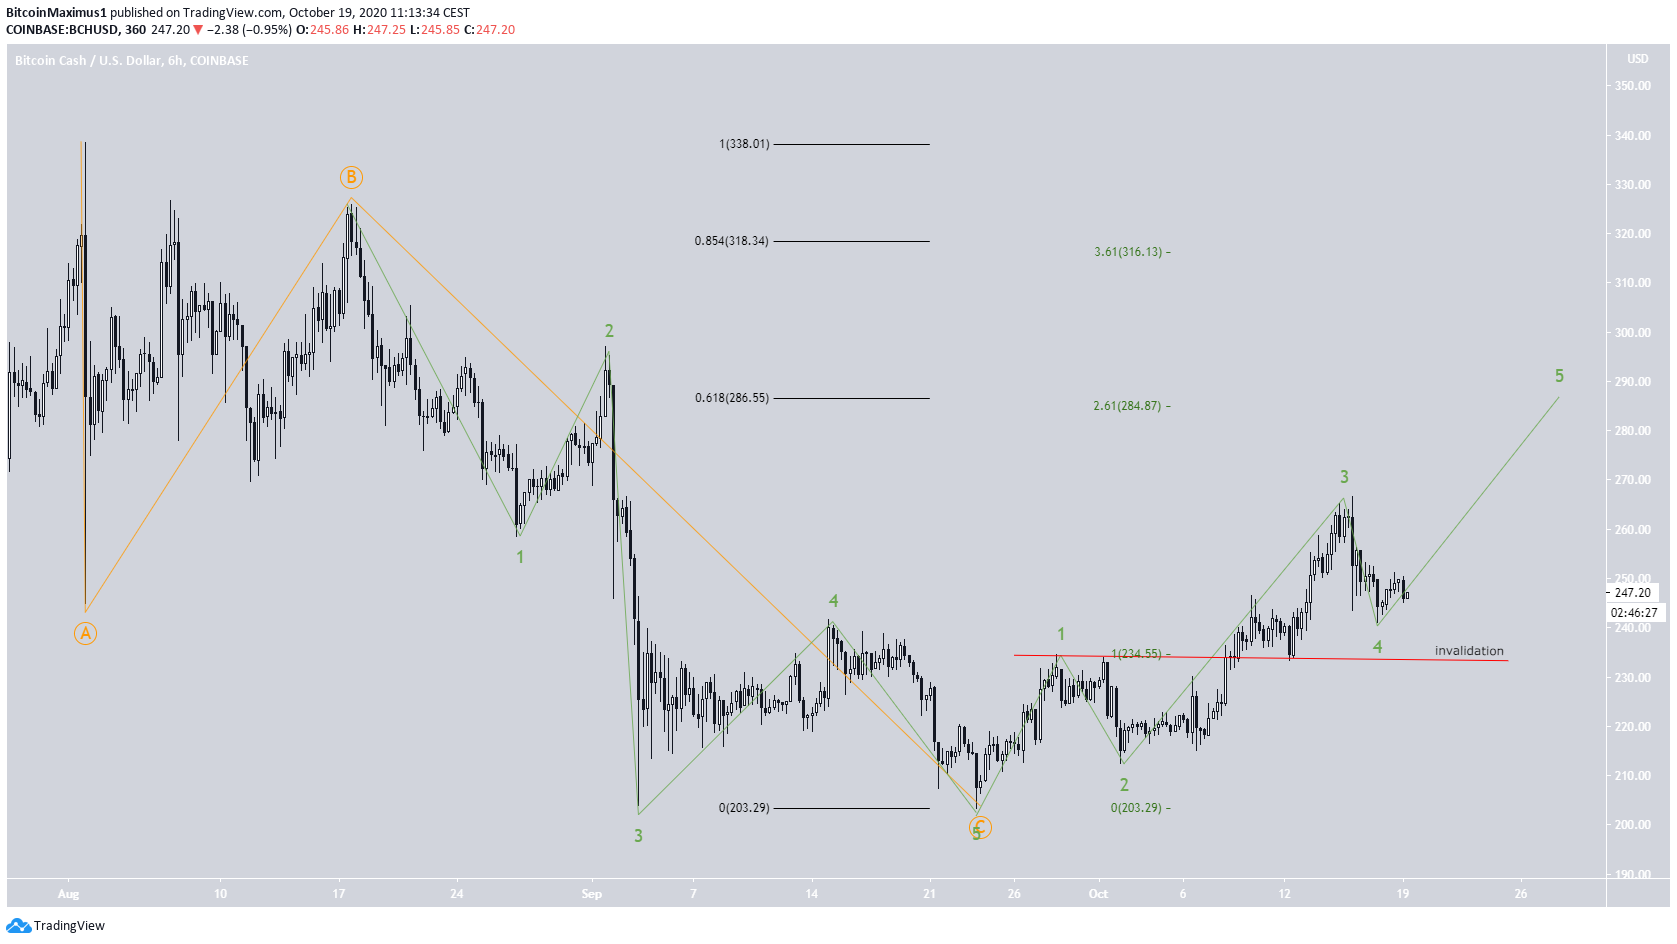
Wave Count
Since the aforementioned Aug 2 high, the BCH price has likely completed an A-B-C correction (shown in orange below) with a low on Sept 23.
BCH looks to have begun an impulse move (green) and is currently in wave 4. While it is not yet clear whether this is the beginning of an upward move or a larger degree A wave, the current wave 5 is expected to end at either $285 or $316, the two areas with the most Fib confluence.
A decrease below the sub-wave 1 high at $233 would invalidate this particular wave count.
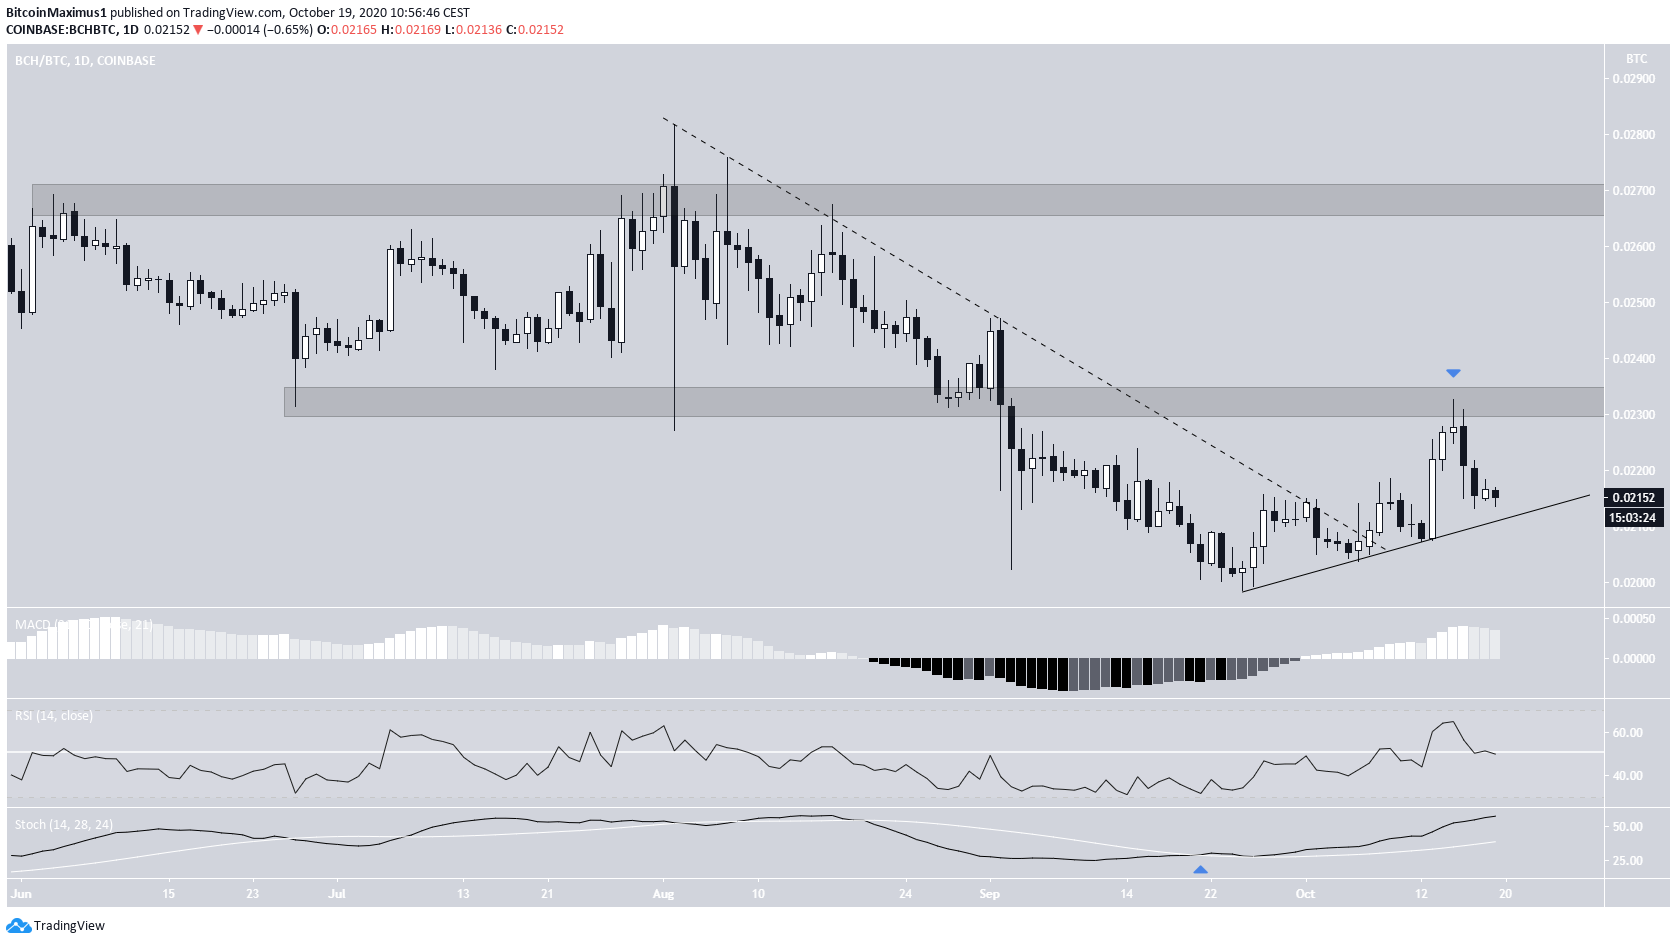
BCH/BTC
The BCH/BTC chart has some similarities to its BCH/USD counterpart, but the price has already broken out from a descending resistance line and is following an ascending support line.
Recently, the price was rejected at the ₿0.0233 resistance area. If the price were to break out, the next resistance area would likely be found at ₿0.027.
Technical indicators are bullish, and despite the fact that the MACD has begun to decrease, it has not generated a bearish reversal signal. Therefore, the price is expected to make another attempt at breaking out above ₿0.0233
For BeinCrypto’s latest Bitcoin analysis, click here.
Disclaimer: Cryptocurrency trading carries a high level of risk and may not be suitable for all investors. The views expressed in this article do not reflect those of BeInCrypto.


