


On May 12, 2019, Bitcoin (BTC) reached highs near $7500, but what about Litecoin (LTC) and Bitcoin Cash (BCH)?
To answer these questions, we examine the current long-term and short-term trading patterns of Bitcoin (BTC), Bitcoin Cash (BCH) and Litecoin (LTC).
After comparing their technical indicators to generate possible trade setups, our major findings are summarized. In conclusion, the winner of this analysis is selected based on future price potential.
You can read our previous analysis of BTC, BCH, and LTC here.
Ascending Support
On Apr 3, the price of BTC/USD reached a high of $5335.5 and a low of $4842. Resistance and support lines are traced from this date to generate the ascending channel outlined in the graph below:
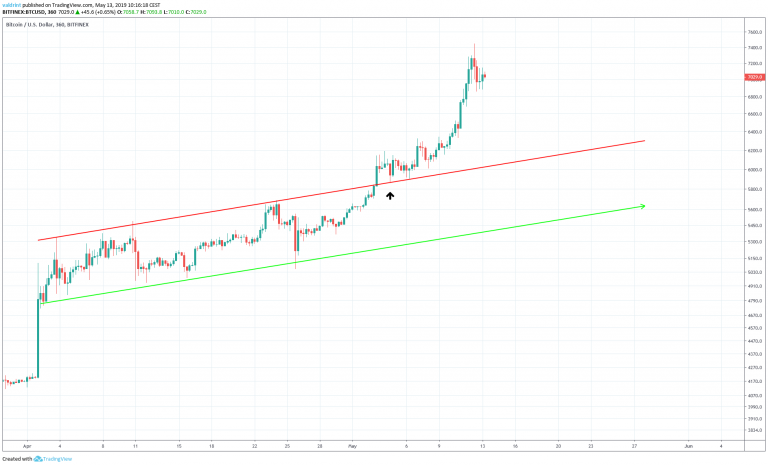
The price broke out from the channel on May 5th. It retraced to validate the resistance line on May 6 but continued rising to reach a high of $7448.0 on May 12.
BTC has yet to return to the channel. A new trading pattern above the traced resistance line may now be forming.
Similarly, the price of LTC/USD has been following an ascending support line since making lows of $43.3 on Feb 24.
However, there is no clear resistance line or an apparent trading pattern:
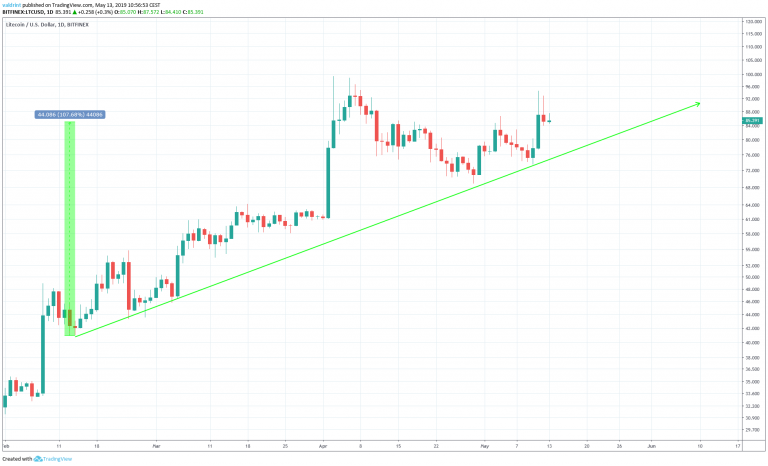
Price spiked in early April but fell throughout the rest of the month. It validated the support line twice at the beginning of May. While following this support line, the price has increased by 108%.
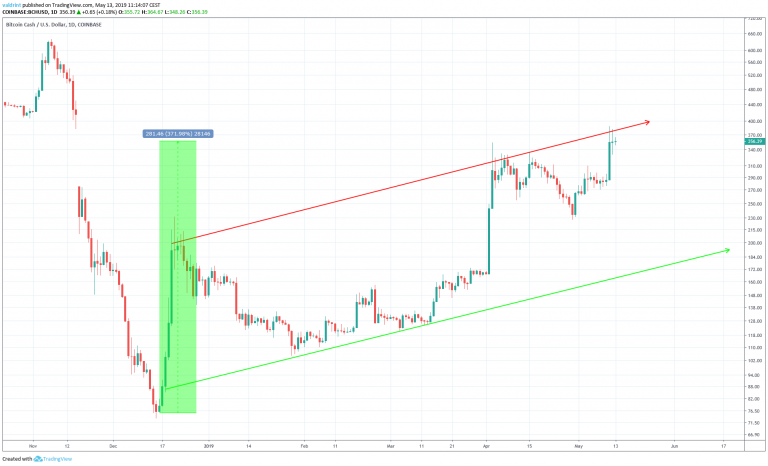
Similar to BTC and LTC, the price of BCH/USD has been following an ascending support line since Dec 18, 2018, when a low of $85.2 was reached.
Subsequently, the price surged to reach a high of $232.1 on Dec 21, 2018.
Since then, Bitcoin Cash has been trading along an ascending channel. While trading inside the channel, the price has increased by a massive 371%.
However, these patterns alone are not sufficient to predict future price movement.
In order to do that, we need to take a look at each of these coins within a shorter time-frame alongside relevant technical indicators.
Bitcoin’s Current Pattern
On May 11, the price reached a high of $6889.9 and generated a resistance line. After a breakout, the price dropped to validate the same line as support on May 12. Since then, the price has been trading inside a horizontal channel with resistance at $7140.
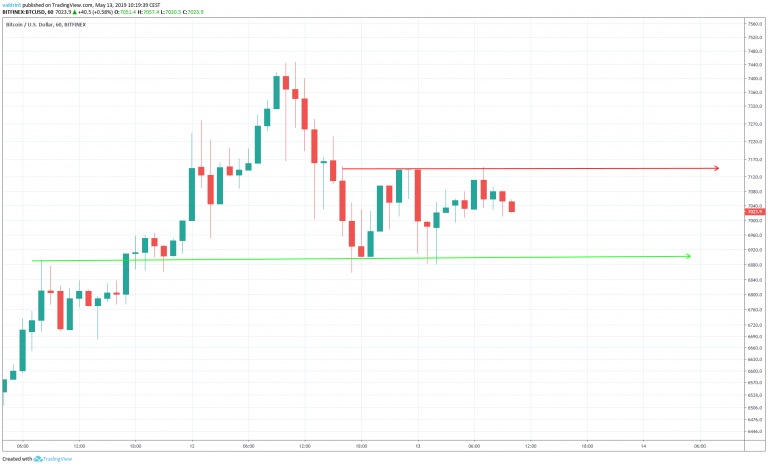
Currently, the price is trading in the middle of the channel. In the short term, the indicators do not give us a clear indication of where the price might be headed.
In order to figure that out, the price of BTC is analyzed at one-day intervals from Sep 2018 to May 2019 alongside the RSI:
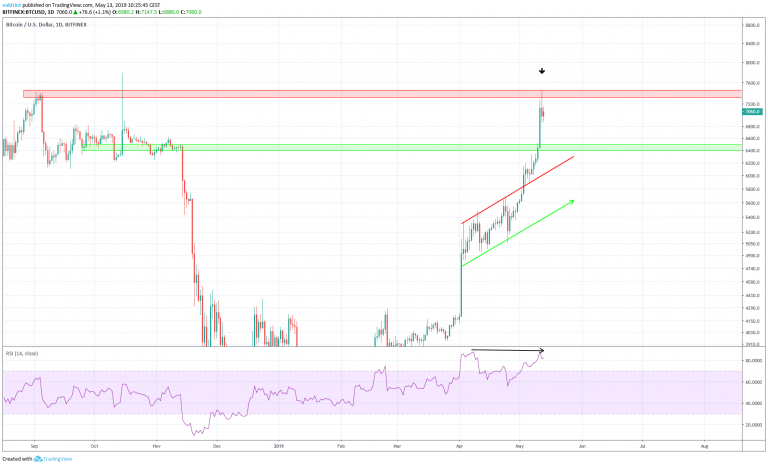
On Apr 10, the price reached a high of $5488. It continued to increase and on May 11 it reached a high of $7448.
Similarly, the RSI made the first high on Apr 10. However, it has continued to generate lower values since. This is known as bearish divergence and often precedes price decreases.
Furthermore, the daily candle is shaping up to be a shooting star, which is a bearish reversal sign. This potential reversal sign has occurred inside the resistance area near $7400.
The use of these indicators confirms the possibility of price losses leading to the support area at around $6450. However, we cannot rule out the possibility that the price initiates an impulsive upward move first.
At the current time, we do not see any profitable trade setups for BTC. Our previous short trade setup was unsuccessful and the stop loss of only 2.5% was triggered.
Now, let’s take a look at LTC/USD:
Litecoin Breakout
The price of Litecoin reached lows of around $77.2 on May 3. A gradual increase ensued and the price reached highs of $86.6 the next day. It has been decreasing since, trading inside a descending wedge.
The price broke out from the wedge on May 10:
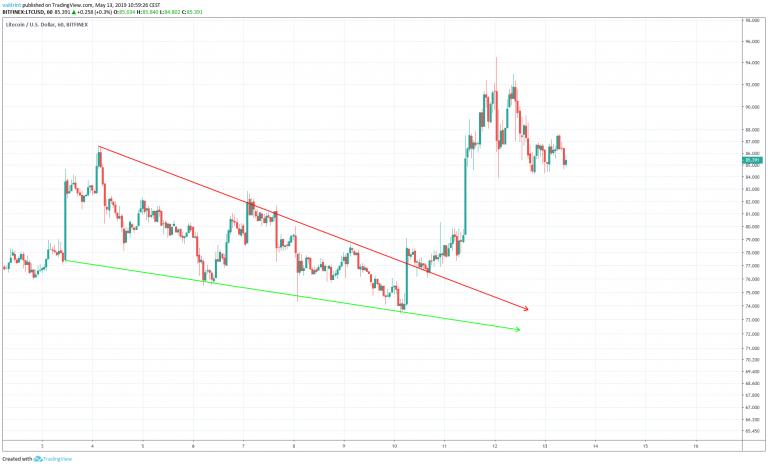
After the breakout, the price reached highs of $94.5 on May 12. It has been decreasing since.
In order to figure out the future movement of the price, we will analyze the price of LTC at one-hour intervals alongside the MACD and the RSI in the graph below:
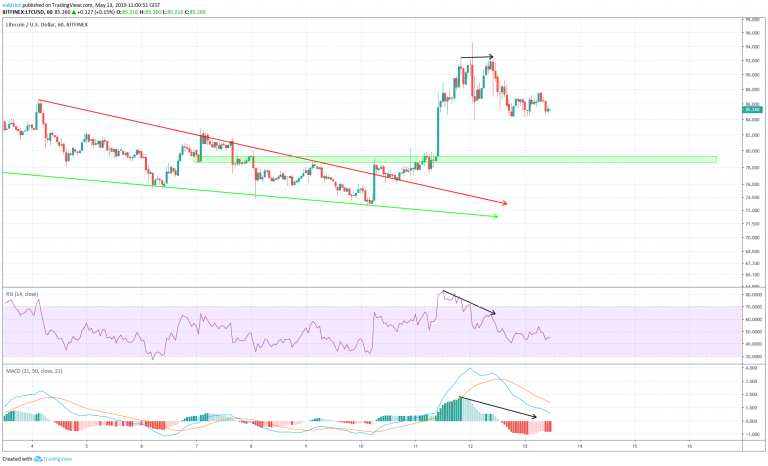
On May 11, the price reached a high of $92.3. It reached a similar high the next day.
Similarly, the RSI and the MACD reached highs on May 11. However, they have proceeded to generate lower values since.
This is known as bearish divergence and often precedes price decreases.
The use of these indicators makes it likely that the price will decrease towards the support area at $79.5.
Due to the current price position of the price and the lack of a trading pattern, we do not see any valid trading setups.
Our previous long trade setup was successful. The price not only reached our target of 8%, but kept increasing further.
Finally, let’s take a look at BCH/USD:
An Ascending Channel For Bitcoin Cash
In the case of BCH, the daily long-term pattern can be used to predict future movement. Therefore, we have outlined the daily price of BCH/USD from Dec 2018 to May 2019 alongside the RSI and the MACD below:
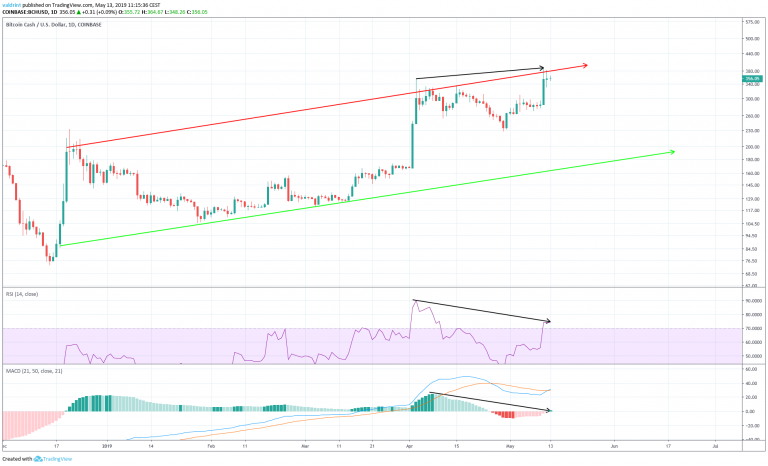
On Apr 3, the price reached a high of $354.27. It continued to increase and reached a similar high on May 11. .
Similarly, the RSI and the MACD made a high on Apr 3. However, they have continued to generate lower values since.
This is known as bearish divergence and often precedes price decreases.
The use of these indicators suggests that the price will decrease towards the support line of the channel.
Due to the fact that the price is trading very close to the resistance line of the channel, we will analyze a possible short trade setup below:
Short Trade Setup
We will examine a possible short trade setup with an average entry of $360.
The stop-loss order is placed at $401, slightly above the May 11 high. The value of $401 is also chosen since we believe that $400 can offer psychological resistance. This is a stop loss of roughly 12%.
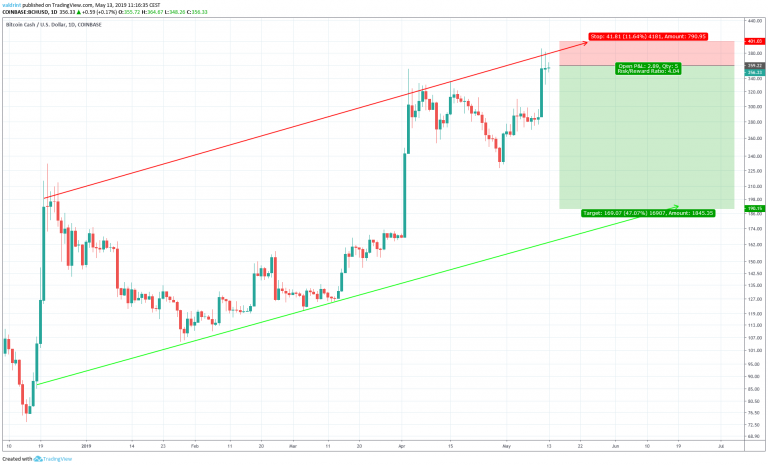
Our target would be $190, slightly above the support line of the channel.
Combined with the stop loss mentioned above, this is a risk to reward ratio of 4:1.
A breakdown is not needed to reach the target. Rather, only a decrease within the channel is required. Based on our analysis of technical indicators, this is likely.
Conclusion
To conclude, Litecoin and Bitcoin Cash are both following ascending support lines. Bitcoin recently broke out of its trading pattern and is not currently following a trading structure, though a new trading pattern may be forming.
Furthermore, both Bitcoin and Bitcoin Cash have developed bearish divergence in long timeframes while Litecoin has only done so in shorter timeframes.
To conclude, we believe that Litecoin faces the best prospects for the near future, due to the fact that it has not generated any long-term bearish divergence. However, Bitcoin Cash has the most profitable trade setup in place, with a risk to reward ratio of 4:1.
A summary is presented in the table below:
|
|
BTC |
LTC |
BCH |
WINNER |
|
Long-term Pattern |
Ascending Channel Breakout |
Ascending support line, no visible resistance | Ascending Channel |
Tie |
|
Short-Term Patterns & Indicators |
Long-term bearish divergence developing |
Bearish divergence only in the short-term. | Long-term bearish divergence developing |
LTC |
| Trade Setup | None | None | Short trade with 4:1 risk to reward ratio | BCH |
Do you think the price of Litecoin will be able to reach the support area? Will BTC begin to decrease? Where will the price of BCH go? Let us know in the comments below.
Disclaimer: This article is not trading advice and should not be construed as such. Always consult a trained financial professional before investing in cryptocurrencies, as the market is particularly volatile.


