
During the week of April 20-27, the Bitcoin (BTC) price increased considerably — going from a low of $6751 to a high of $7738. This was the sixth bullish weekly candlestick in a row.
This is the largest number of successive bullish weekly candlesticks since April and May 2019, when the Bitcoin price created seven successive bullish candlesticks before following them up with a bearish engulfing one.
Weekly Bitcoin Outlook
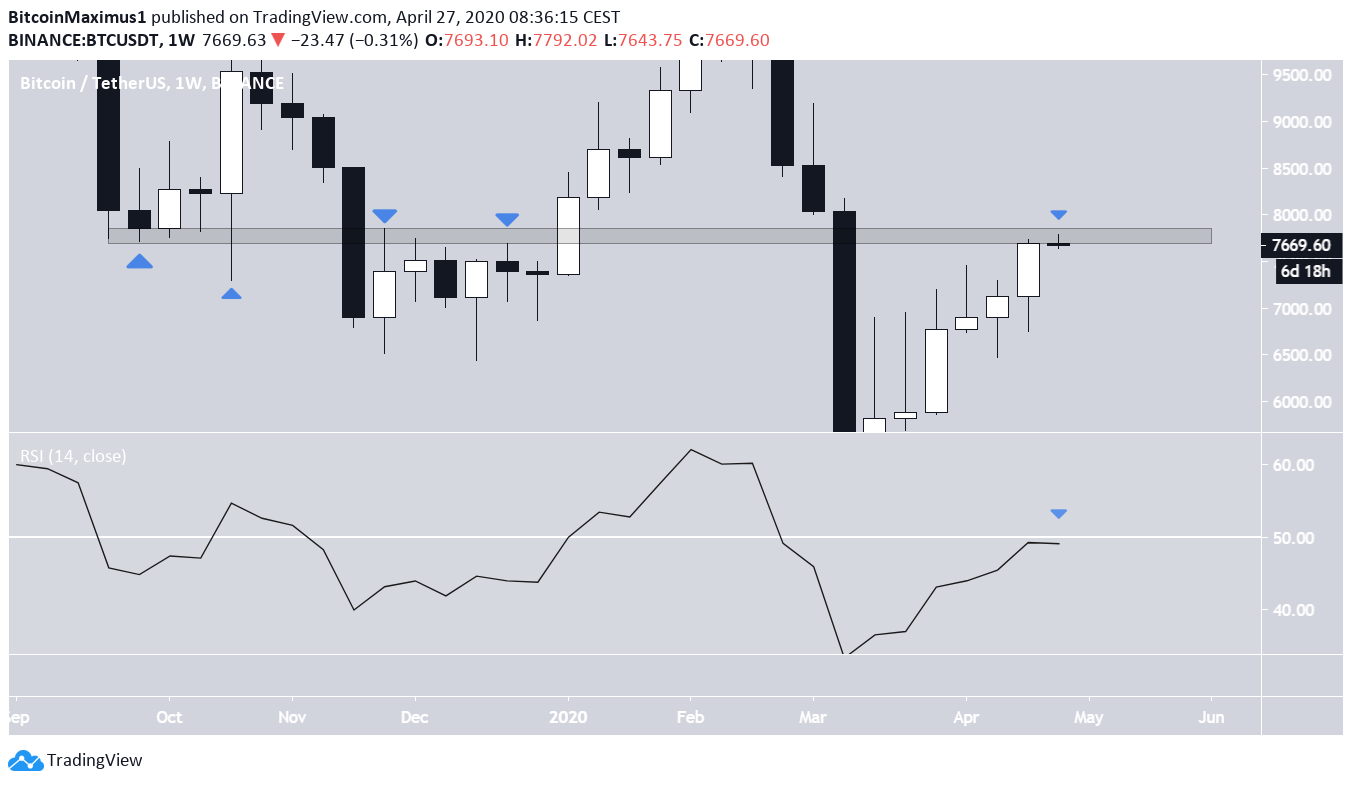
The Bitcoin price is trading inside a strong resistance zone in the weekly chart, found at $7800. This area initially acted as support in October 2019 before turning to resistance the following month.
Afterward, the price broke down below it in March 2020. Now, it is in the process of reaching the area from below — in which case the area is expected to act as resistance.
Furthermore, the weekly Relative Strength Index has reached the 50-line from underneath. The line could potentially act as resistance and reject the RSI — causing it to drop sharply along with the price.
Wave Count
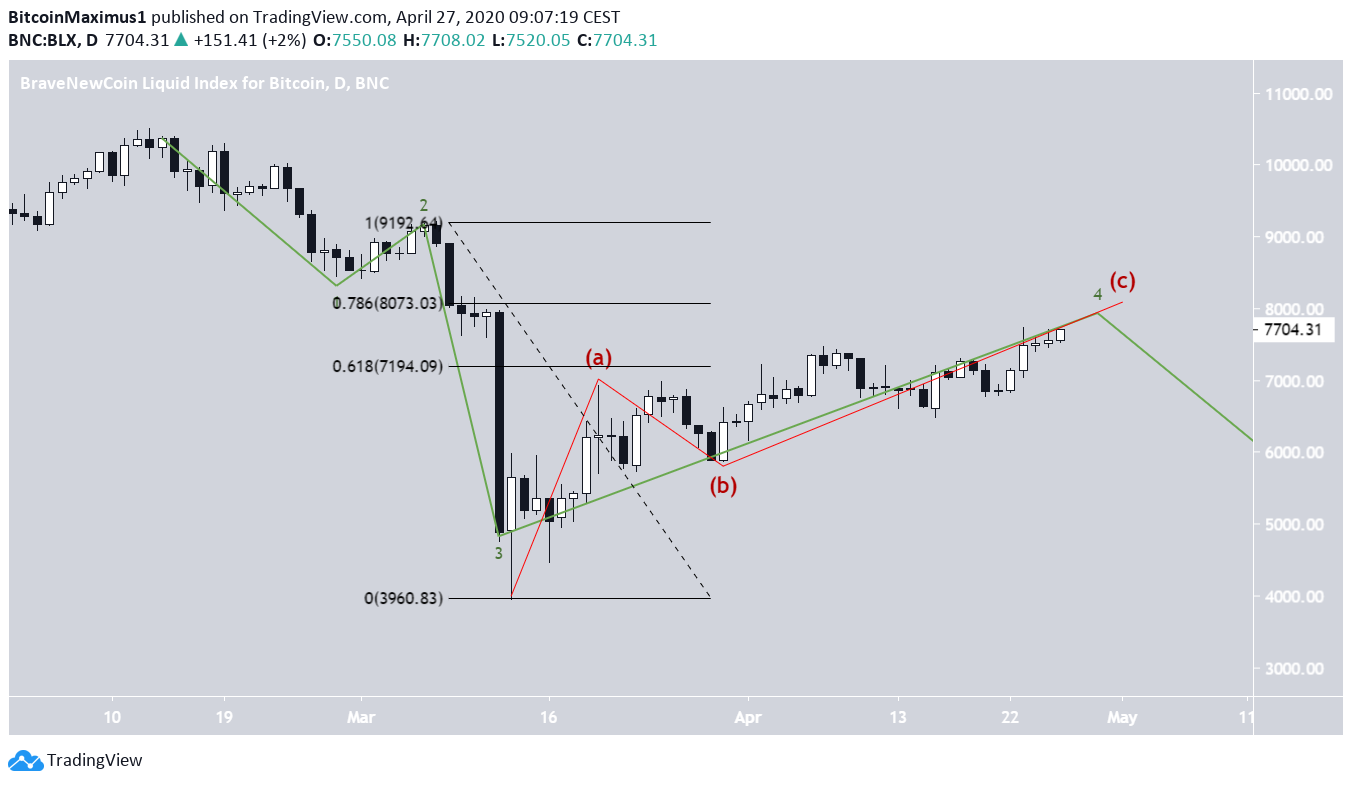
The Bitcoin price has been decreasing since February 13 but the rate of decrease accelerated on March 7 — causing the price to reach a bottom. The rapid decrease was likely the third wave of a five-wave Elliott formation. If so, it seems that the price is currently in the fourth wave, after which the fifth and final downward wave would ensue.
The current wave (4) is transpiring inside of an A-B-C formation. The likeliest level for it to end would be near $8000, which is the 0.786 Fib level of the second wave. On the other hand, an increase above $8500, which was the bottom of the first wave, would invalidate the wave count.
Short-Term Movement
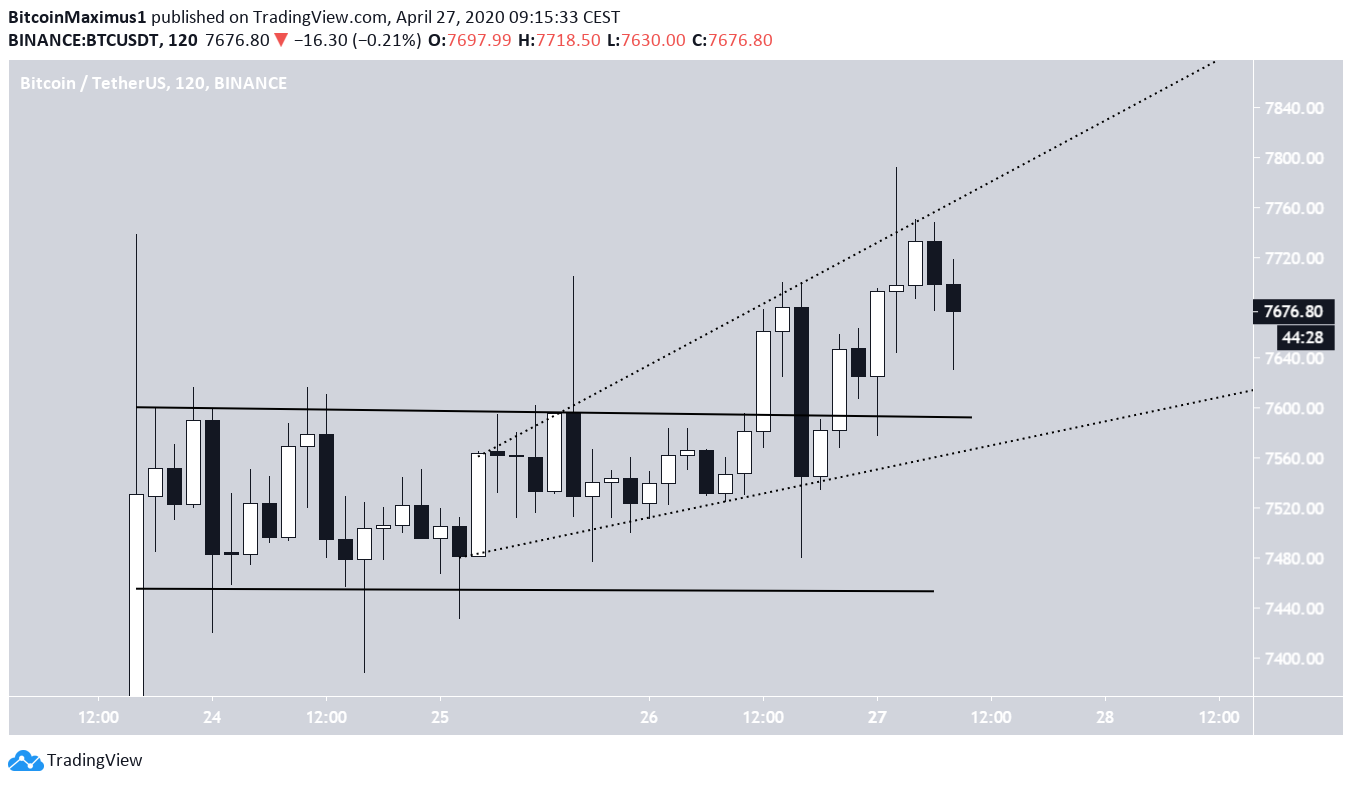
In the short-term, the Bitcoin price had been trading in a range between $7450-$7600 but broke out above it on April 26. The price has been gradually increasing since. It is possible that it is trading inside of a short-term ascending and broadening wedge.
To conclude, the Bitcoin price is trading inside of a strong resistance level in the weekly time-frame. The price is possibly nearing the top of the fourth of a five-wave Elliott formation, which is transpiring inside an A-B-C upward correction. The wave is likely to end between $8000-$8100.
For those interested in BeInCrypto’s previous Bitcoin analysis, click here.
