


Despite moving outside the confines of a short-term resistance level, Bitcoin (BTC) has yet to validate the breakout with a significant upward move.
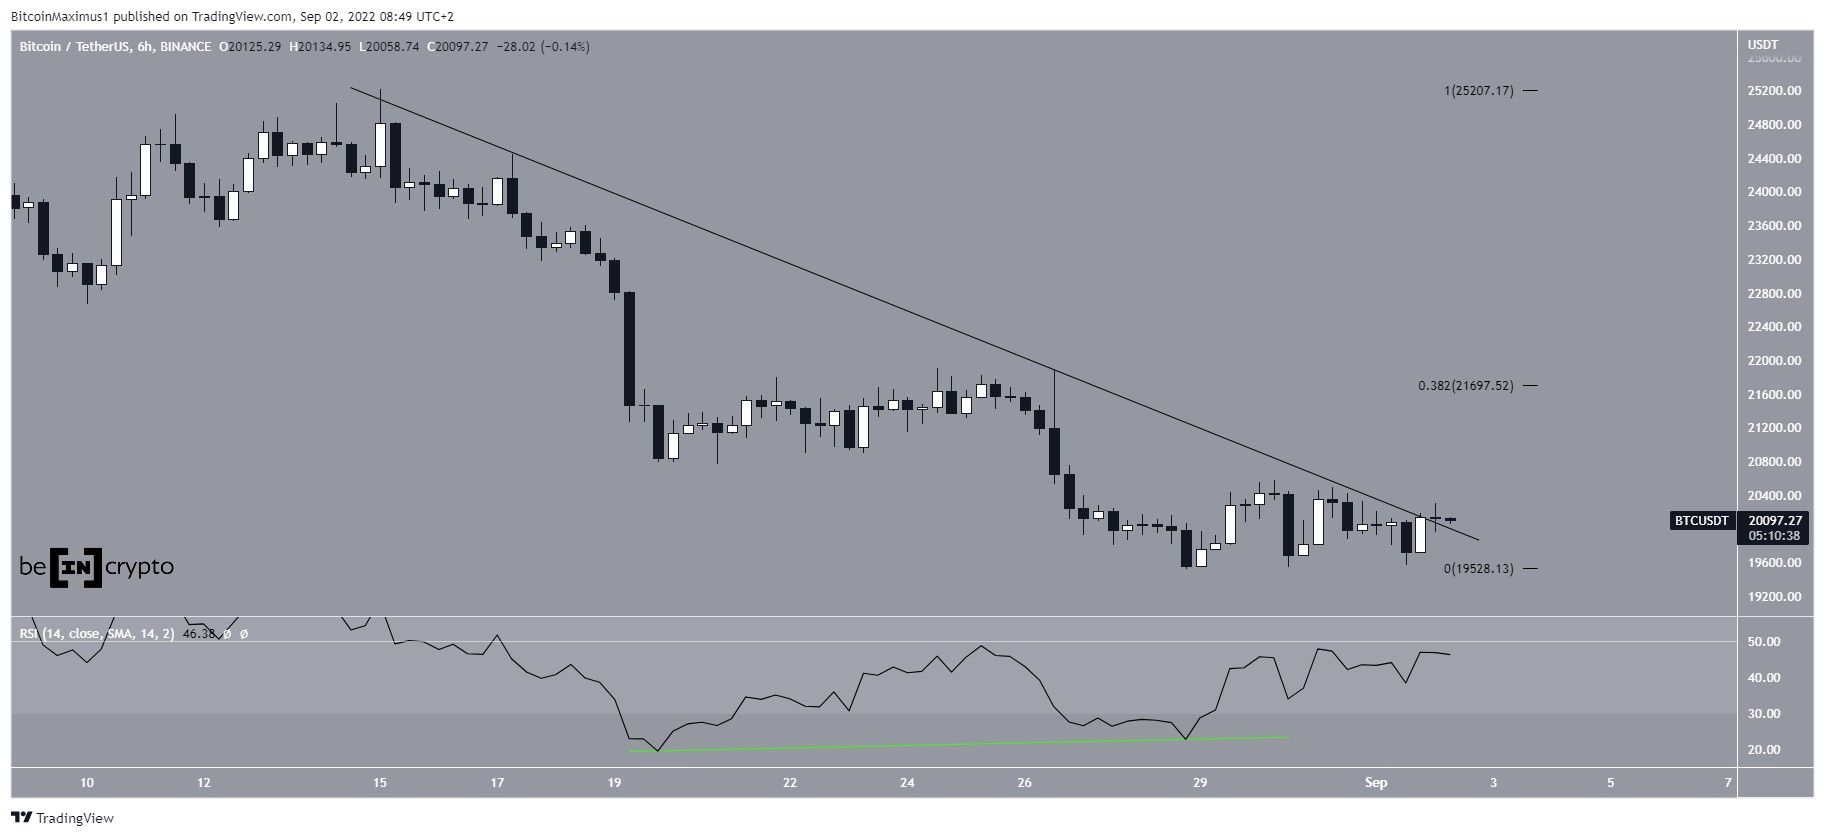
Bitcoin had been decreasing beneath a descending resistance line since Aug. 15. The line caused several rejections, with the most recent being on Aug. 26, which led to a local low of $19,520 on Aug. 28.
During the two most recent lows, the six-hour RSI generated a significant amount of bullish divergence. The divergence was the catalyst for a small upward move that allowed BTC to break out above the line on Sept. 2. However, despite the breakout, Bitcoin has not yet initiated any kind of significant upward move and the RSI is still below 50.
If an upward movement follows, the closest resistance area would be found at $21,700. This target is the 0.382 Fib retracement resistance level.
Triple bottom pattern
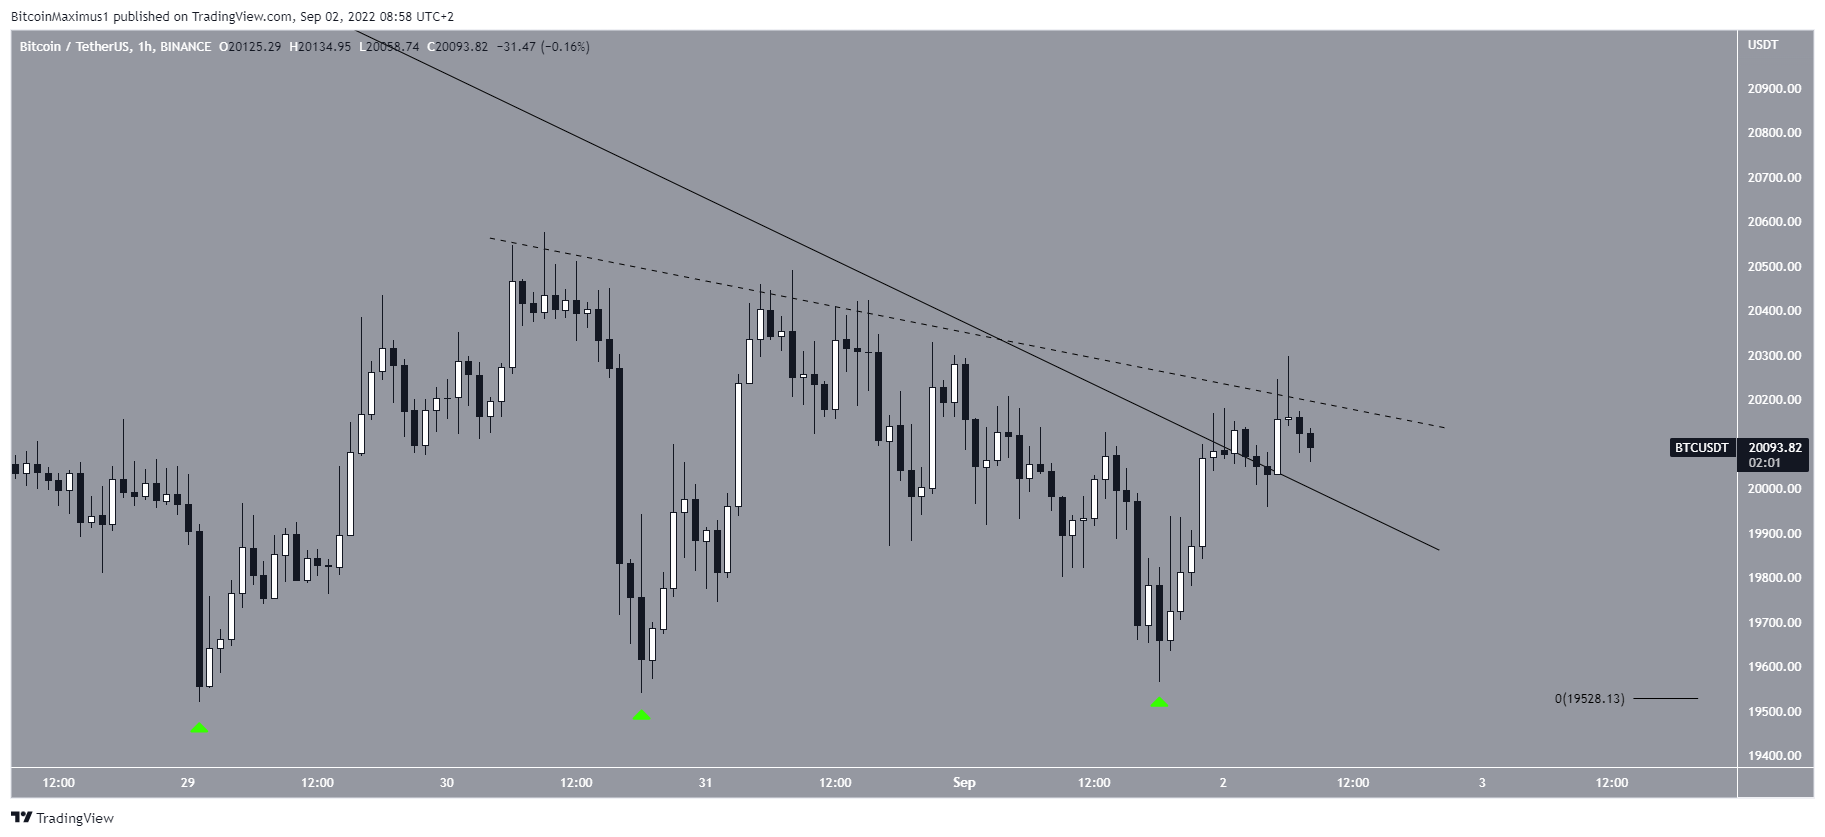
The hourly chart shows that BTC has created a triple-bottom formation (green icons), which is often considered a bullish pattern. This supports the possibility of the breakout from the aforementioned resistance line.
Bitcoin is still technically trading underneath an even shorter-term descending resistance line (dashed), which has so far caused numerous rejections and created long upper wicks.
A breakout from this short-term line would likely confirm the triple-bottom pattern and also validate the breakout from the longer-term wedge. Therefore, it could be the catalyst for an upward movement towards the $21,700 resistance area.
BTC wave count analysis
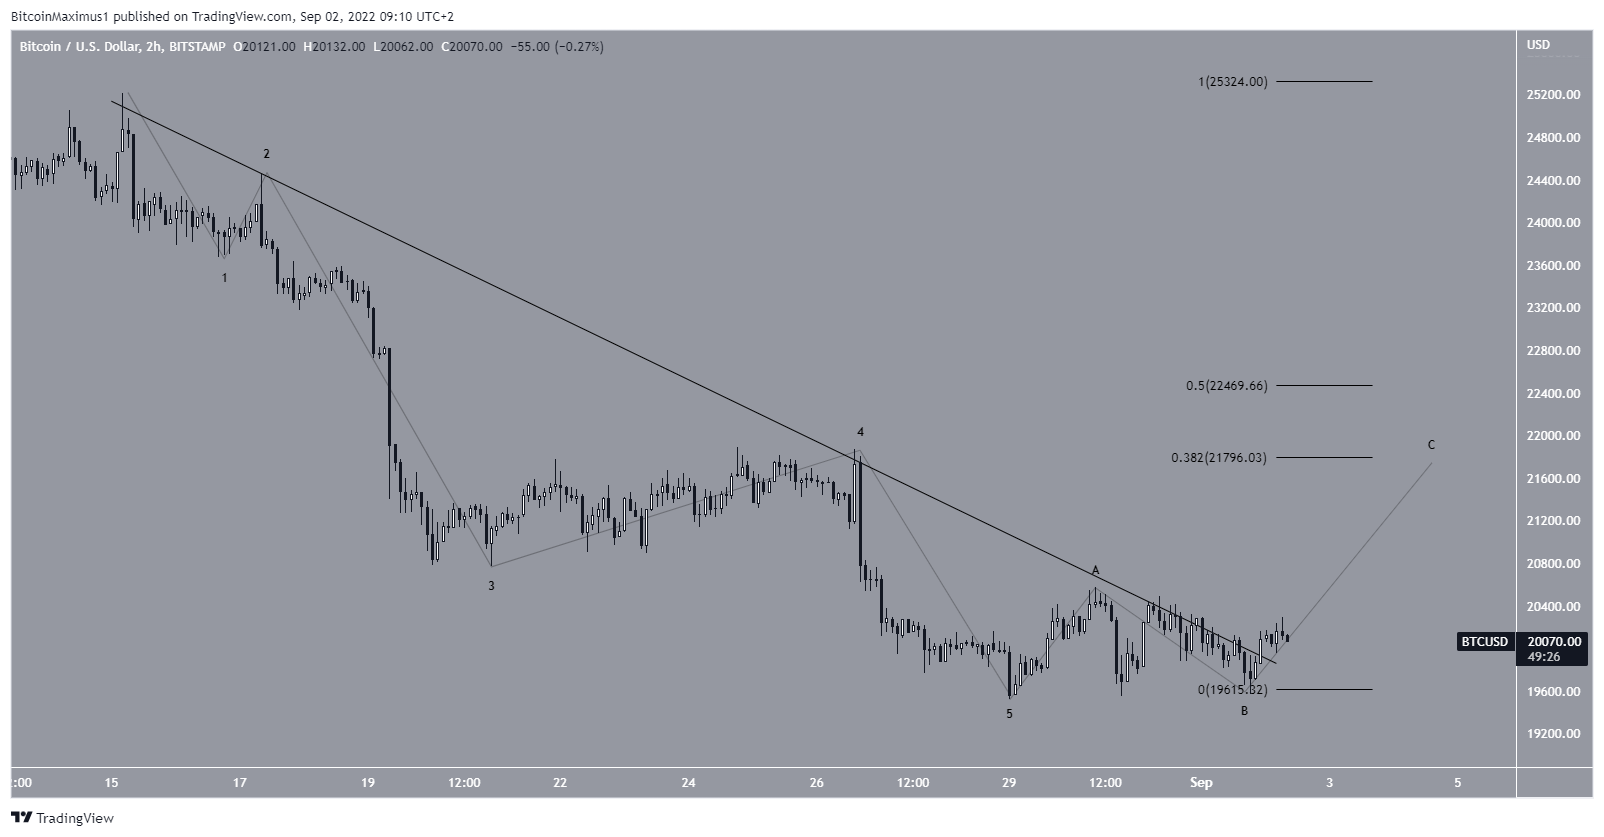
The most likely wave count suggests that Bitcoin has completed a five-wave downward pattern since the Aug. 15 high. If this is true, then the price has now begun an A-B-C corrective structure that is likely to take it towards the $21,700-$21,800 resistance area.
Currently, Bitcoin appears to be in the C wave of this structure.
For Be[in]Crypto’s previous Bitcoin (BTC) analysis, click here


