


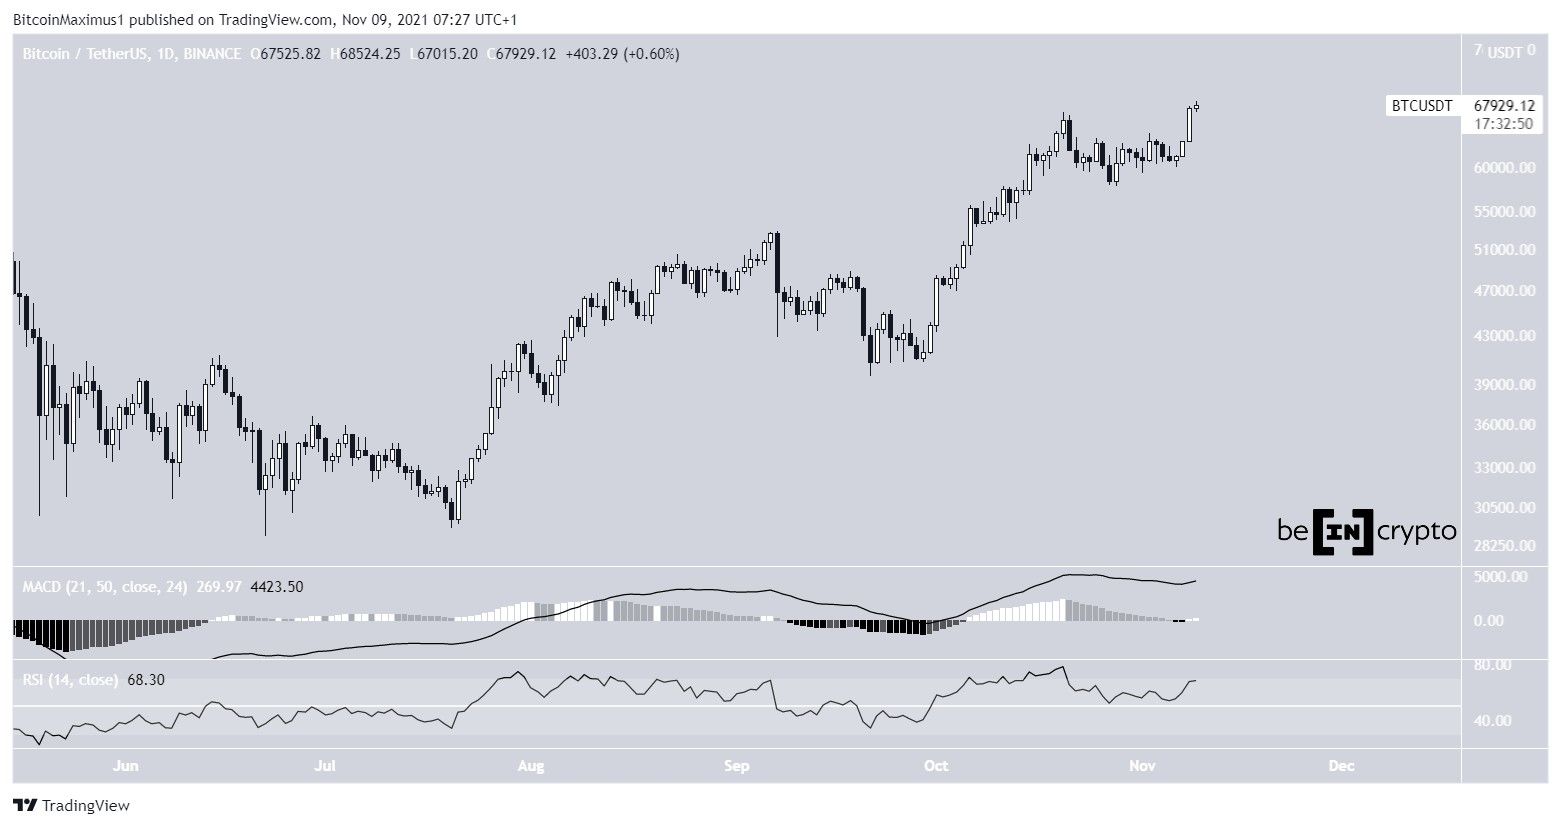
Bitcoin (BTC) is continuing the upward movement that has been ongoing since Nov 6 and managed to reach a new all-time high price on Nov 9.
On Nov 8, BTC created a bullish candlestick that took it to a new all-time high price. The increase continued the next day, and BTC has so far reached a new all-time high of $68,524.
The upward movement is supported by readings from technical indicators.
The MACD, which is created by a short and long-term moving average (MA), is moving upwards, and its histogram is back in the positive territory.
Similarly, the RSI is increasing and is above 50 and is close to moving above 70. While this would give an overbought reading, it would still be a sign of a strong bullish trend. The sharpest portions of upward movements usually transpire when the RSI is above 70.
Ongoing breakout
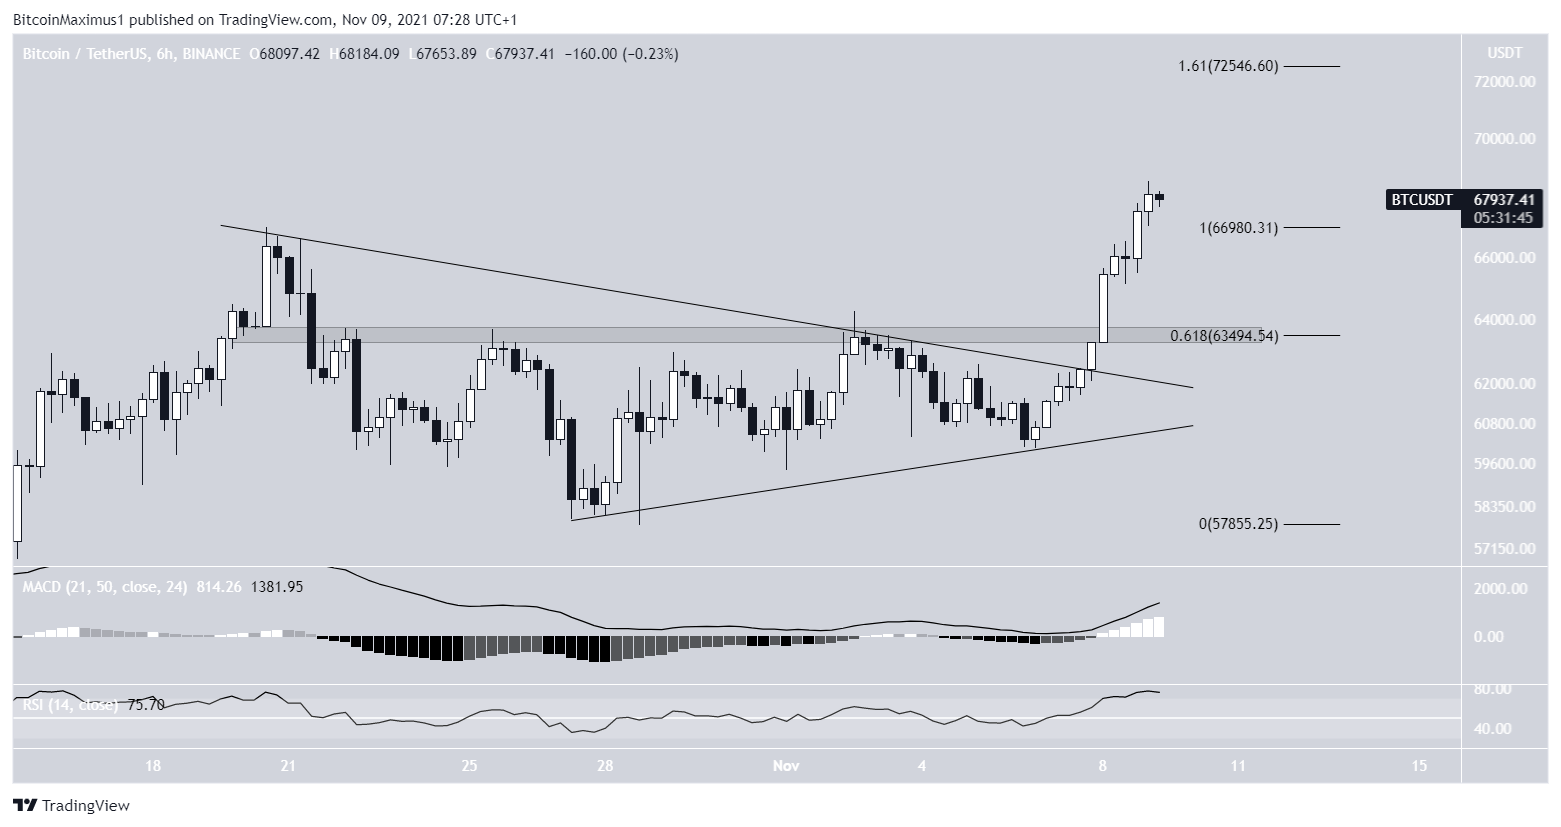
The six-hour chart shows that BTC has broken out from a symmetrical triangle in an upward move that has been ongoing since Nov 6. This confirmed that the previous correction had ended and BTC began a new upward trend.
The breakout above the $63,500 resistance area, which is the 0.618 Fib retracement resistance level and the horizontal resistance area further confirmed this.
Similar to the daily time frame, both the RSI and MACD are moving upwards, supporting the continuation of the upward move.
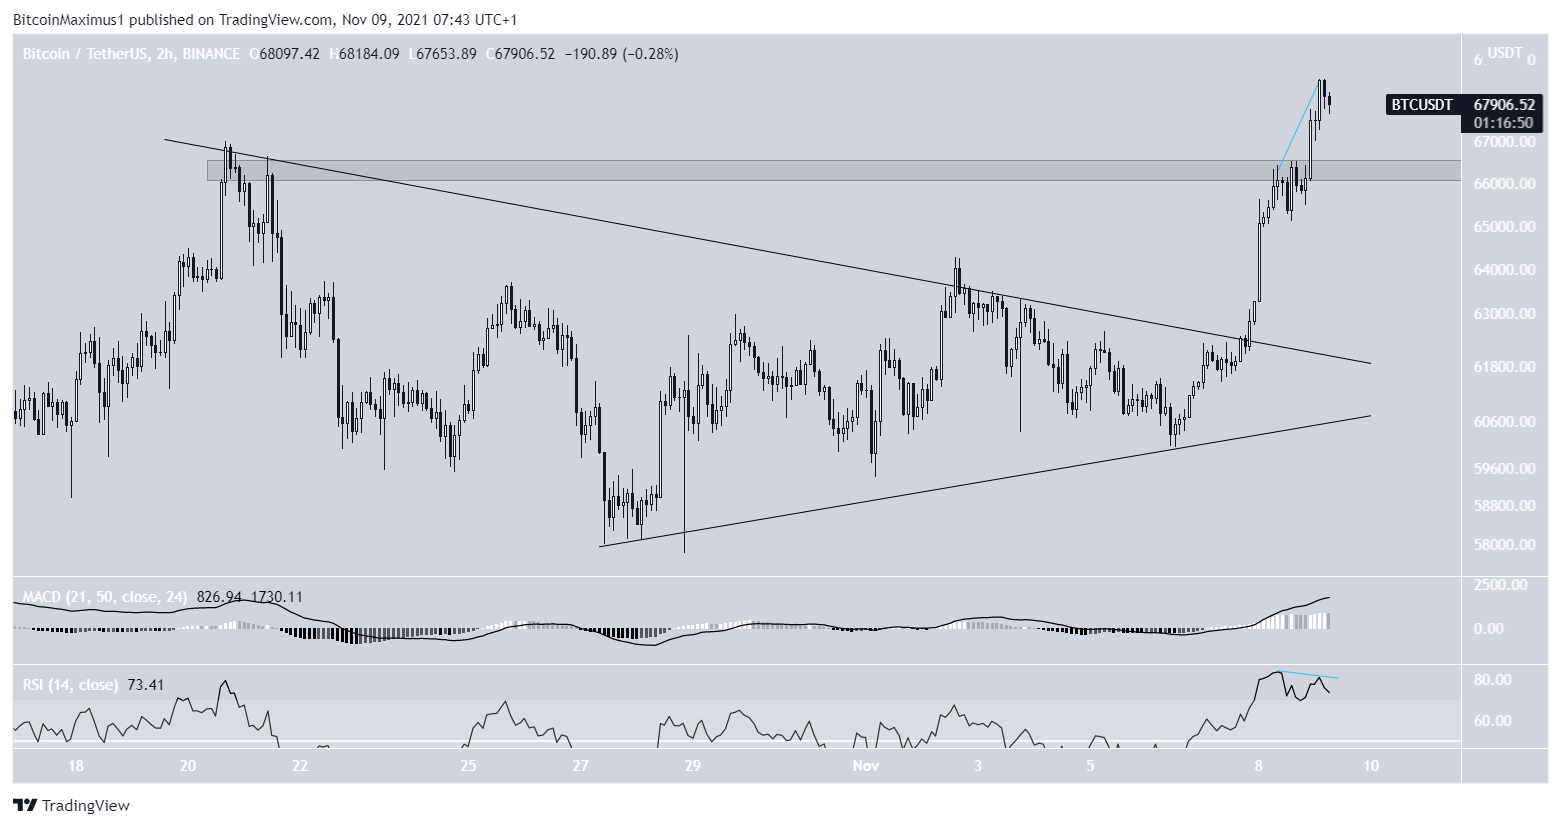
The two-hour chart shows the first signs of weakness in the form of a bearish divergence in the RSI. However, the MACD is still increasing with strength.
If a short-term decrease transpires, the $66,300 area would be expected to act as support and help it to rebound.
BTC wave count
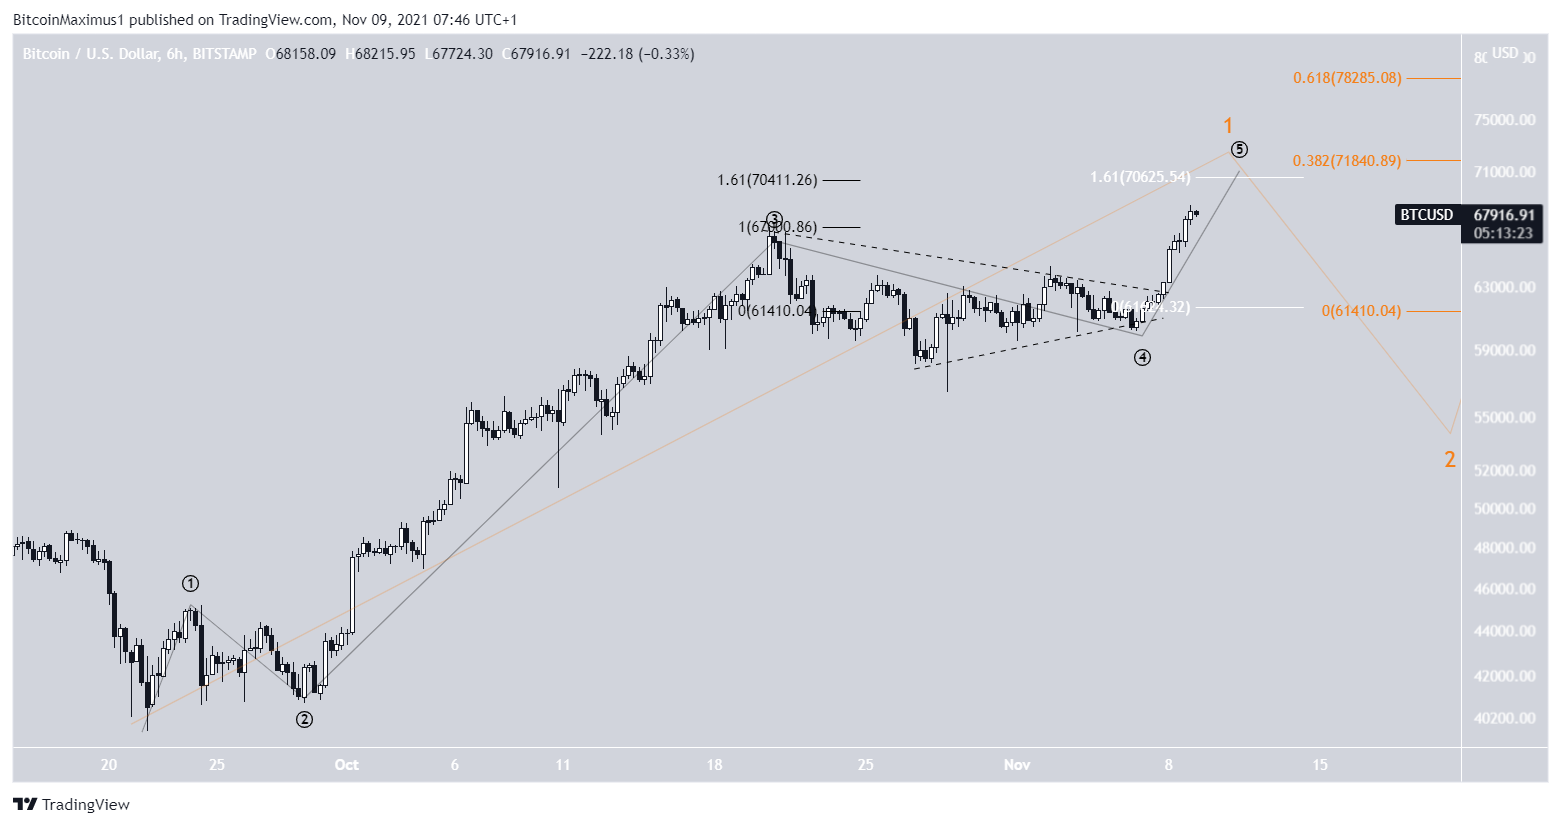
The wave count indicates that BTC is in wave one (orange) of an upward move that has been ongoing since Sept 21. In it, BTC is in sub-wave five (black). This is the fifth and final portion of this upward move, after which a correction would be likely.
The previously outlined symmetrical triangle was likely part of wave four.
The most likely target for the top of this move is found between $70,400-$71,840. This target range is found by measuring:
- 1.61 external Fib retracement on wave four (black)
- 1.61 length of wave one (white)
- 0.382 length of waves 1-3 (orange)
A correction would be likely to follow.
For BeInCrypto’s previous Bitcoin (BTC) analysis, click here.


