


Bitcoin (BTC) has been moving upwards since Jan. 24 and could be in the initial stages of establishing a fresh bullish structure.
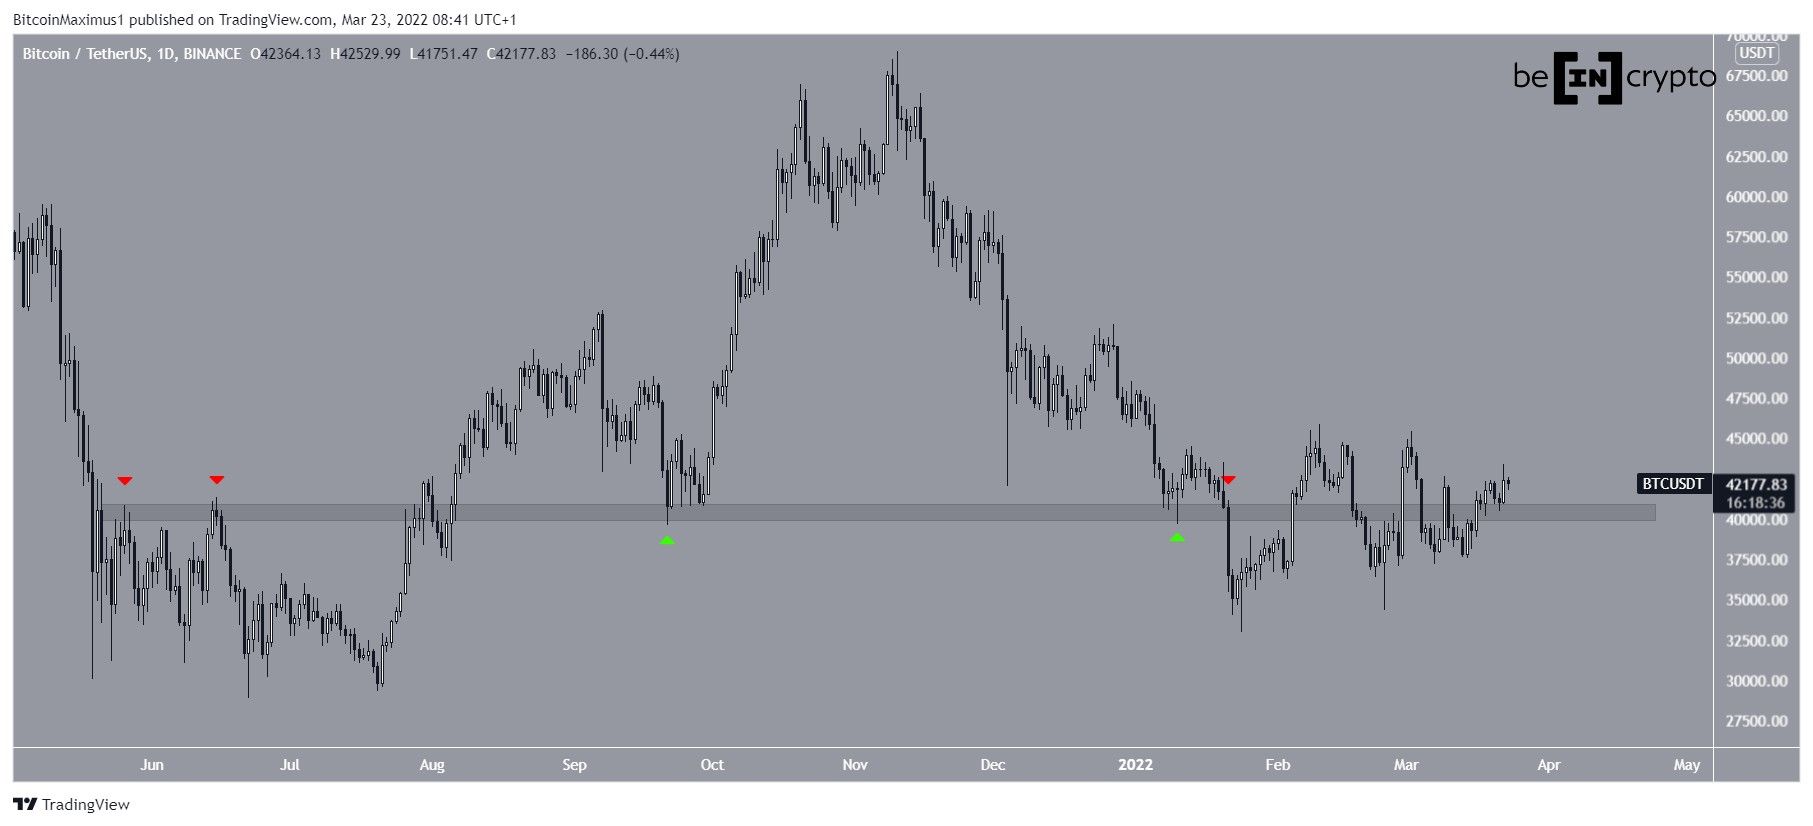
Since May 2021, the $40,500 area has been crucial in determining the BTC price trend. The area acted as resistance twice (red icons), before turning to support afterward (green icons).
However, since the breakdown that occurred on Jan. 21 (red icon), the area has not acted as a resistance or support, as BTC has moved above and below it several times.
Nevertheless, the fact that the price is trading above this region can be seen as a bullish sign.
Bullish BTC fractal
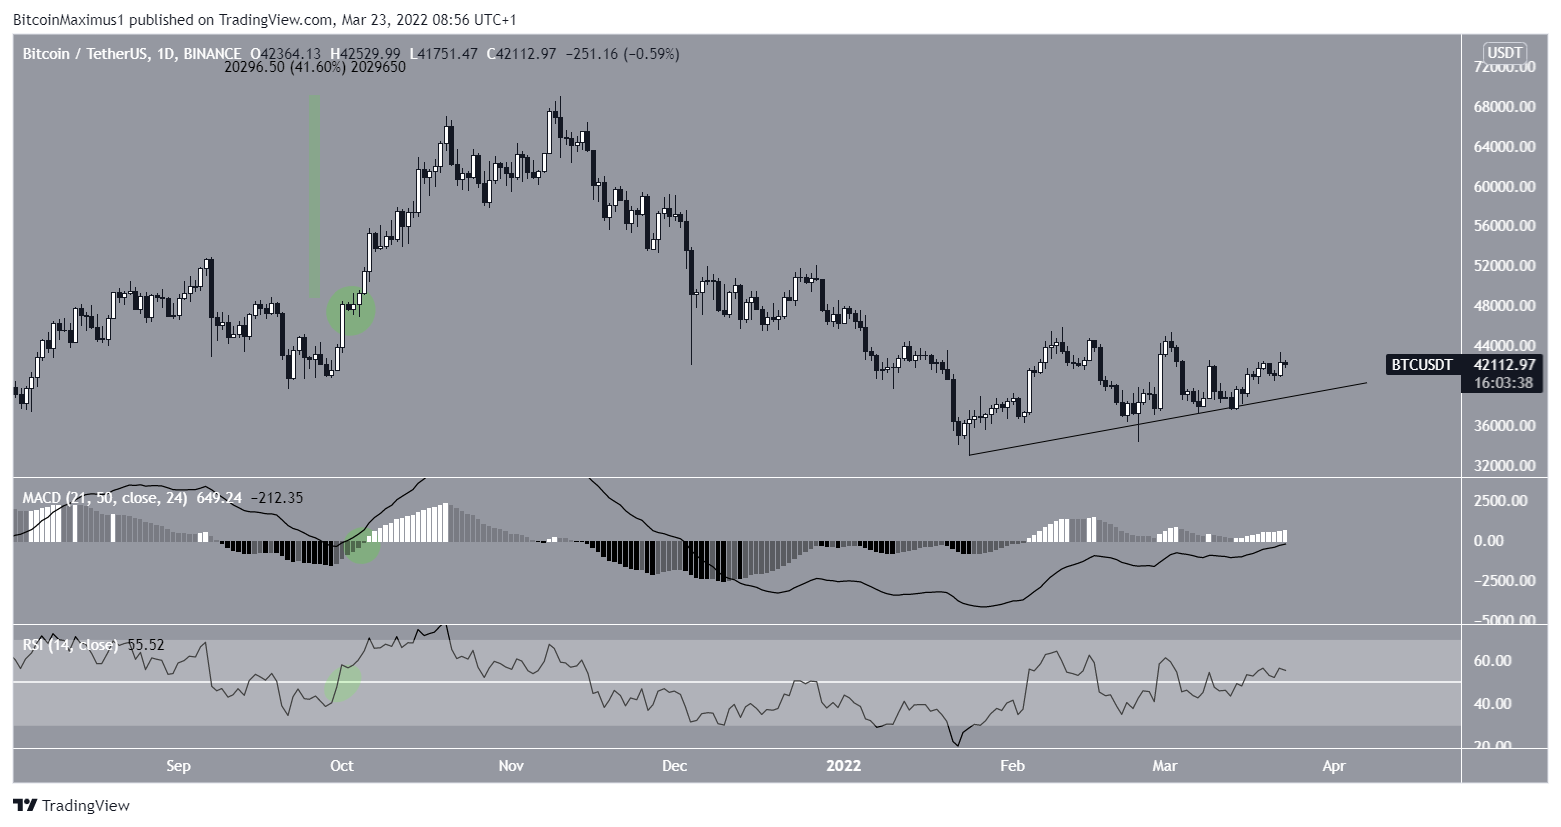
The daily chart provides a mostly bullish outlook.
BTC has been following an ascending support line since Jan 24. So far, it has been validated four times and technical indicators are bullish.
The MACD, which is created by short and long-term moving averages (MA) is increasing and has crossed into positive territory.
The RSI, which is a momentum indicator is also increasing and is above 50. Both of these readings are considered signs of bullish trends.
The previous time these signals occurred together (green circle) was in October 2021, before a spike with a magnitude of 41.60% transpired.
Therefore, it’s possible that a similar upward move will occur this time around.
Future movement
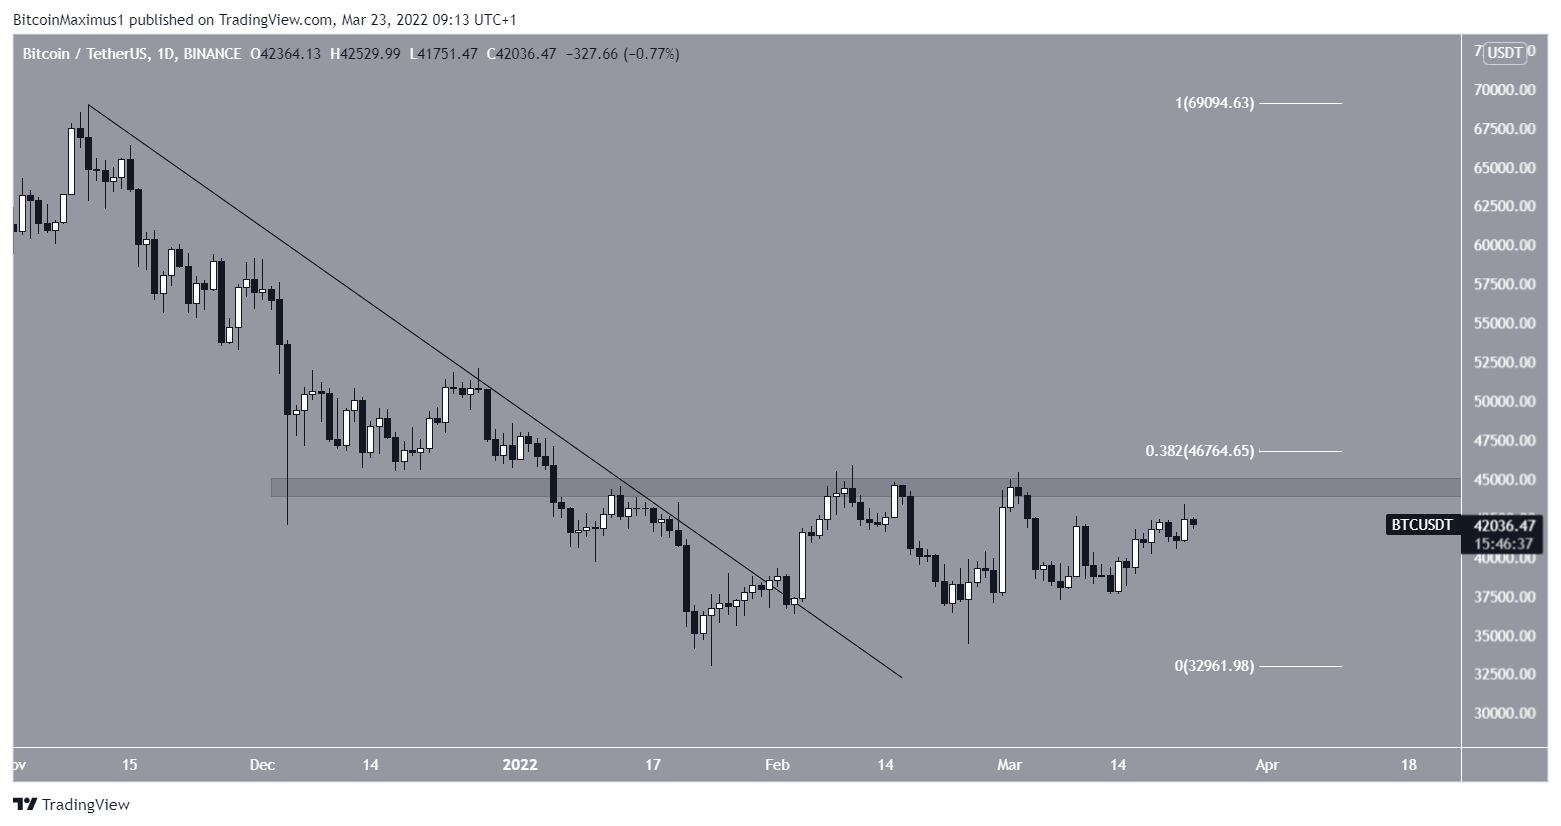
If the upward move continues, the main resistance area would likely be reached between $44,500-$46,700. The former is a horizontal level that has rejected BTC four times so far, while the latter is the 0.382 Fib retracement resistance level.
The most likely wave count also suggests that BTC will increase in the near future.
If the price manages to clear this area, it would likely accelerate very quickly.
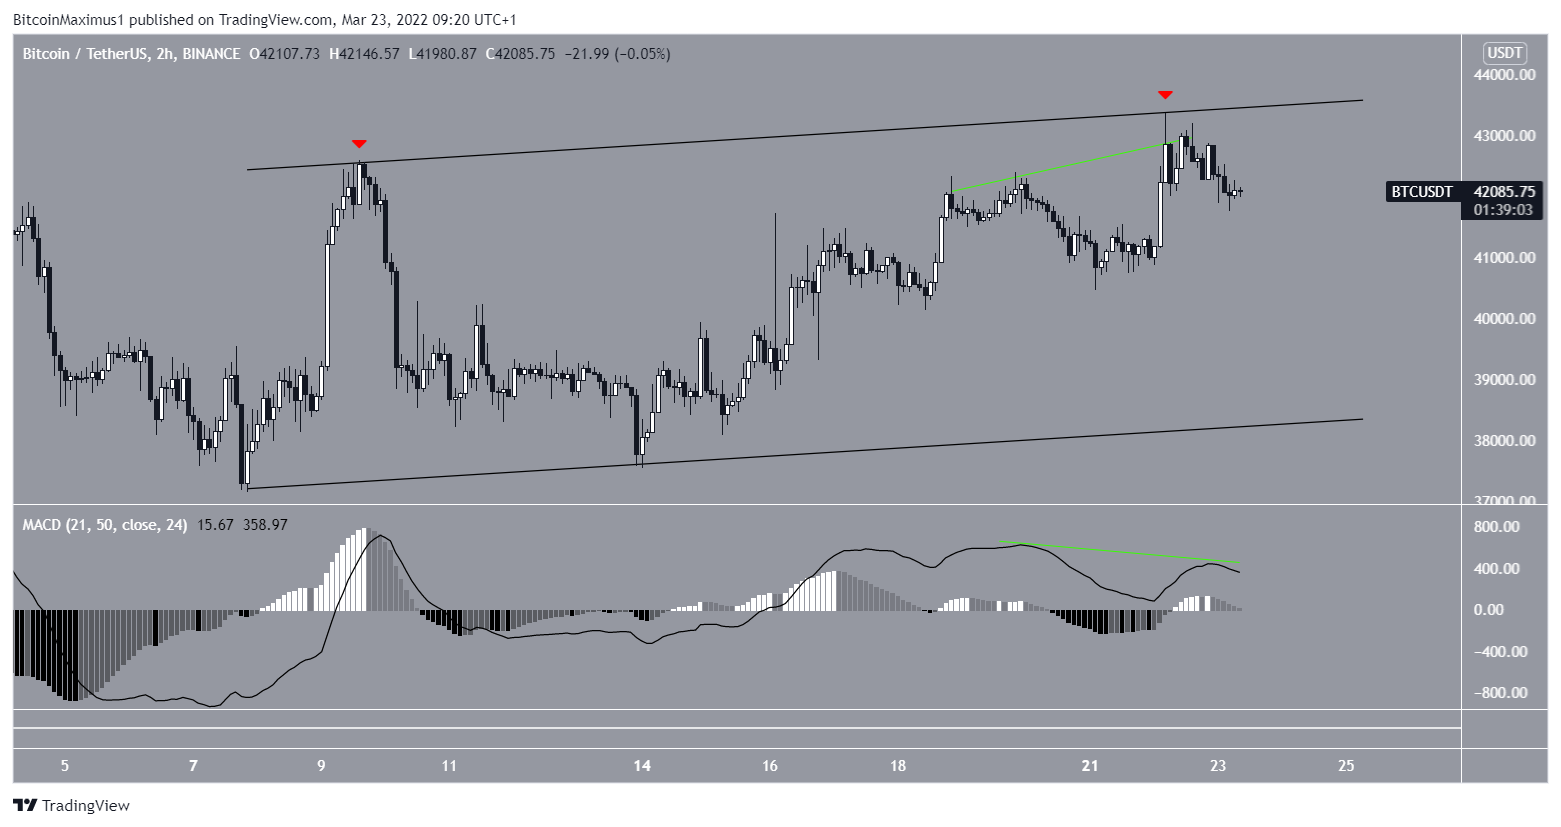
However, the two-hour chart shows that BTC has been trading inside an ascending parallel channel since March 7. Such channels usually contain corrective movements and its resistance line rejected the price (red icon) on March 22.
Furthermore, the MACD has generated bearish divergences (green lines), so it’s possible that a short-term drop will occur before the upward momentum can continue.
For BeInCrypto’s previous Bitcoin (BTC) analysis, click here


