Bitcoin (BTC) failed to reach the resistance line of its short-term channel on Dec 16 and could decrease towards its support line before an eventual breakout.
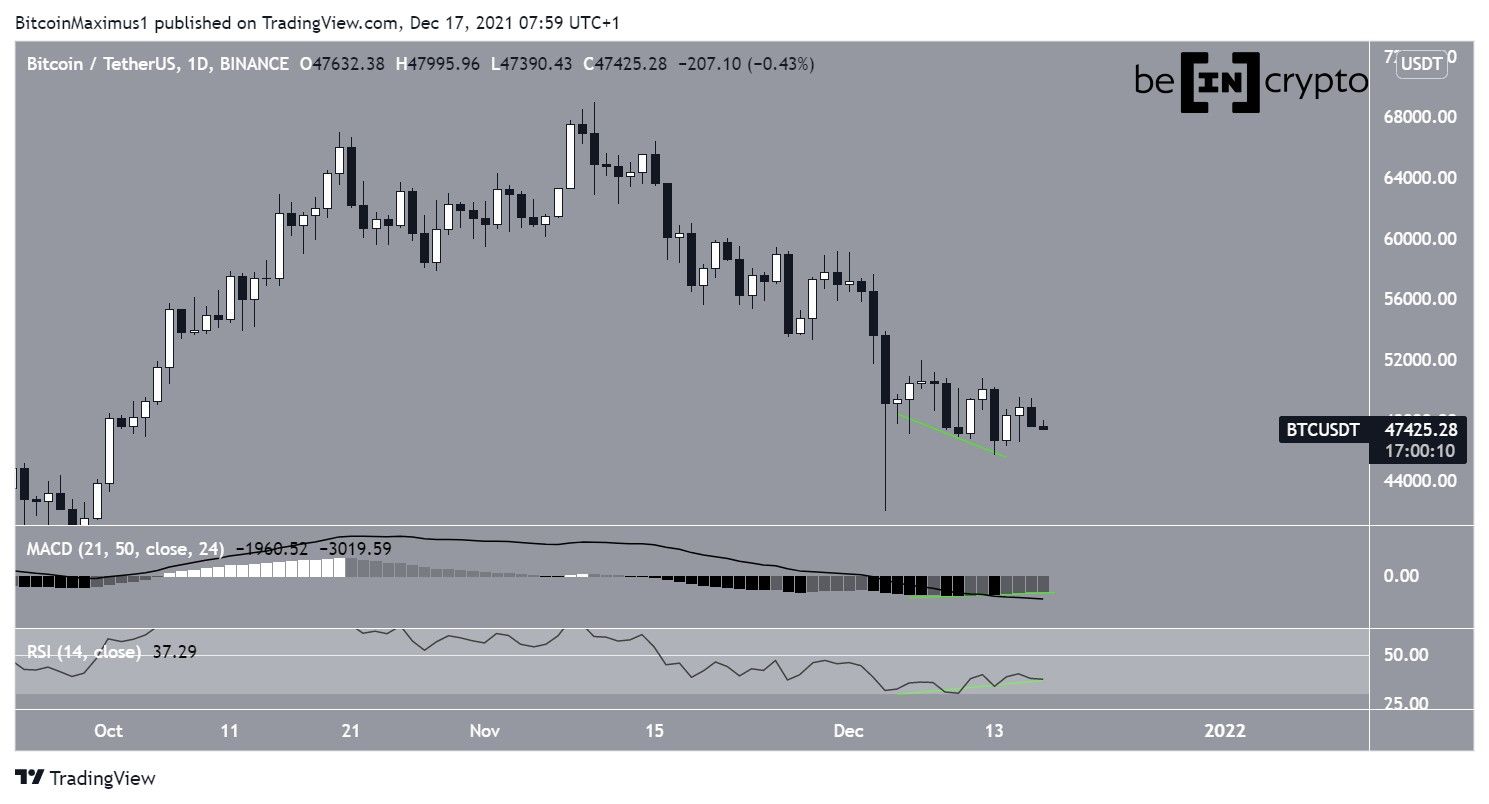
Bitcoin decreased slightly on Dec 16 but is still trading inside the range of the previous day’s increase.
More importantly, there is a strong bullish divergence developing in both the RSI and MACD. This is a sign that often precedes bullish trend reversals.
Therefore, as long as the divergence is intact, it’s likely that BTC will initiate some sort of rebound.
Current pattern
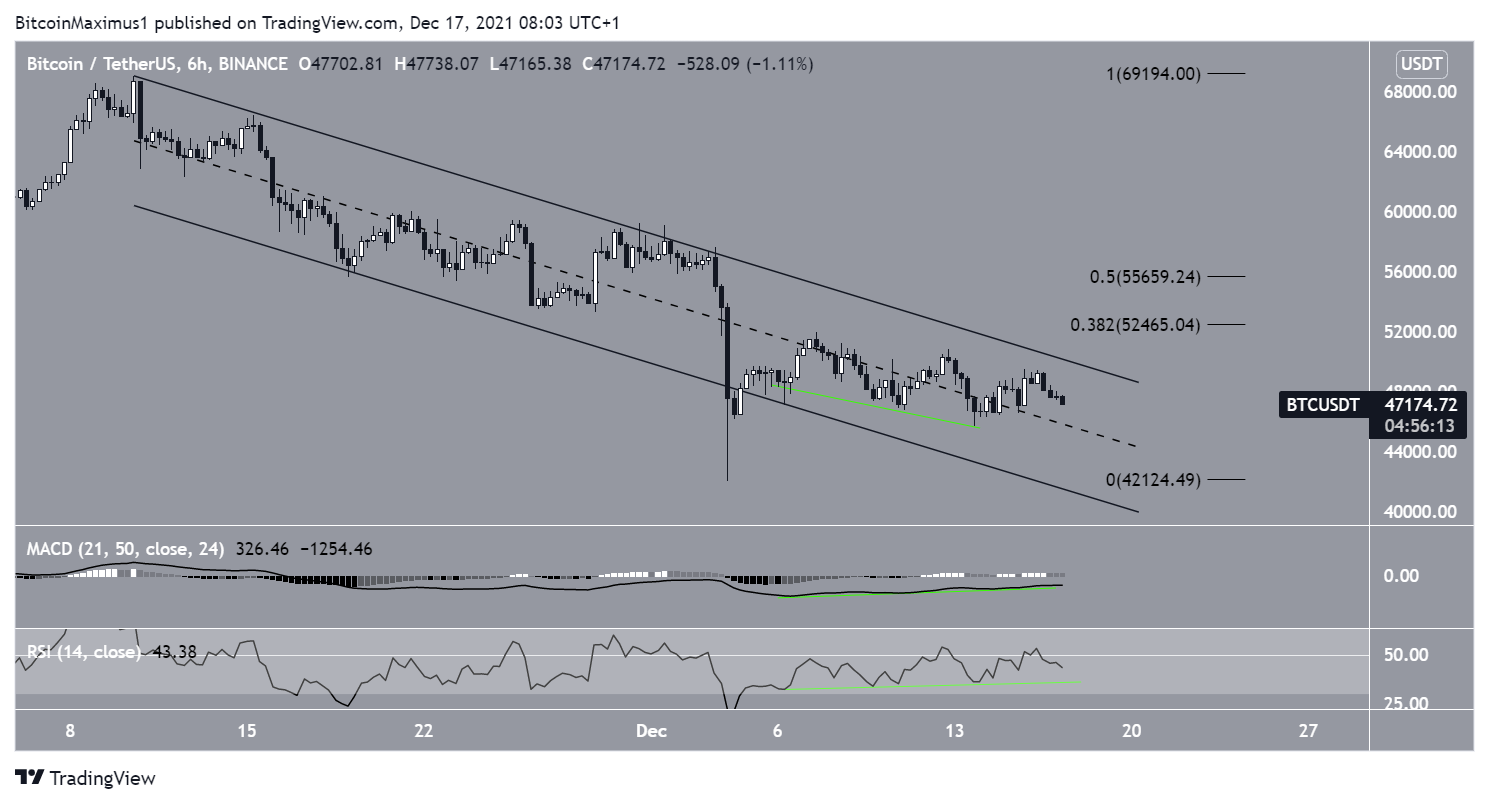
The six-hour chart shows that BTC has been trading inside a descending parallel channel since reaching an all-time high price on Nov 10.
Currently, it’s trading close to the midline of the channel.
Both the MACD and RSI have generated even more pronounced bullish divergences, a sign that an eventual breakout is expected.
If one occurs, the closest resistance would likely be found between $52,450-$55,650. This area is created by the 0.382-0.5 Fib retracement resistance levels.
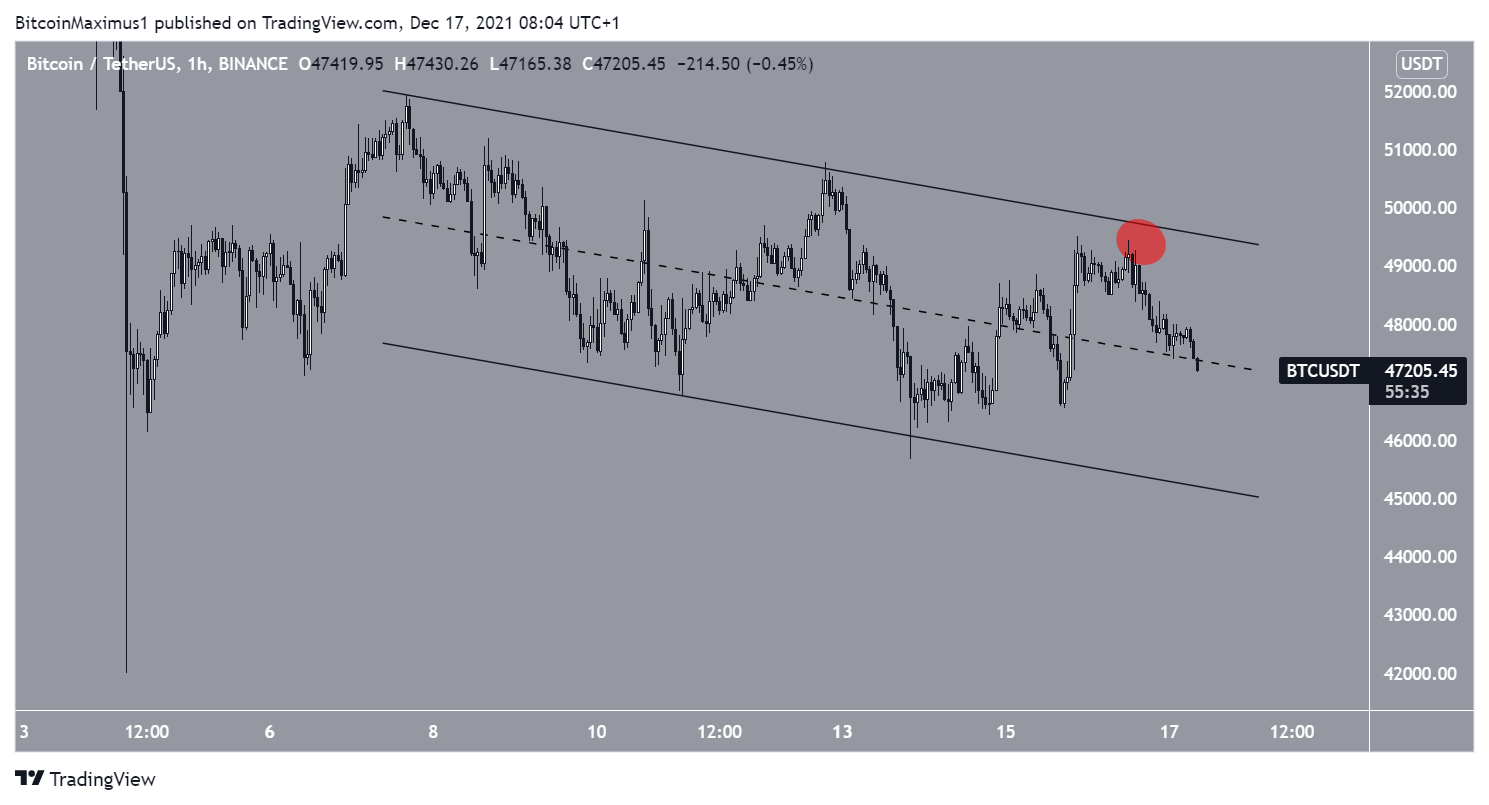
Finally, the hourly chart shows another descending parallel channel that’s been in place since Dec 7.
On Dec 16, BTC failed to reach its resistance line (red circle) before falling below its midline.
Therefore, it’s possible that it will retest the support line of the channel at $45,000 once more before eventually breaking out.
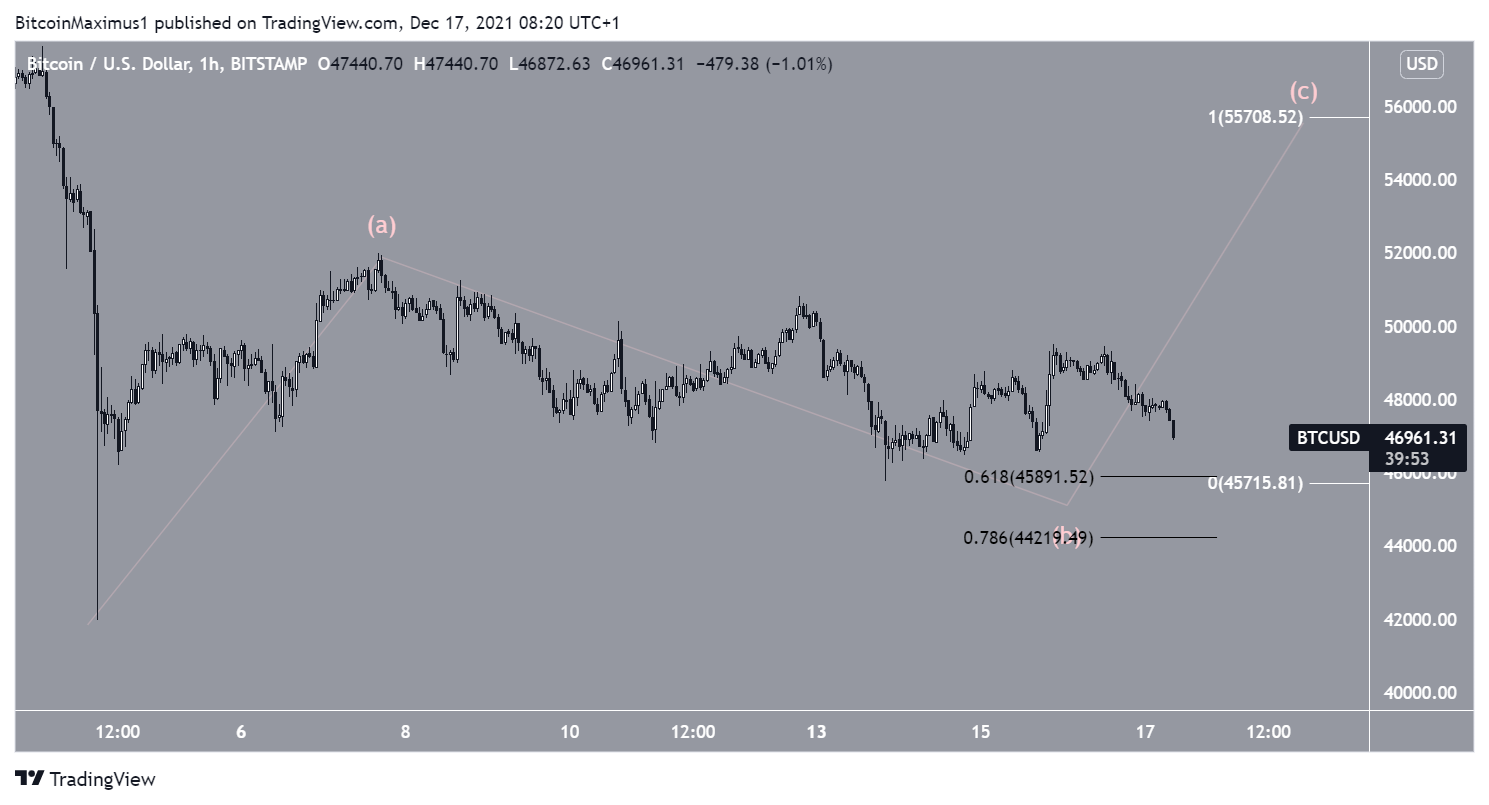
BTC wave count
The short-term count suggests that BTC is still correcting inside the B wave of an A-B-C corrective structure.
The most likely level for the wave to end would be between $45,900 and $44,200, an area created by the 0.618-0.786 Fib retracement support levels (black).
After this, waves A:C would be expected to have a 1:1 ratio, leading to a high near $55,700. However, this depends on the exact bottom for wave B.
The long-term count also suggests that an upward move is likely.