


Bitcoin (BTC) is still trading above some important horizontal support levels but is not showing any decisive bullish signs.
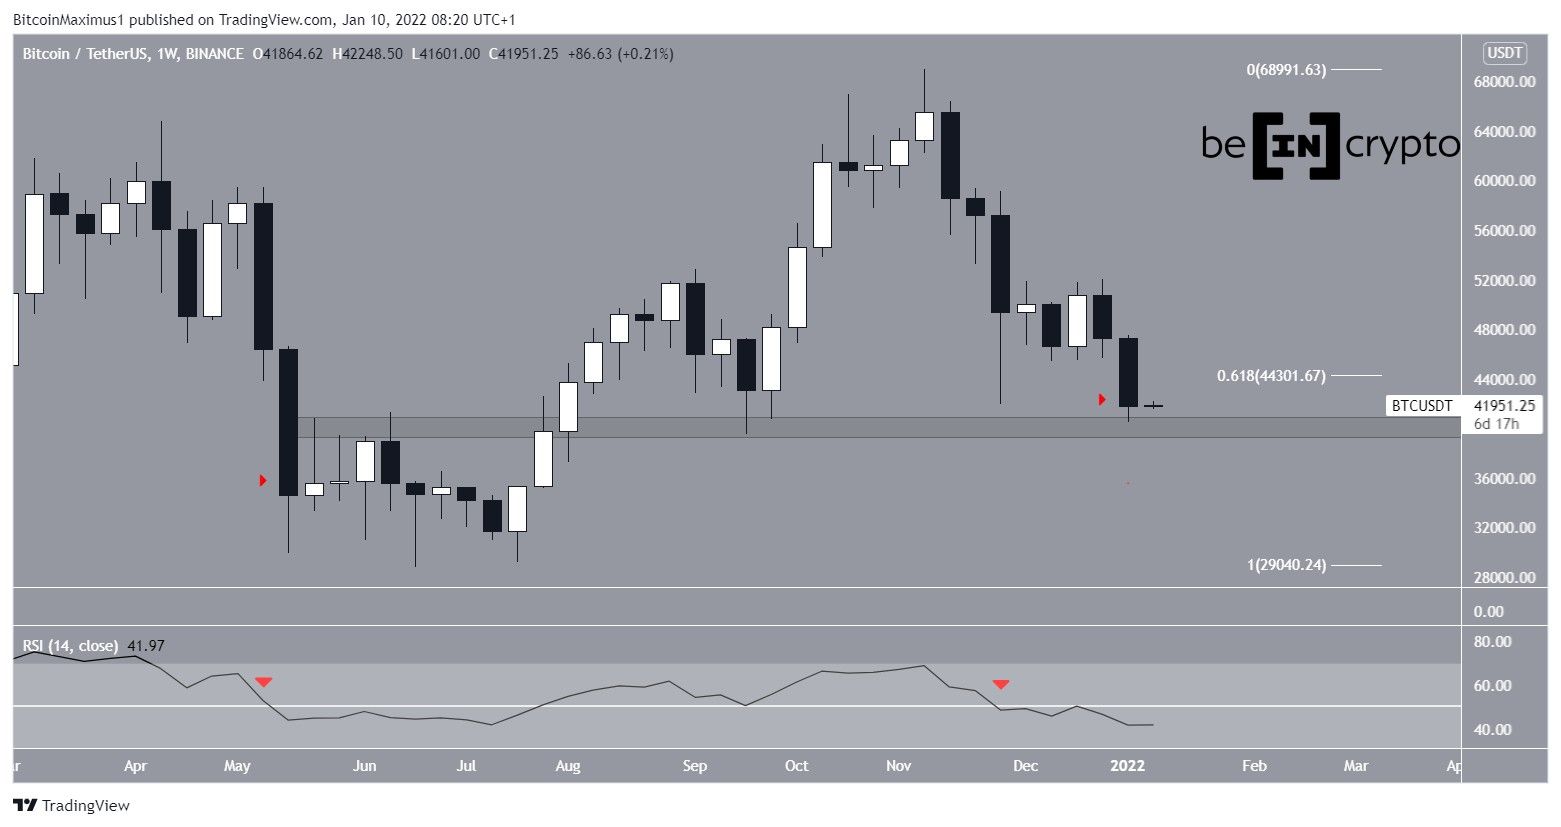
Bitcoin decreased considerably during the week of Jan 3-9, falling to a low of $40,500 before bouncing. The decrease caused a breakdown below the 0.618 Fib retracement support level and the wick lows of December 2021.
Currently, BTC is trading just above the $40,000 horizontal support area.
Technical indicators are turning bearish since the RSI has fallen below 50 (red icon). The RSI is a momentum indicator, and values below 50 are normally considered bearish. However, the previous time this occurred (May 2021) the breakdown did not last, so it remains to be seen if the same will transpire this time around.
Possible BTC double bottom?
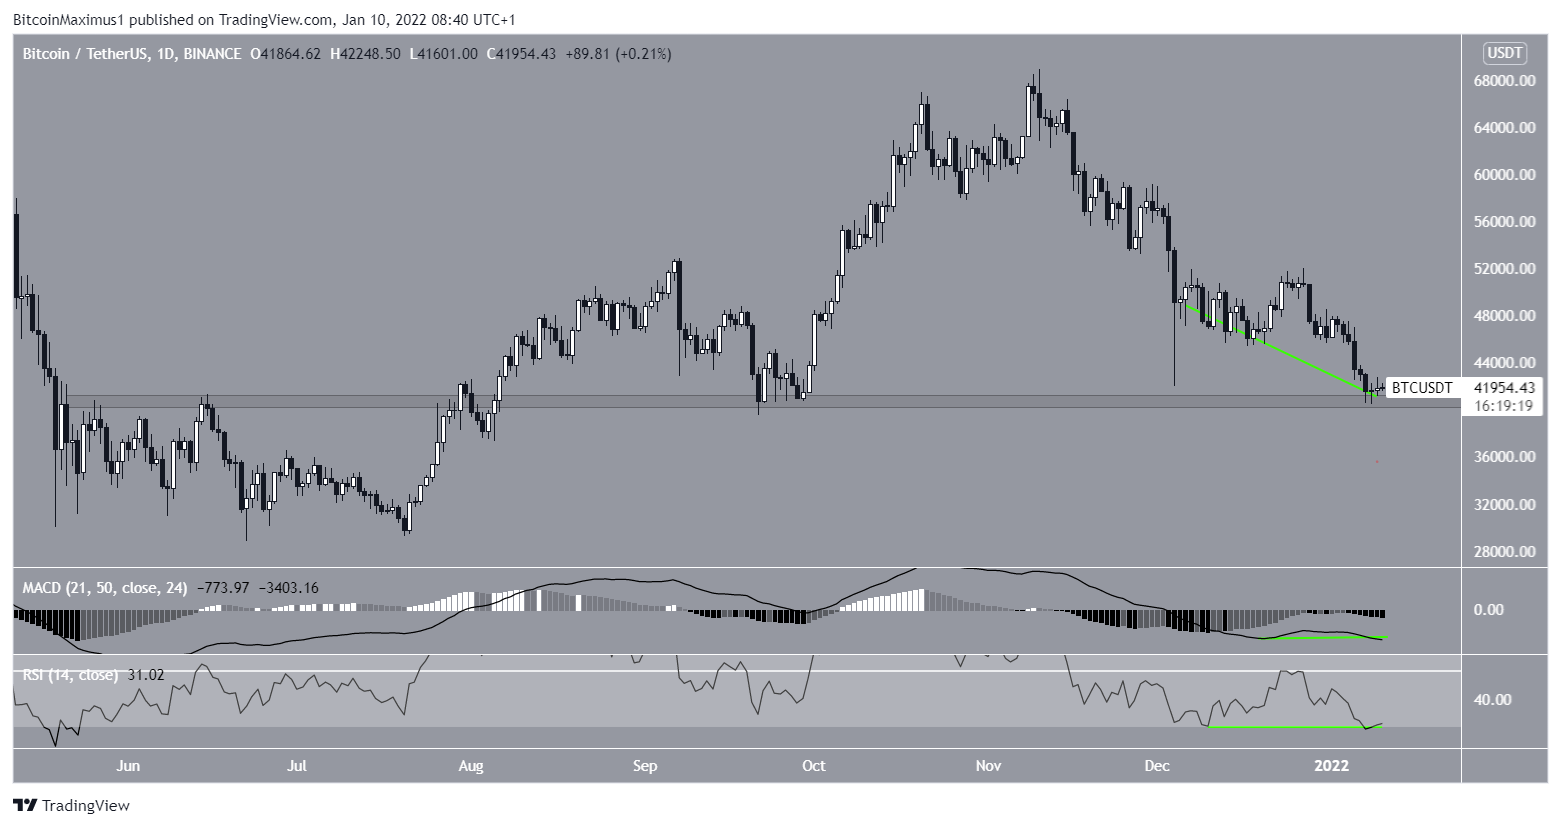
The daily chart shows a potential double bottom pattern forming relative to the price on Dec 4. The pattern is developing just above the $41,000 minor support area.
However, similar to the weekly time frame, technical indicators are gradually turning bearish. This is especially visible in the case of the bullish divergences that were previously present in the RSI and MACD.
Both BTC indicators have now invalidated their bullish divergences (green lines), which is not a good sign for the possibility of a bullish trend reversal.
So, while the BTC price is still managing to trade above an important support level, technical indicators fail to confirm any sort of bullish reversal.
Short-term channel
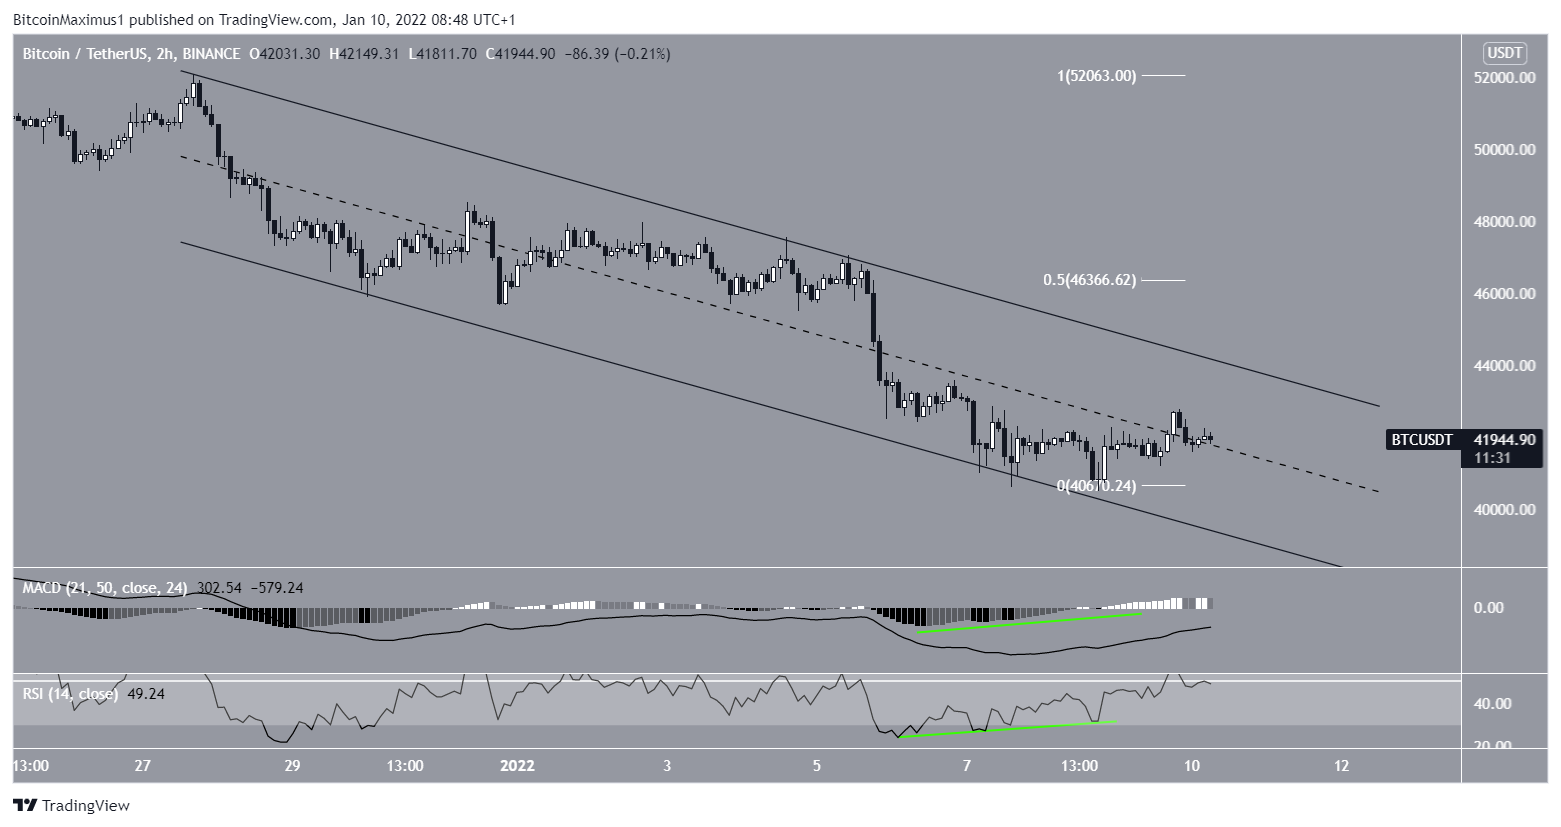
The two-hour chart shows that BTC has been trading inside a descending parallel channel since Dec 27, 2021. The low on Jan 7 occurred right at the support line of this pattern.
Such channels are usually considered corrective patterns, meaning that a breakout from them would be the most likely scenario.
If this occurs, the closest resistance area would be found at $46,350. This is the 0.5 Fib retracement resistance level and a horizontal resistance area.
For BeInCrypto’s previous Bitcoin (BTC) analysis, click here.


