
Bitcoin has been increasing since March 25, but the rally stalled yesterday once BTC created a Doji candlestick.
While the long-term trend for bitcoin is still bullish, a short-term retracement is expected prior to the continuation of the upward movement.
Bitcoin Rally Stalls
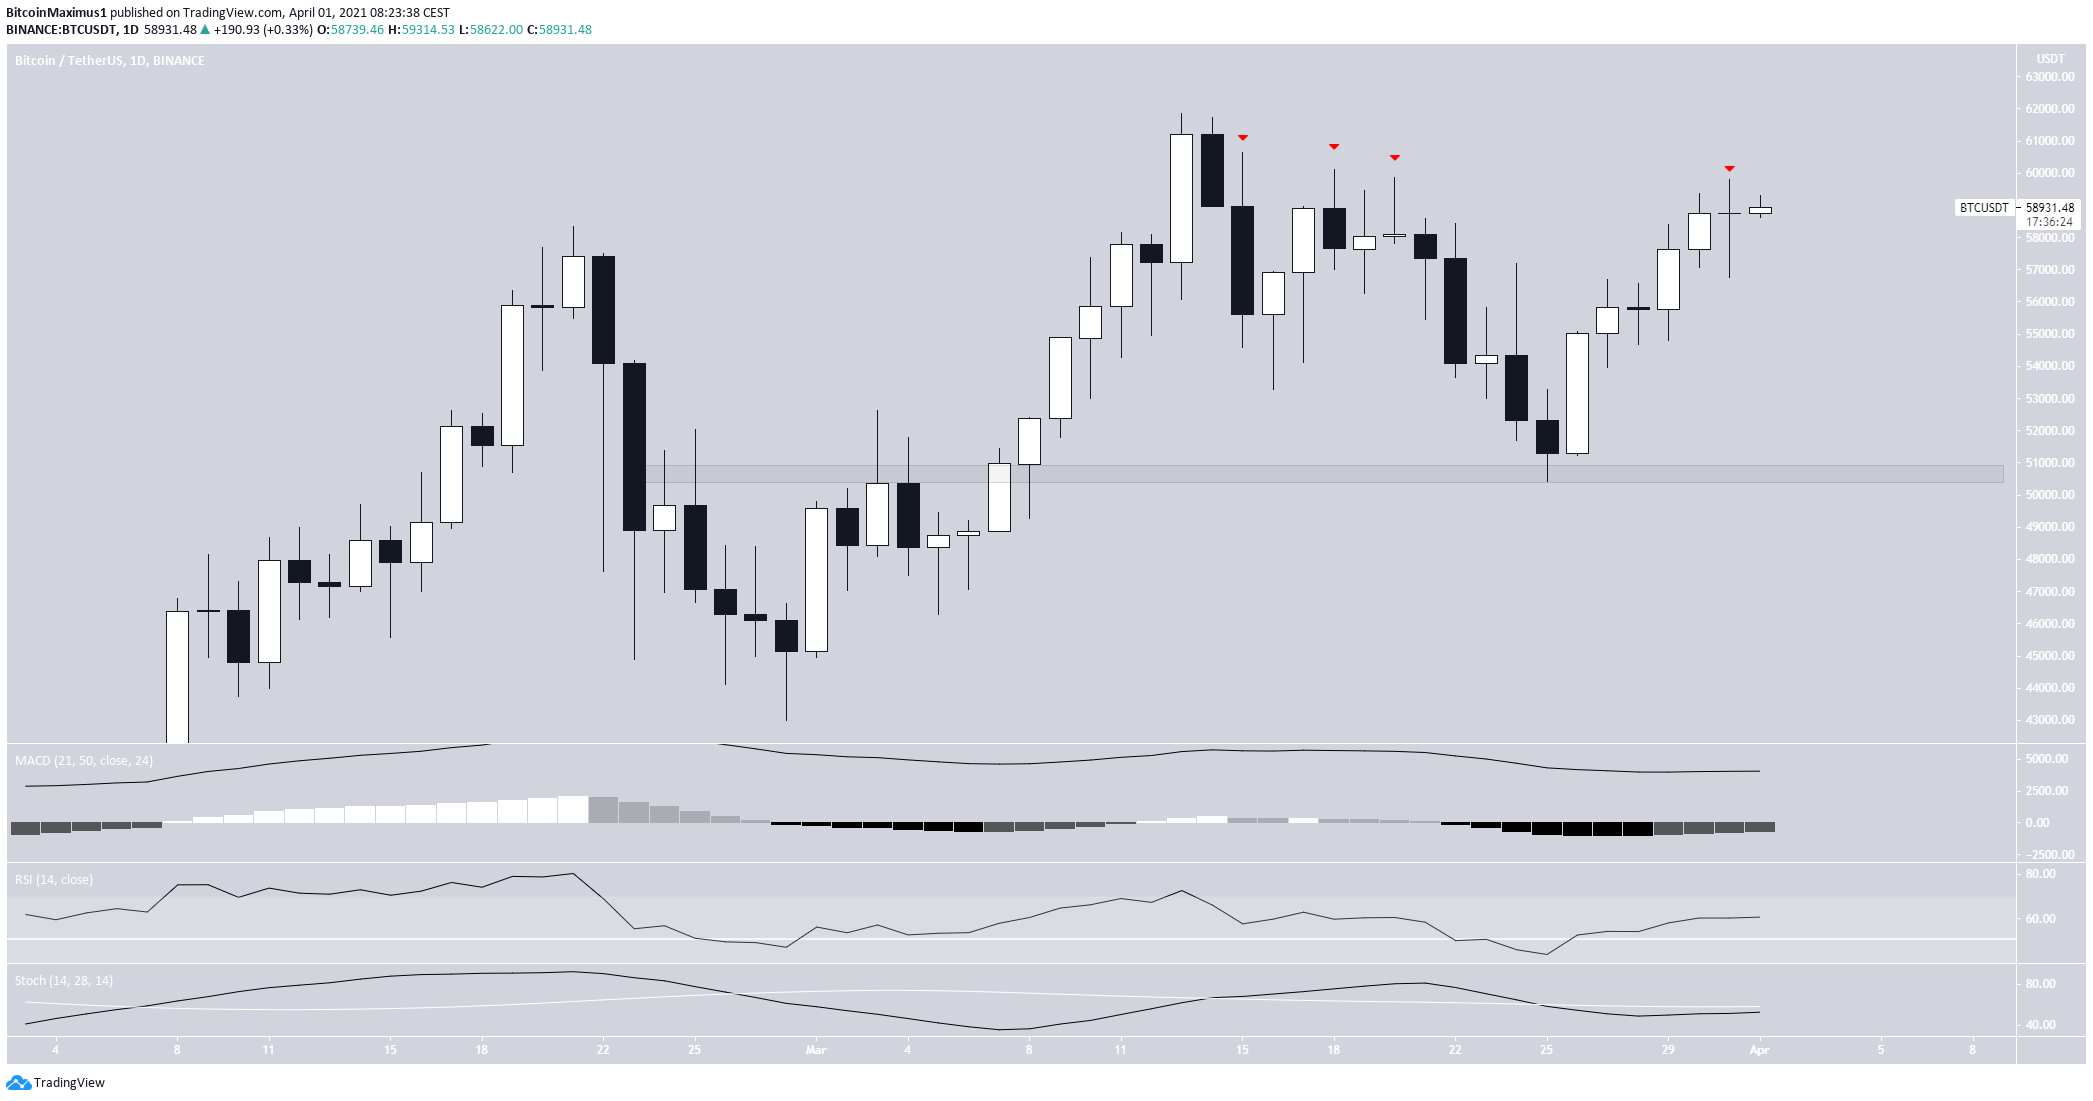
While BTC has been increasing since March 25, the rally stalled yesterday. After reaching a high of $59,800 on March 31, BTC created a doji candlestick — a sign of indecision. This can be seen as a sign of weakness when transpiring in an upward trend.
The candlestick was created at a resistance area near $60,000. This the same place where three upper wicks had been previously created at the beginning of March.
Short-Term Weakness
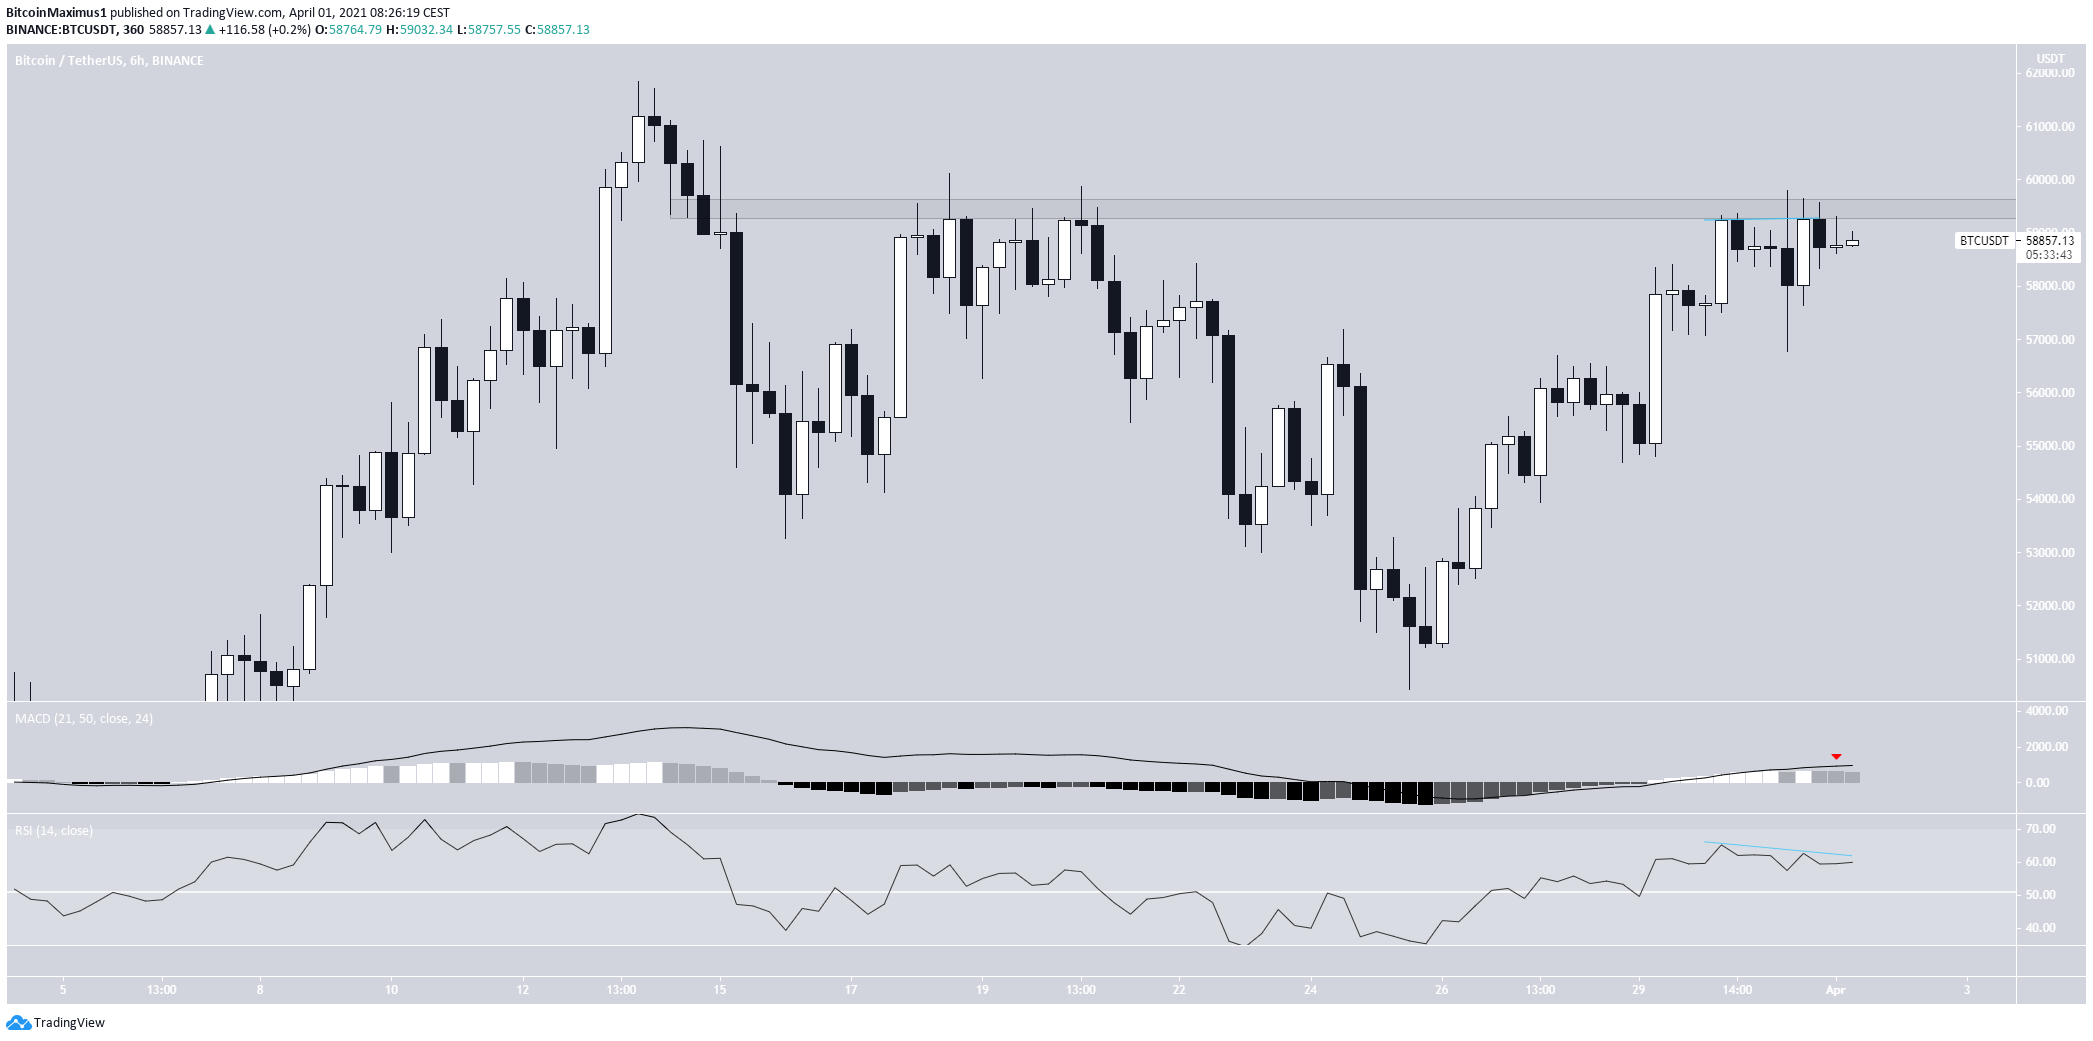
The six-hour chart shows the first signs of weakness.
BTC has struggled to move above the $59,700 resistance area since it was rejected yesterday.
In addition, the RSI has generated a bearish divergence and the MACD has generated one lower momentum bar. Both of these suggest the rally is losing strength.
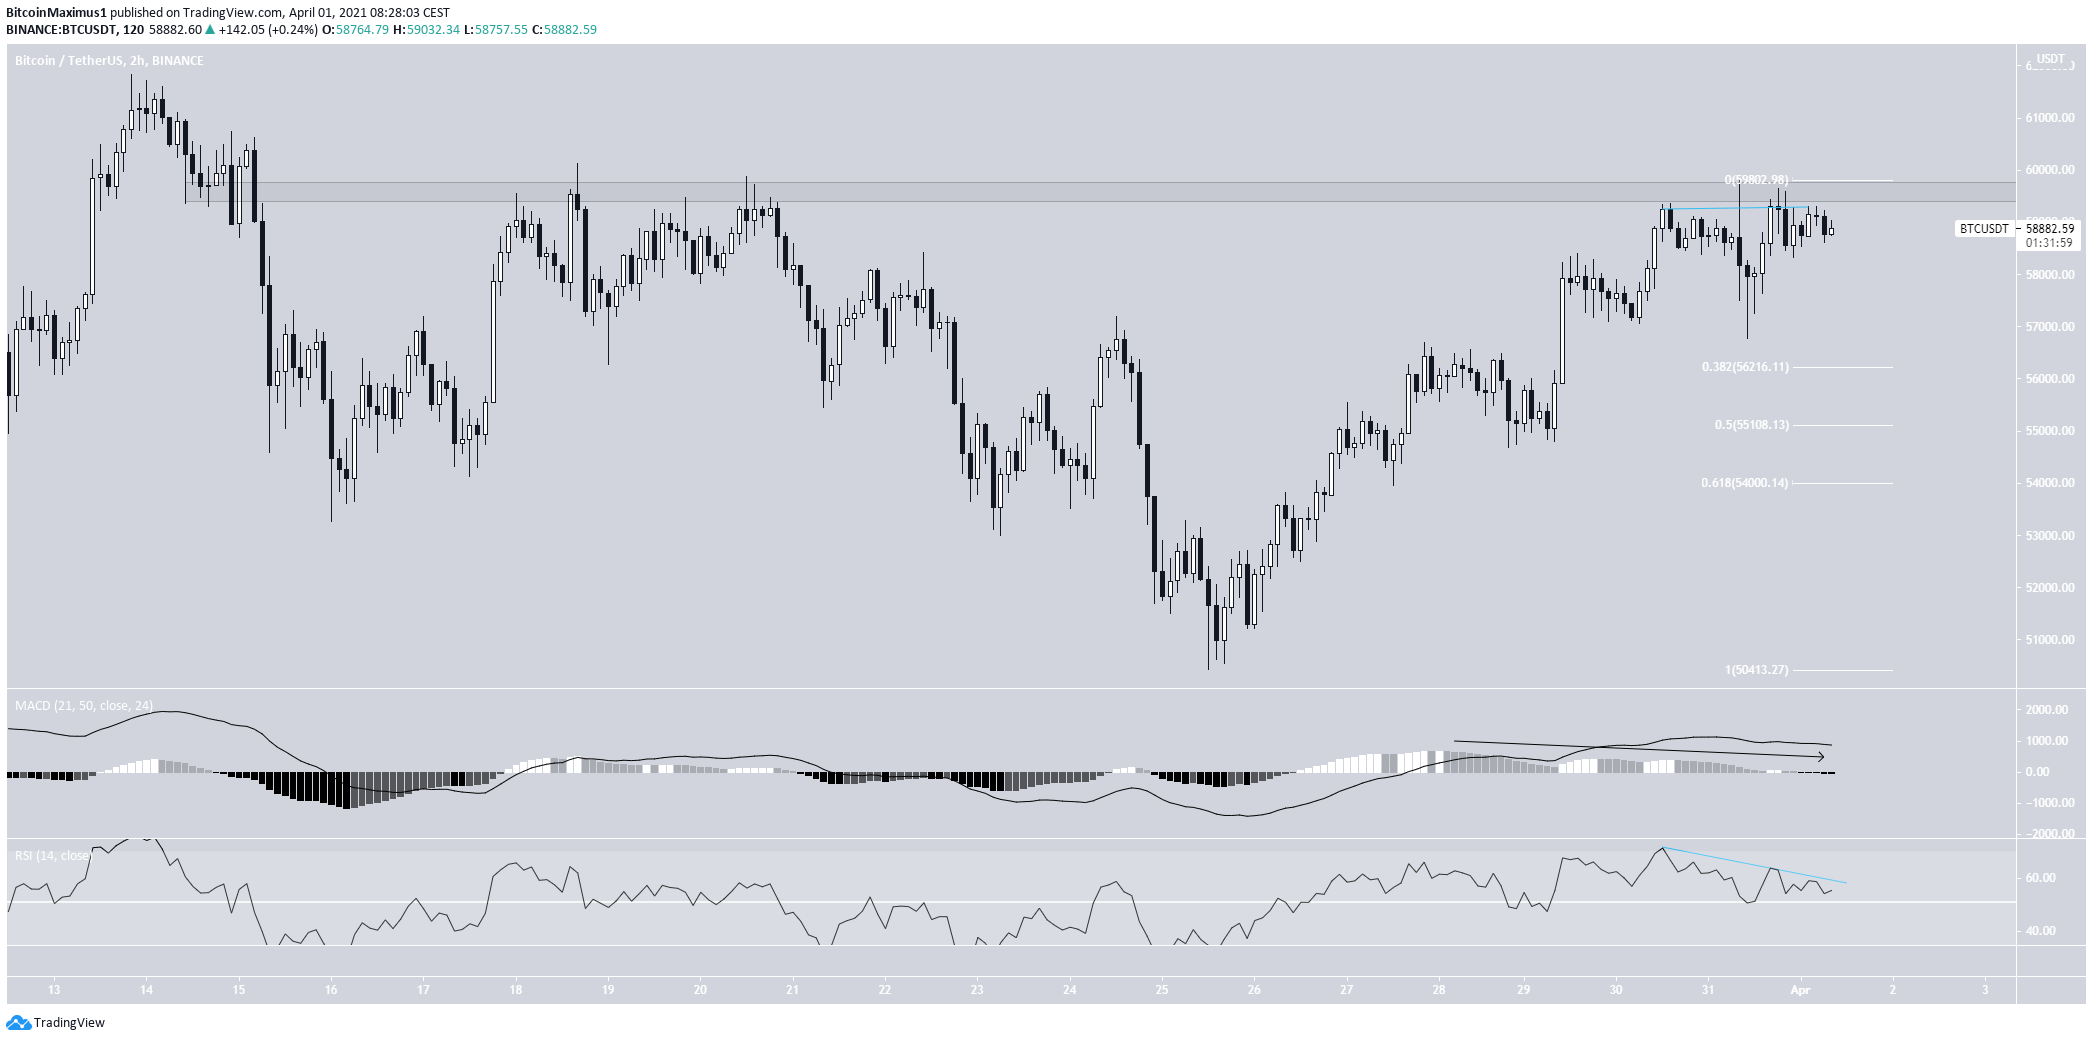
The two-hour chart further supports this, with an even more pronounced weakness in both the RSI and MACD.
Therefore, a short-term retracement would be the most likely scenario. This means that bitcoin could decrease towards the 0.382 Fib retracement level at $56,200, before resuming its upward movement.
Wave Count For Bitcoin
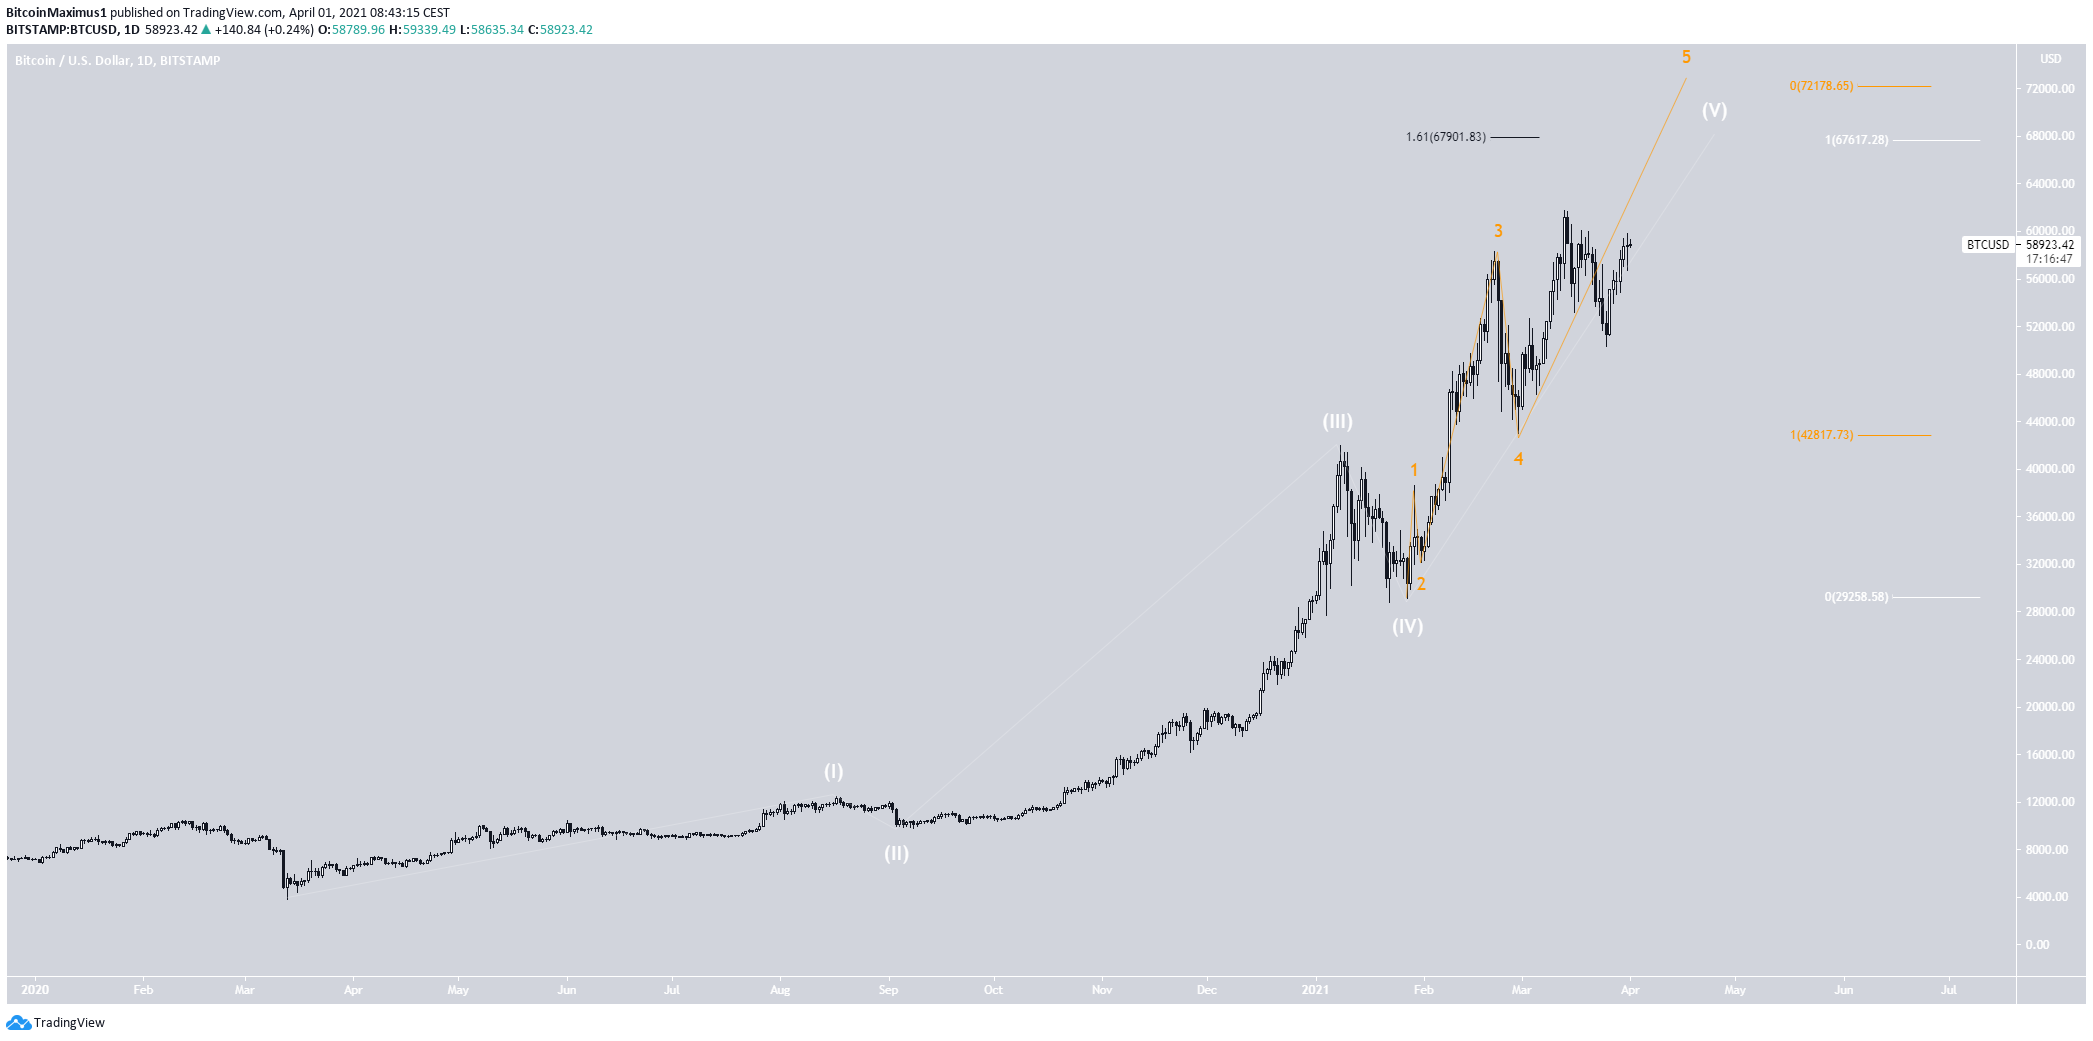
The wave count still suggests that BTC is expected to reach a new all-time high.
The most likely potential target for the top of the upcoming movement is found between $67,600 – $72,178. This target range is found using a combination of Fib projections and external Fib retracements.
Afterward, BTC is expected to undergo a correction.
Conclusion
BTC is expected to eventually break out above the $59,700 area and reach a new all-time high.
However, a short-term retracement is expected prior to the resumption of the upward movement.
For BeInCrypto’s previous bitcoin (BTC) analysis, click here.
