


Bitcoin (BTC) has broken out from a short-term resistance level while its daily RSI has returned to the bullish territory.
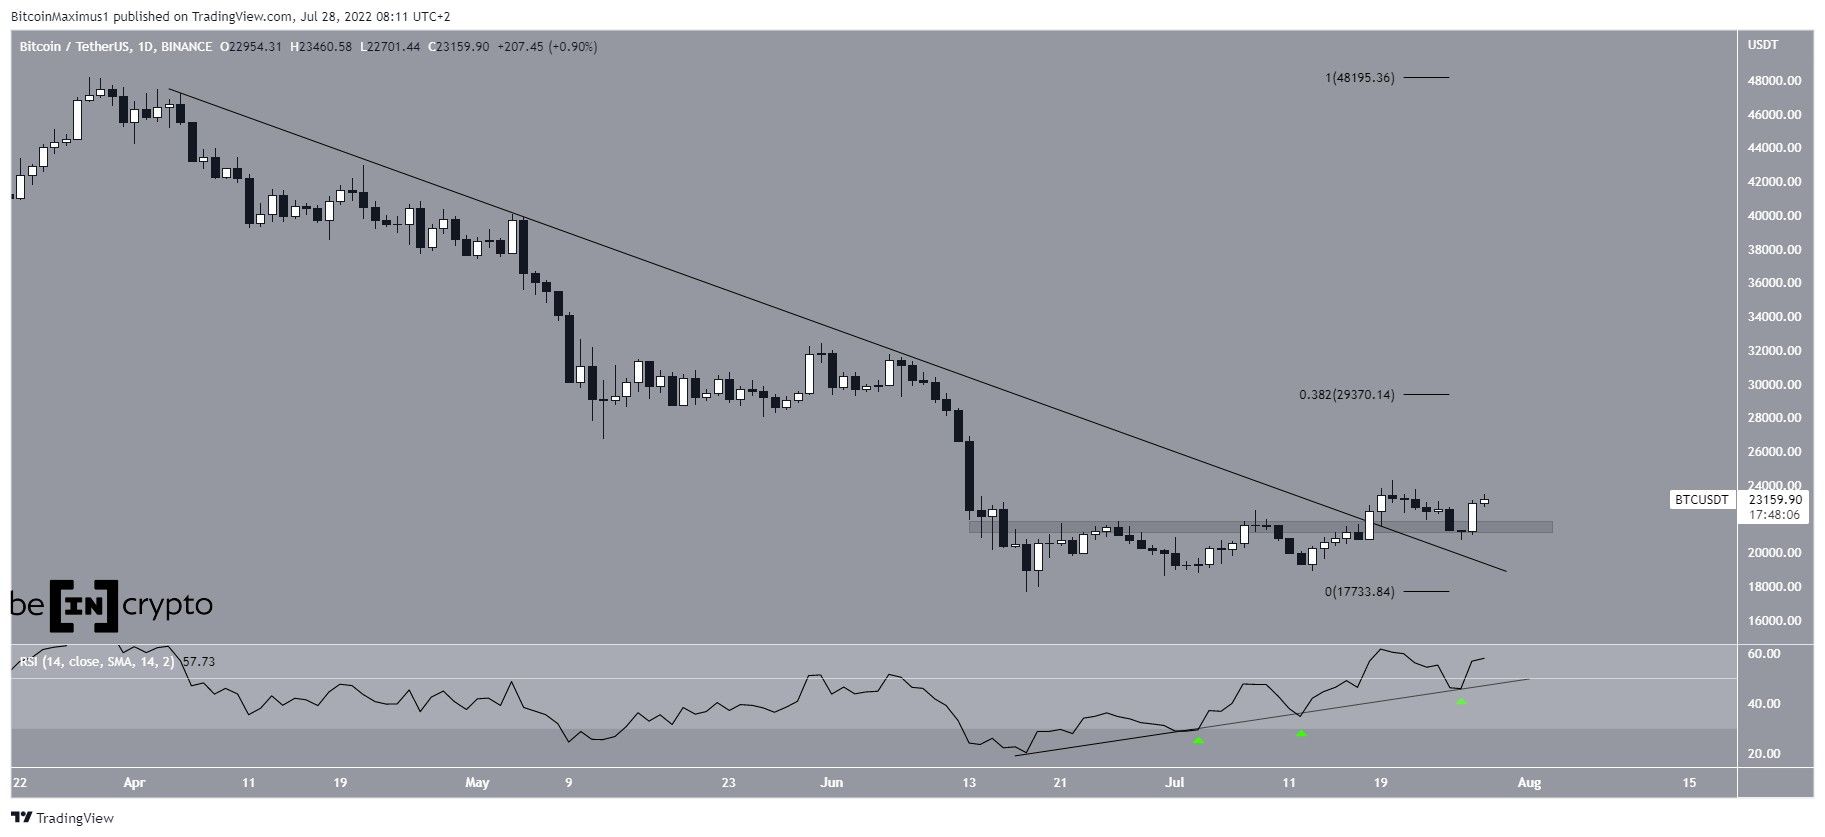
Bitcoin had been trading underneath a descending resistance line since the beginning of April. This downward movement led to a long-term low of $17,622 on June 18.
Bitcoin has been mostly moving upwards since then and broke out from the line on on July 18. While the price initially decreased, it managed to rebound significantly on July 27 and created a large bullish candlestick. In turn, this validated the $21,600 area as support.
More importantly, the daily RSI bounced from its ascending support line (green icon) and moved above 50 once again. This is considered a bullish sign, and means that the bullish structure is intact as long as the RSI is trading above the ascending support line.
If the upward move continues, the closest resistance area would likely be found at $29,370, created by the 0.382 Fib retracement resistance level.
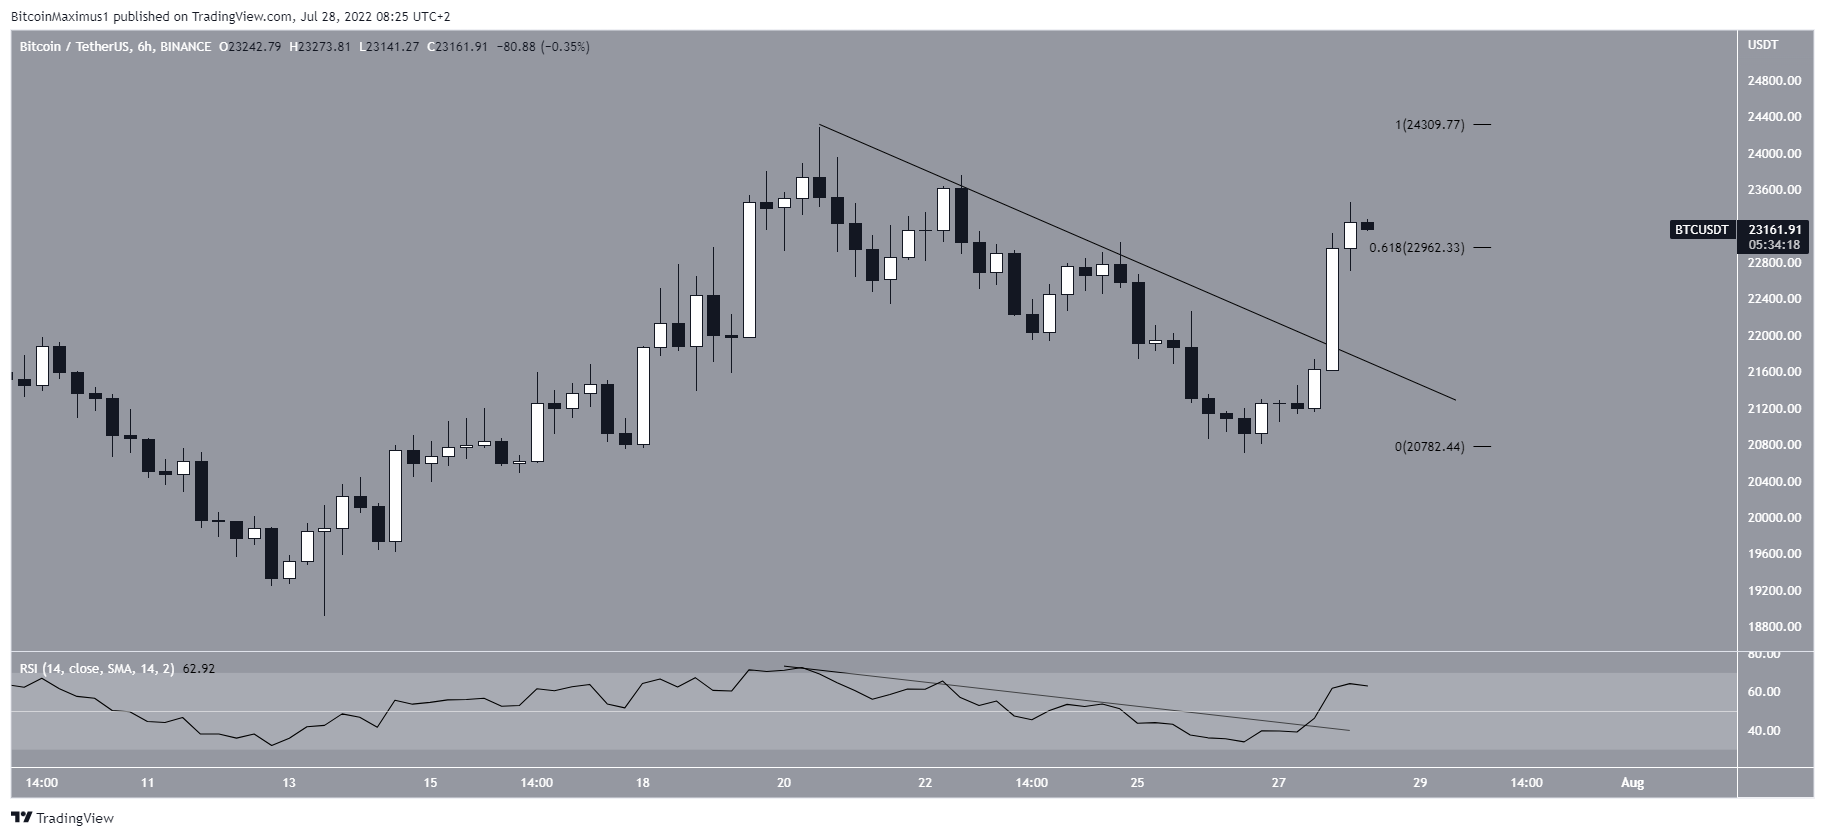
Short-term breakout
The six-hour chart supports the finding from the daily time frame and shows a breakout from a shorter-term descending resistance line. Afterwards, BTC managed to move above the 0.618 Fib retracement resistance level at $22,960.
Finally, the six-hour RSI has broken out from a descending resistance line and moved above 50, both of which are considered signs of a bullish trend.
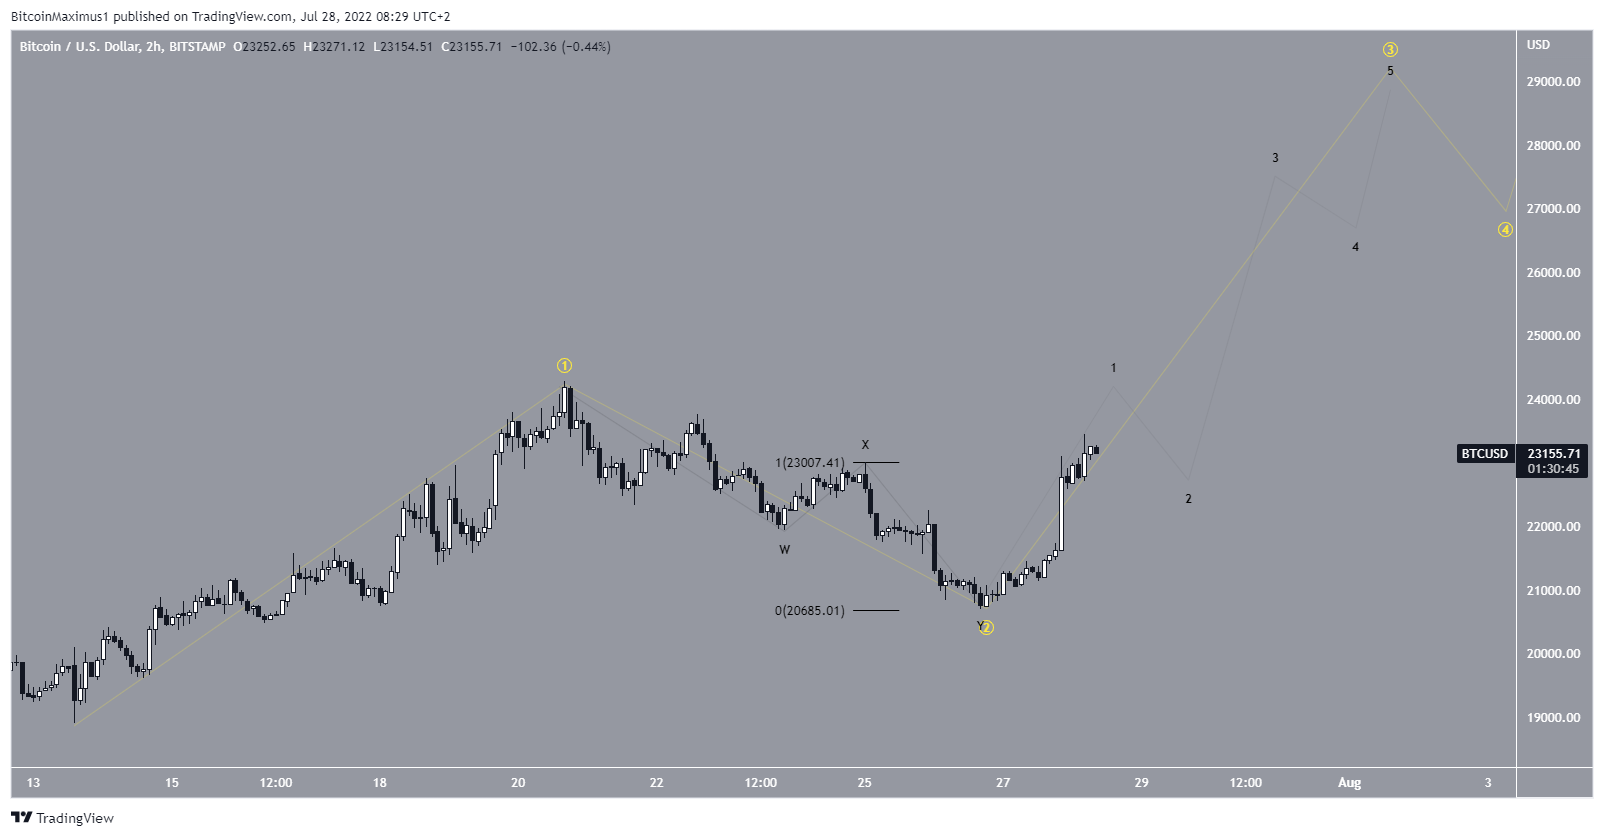
BTC wave count analysis
The most likely short-term wave count suggests that Bitcoin has completed wave two (yellow) of a five-wave upward trend. Inside the pattern, the sub-wave count (black) formed a complex W-X-Y corrective pattern, in which waves W and Y had an exact 1:1 ratio.
The July 27 increase is likely the beginning of wave three from the same movement. The sub-wave count is shown in black.
For Be[in]Crypto’s previous bitcoin (BTC) analysis, click here


