


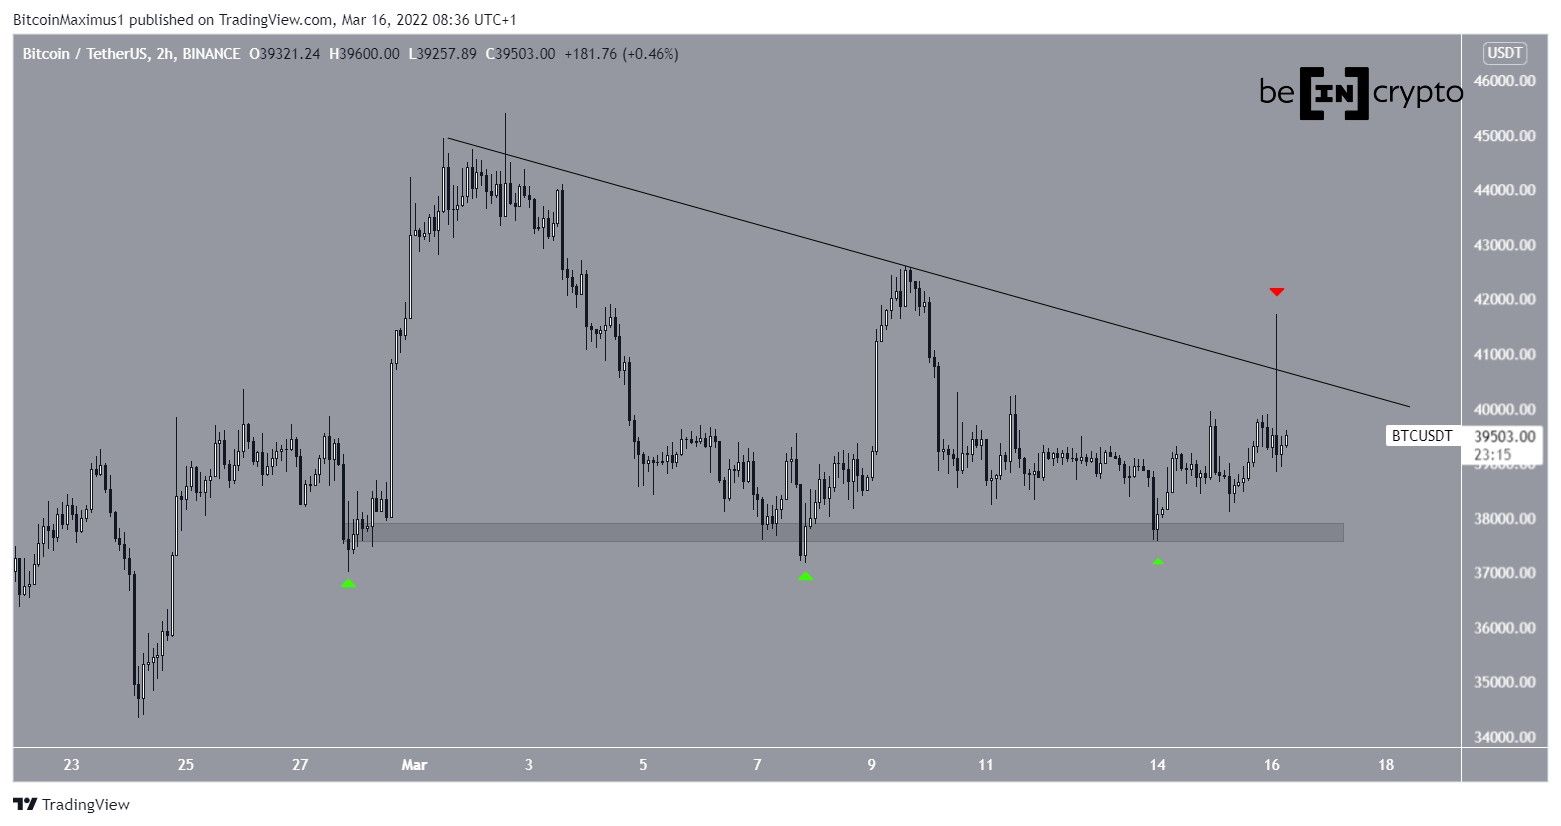
The price of Bitcoin (BTC) spiked significantly on March 16, reaching a local high of $41,718. However, it was rejected and has decreased slightly since.
Bitcoin has been decreasing underneath a descending resistance line since March 1. The line caused a rejection of the price on March 15, creating a very long upper wick (red icon). This is the fourth time the line rejected the price.
Throughout this period, BTC has bounced three times at the $37,700 horizontal support area, creating slightly higher highs each time (green icon).
It cannot be said with certainty if the movement is contained inside a symmetrical or descending triangle. The former is a neutral pattern while the latter is considered to be a bit more bearish.
Long BTC support
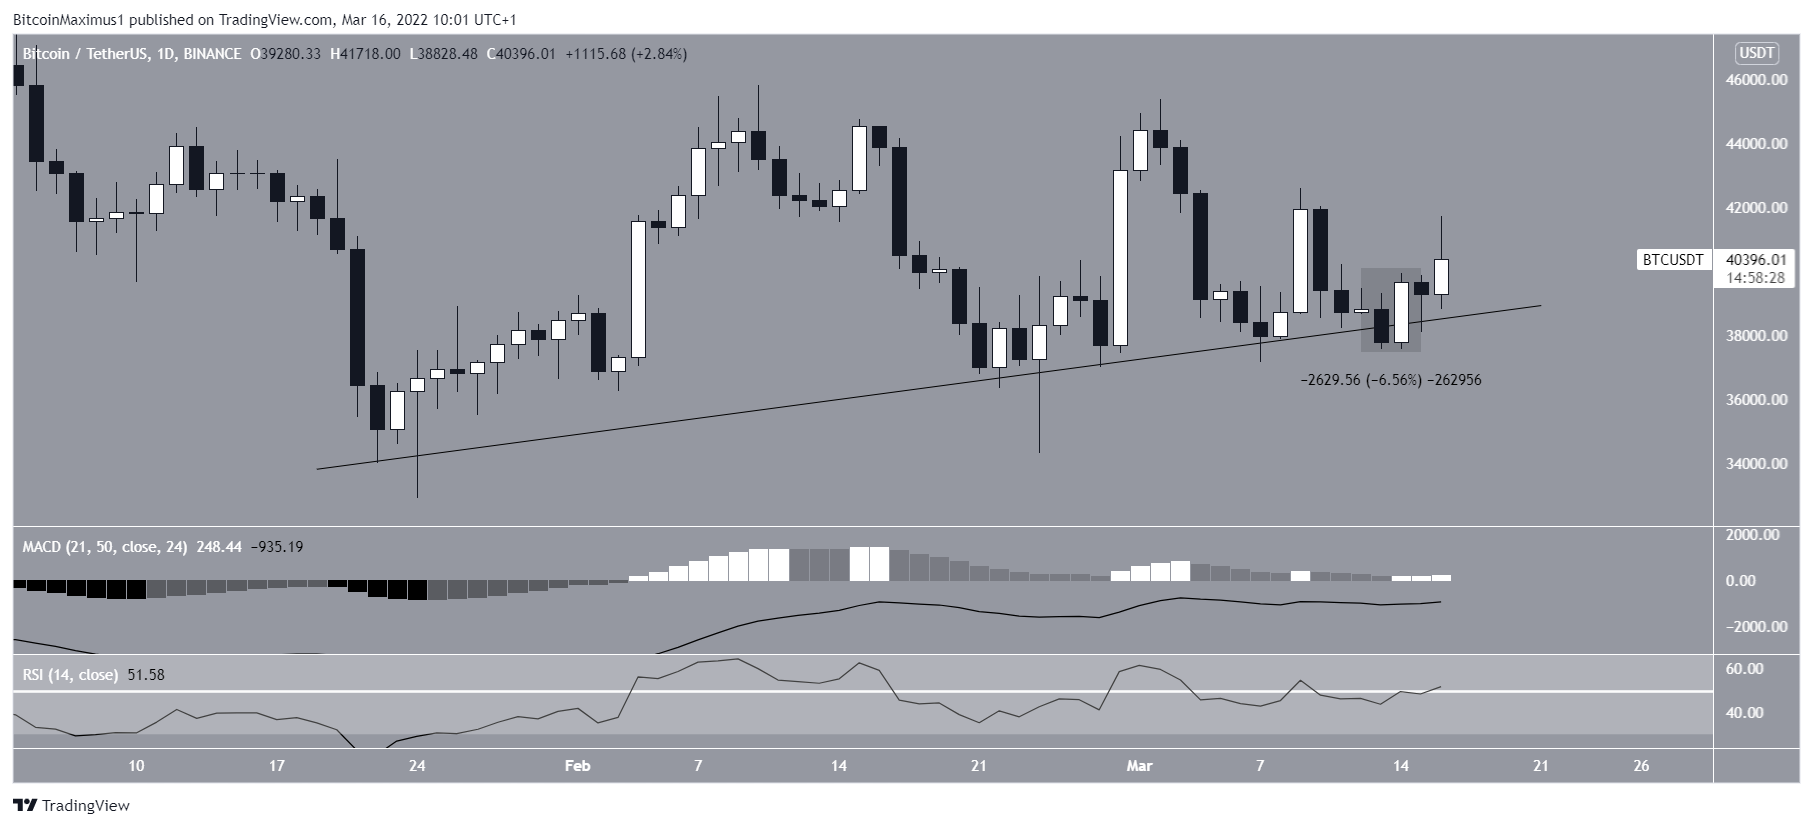
The daily chart shows that BTC has been moving above an ascending support line since Jan. 22. It most recently bounced at the line on March 14 and created a bullish engulfing candlestick. The price has been moving upwards since.
However, there are two uncertainties with the current movement concerning the neutrality of technical indicators and the potential for a long upper wick.
Both the RSI and MACD are increasing, but the former is at the 50-line while the latter is close to 0. Both of these are signs of a neutral trend.
As for the upper wick, there are more than 14 hours left until the daily close, so it is possible that BTC could still reach a close near its daily highs.
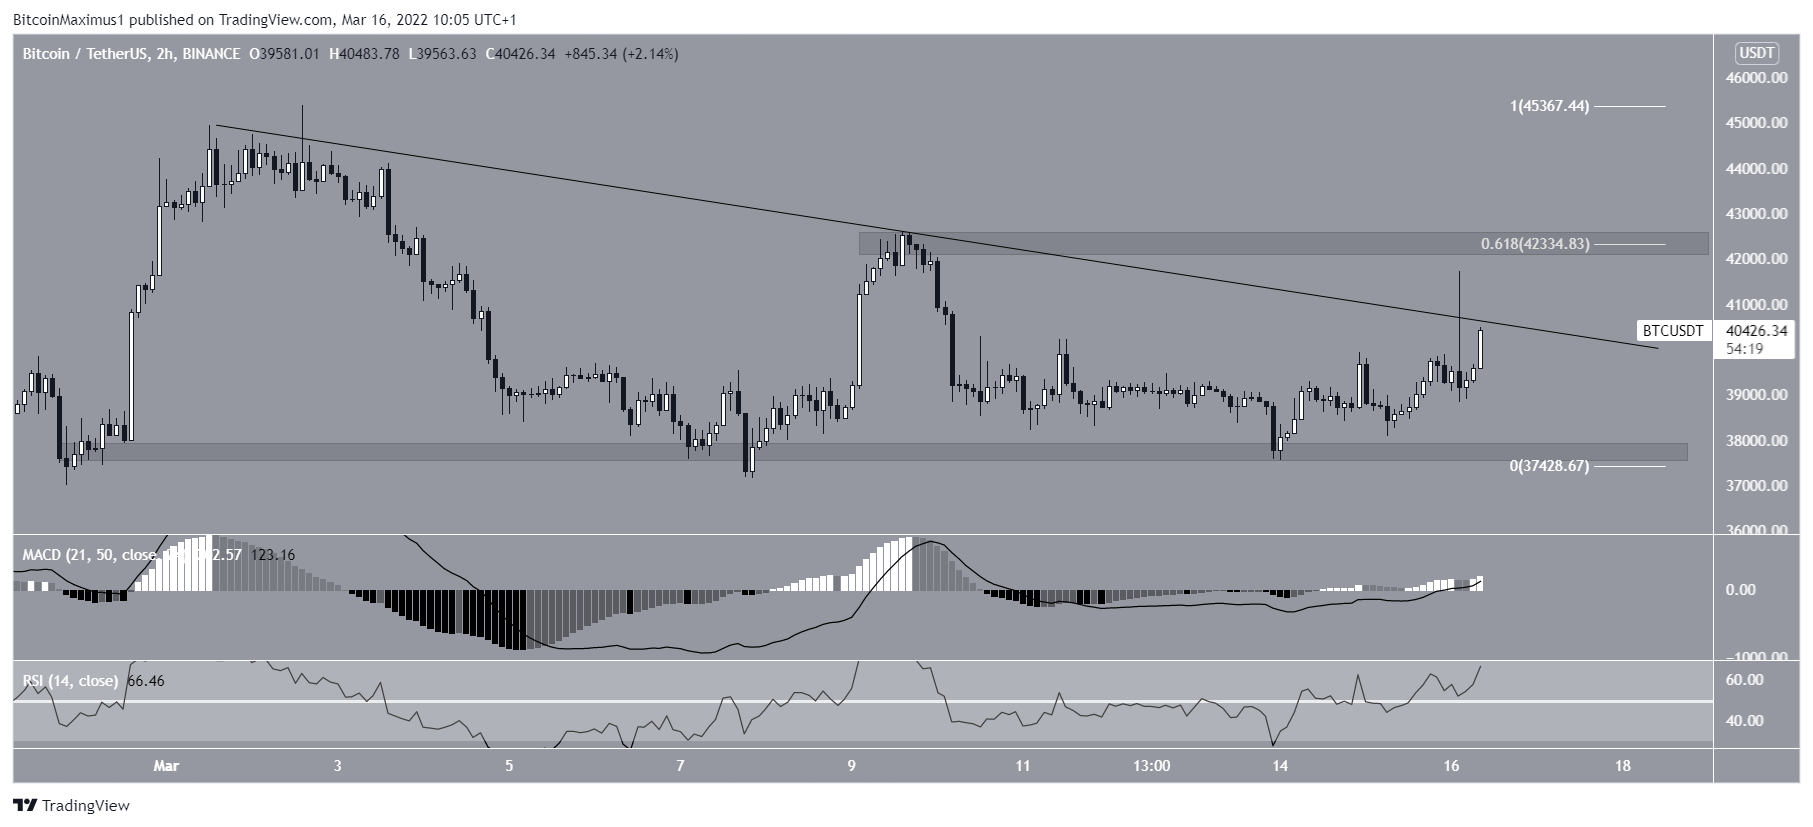
Moving back to the short-term descending resistance line, the two-hour chart suggests that a breakout is likely.
The reason for this is the increasing MACD and RSI and the fact that the former is positive while the latter is above 50.
The closest resistance area is found at $42,330. This is the 0.618 Fib retracement resistance level and a horizontal resistance area.
For BeInCrypto’s previous Bitcoin (BTC) analysis, click here


